Ethereum Price Prediction: ETH Price Faces Short-Term Pullback, but Long-Term Rebound Loom
December 2, 2025
According to price data compiled from TradingView, ETH has traded between $2,720 and $3,041 over recent sessions, reflecting an environment shaped by shifting liquidity conditions, ETF flows, and global risk sentiment. At the same time, ETF-related capital movements and tightening financial conditions continue to influence short-term price direction.
Current Market Scenario
Ethereum is currently trading near $2,739, showing notable weakness on both daily and monthly timeframes, based on aggregated market data from CoinMarketCap. This downturn follows substantial capital outflows from spot Ethereum exchange-traded funds.
According to ETF flow tracking data published by CoinShares, Ethereum-related investment products recorded approximately $1.42 billion in net outflows during November, a factor that may have contributed to short-term selling pressure.
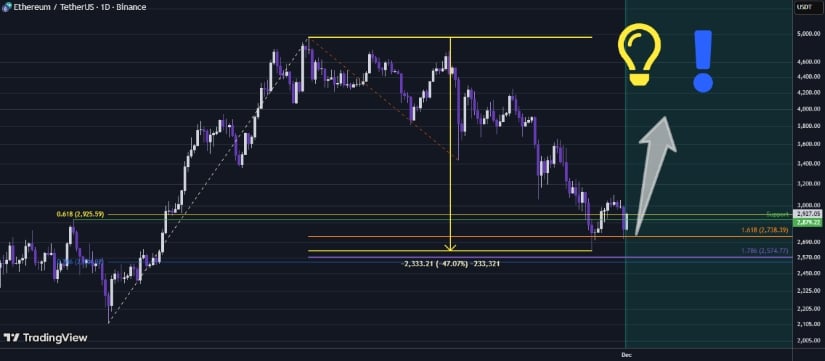
Ethereum is down ~47%, testing key support at a double Golden Window, suggesting a potential rebound; for educational purposes only, not financial advice. Source: dRends35 on TradingView
Market participants also continue to monitor broader macroeconomic influences, including global interest rate expectations, U.S. dollar liquidity conditions, and risk-on/risk-off rotations between equities and crypto assets. Analysts frequently note that Ethereum remains sensitive to these external forces, particularly during periods of tightening financial conditions.
From a technical perspective, chart watchers point to Ethereum’s prolonged sideways movement since 2021, alongside the emergence of a bearish double top—a pattern where price fails twice at a resistance level—and an ascending triangle, a consolidation structure that can break in either direction. These formations are commonly interpreted as signaling potential volatility before a clearer long-term trend develops.
Short-Term Downside Risks
Based on short-term technical levels observable on TradingView, some analysts suggest that if Ethereum fails to reclaim the $2,800 resistance zone, the price could drift toward the $2,620–$2,640 range. This area coincides with a previous demand zone where buying activity has appeared in past sessions.
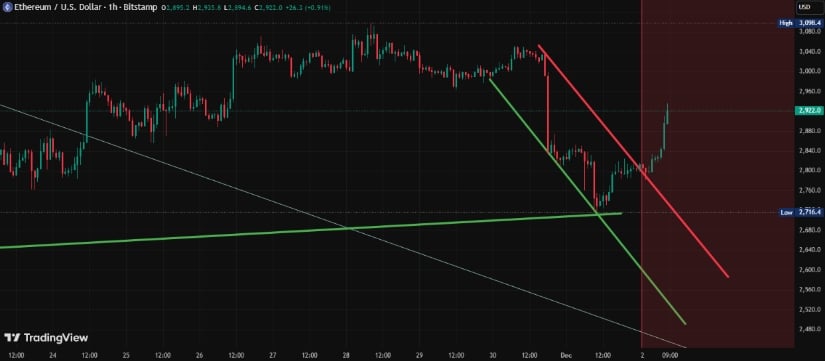
Ethereum appears technically weak on lower timeframes, with confirmation of a developing bearish channel potentially signaling a move toward $2,500 unless price decisively breaks above near-term resistance. Source: Mrbigman on TradingView
A derivatives-focused market strategist on social media recently noted that if ETH remains within a bearish channel—a downward-sloping price structure that reflects persistent selling pressure—and fails to break above resistance, additional downside movement could follow.
In a more bearish scenario, some historical retracement models—which measure how much of a previous rally is typically given back during corrections—indicate that a move toward $2,500 could occur if current support fails. These projections remain conditional and highly sensitive to incoming macro data and ETF flow trends.
Upside Outlook and Long-Term Potential
Despite near-term softness, longer-term indicators continue to attract attention from institutional and on-chain analysts. If ETH succeeds in reclaiming and holding above the $2,800 level, technical models suggest that a move toward the $3,000 region could become possible, particularly if broader market liquidity improves.

Ethereum analysis highlights $2,200, $1,500, and $1,100 as key historic DCA zones, reflecting typical 30%–60% pullbacks and long-term supply tightening post-EIP-1559. Source: Ali Martinez via X
Ali Charts, widely followed for on-chain metrics and long-term cycle analysis, has previously outlined a dollar-cost averaging framework that highlights $2,200, $1,500, and $1,100 as historically significant price zones rather than guarantees of future support. These levels align with prior accumulation areas, including the 2022 bear market structure and periods of elevated regulatory uncertainty.
From a structural perspective, analysts continue to monitor three long-term drivers that may influence Ethereum’s multi-year trajectory:
-
ETH staking participation, which reduces the liquid supply
-
EIP-1559 transaction fee burns, which permanently remove ETH from circulation
-
Layer-2 network adoption, which expands Ethereum’s economic throughput
Together, these factors are frequently cited as contributing variables in long-term valuation models, though outcomes remain dependent on market conditions.
Key Price Levels Being Observed
Market technicians continue to reference several price zones as technically significant based on historical trading behavior:
-
$2,800—Short-term resistance area; a sustained move above this level could alter near-term momentum
-
$2,500–$2,620 – Near-term downside region identified through prior consolidation
-
$1,500 and $1,100—Longer-term structural support zones from previous market cycles
Analysts suggest these levels may influence future volatility rather than determine it with certainty.
Ethereum Price Outlook Through 2025
Despite short-term weakness, longer-term indicators paint a different picture. Ethereum remains in a transition phase where macro headwinds, ETF capital flows, and technical corrections compete with broader adoption trends, staking dynamics, and on-chain activity growth.
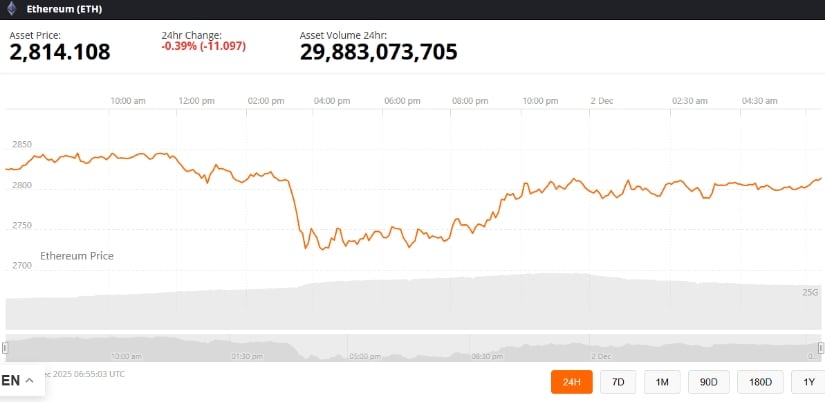
Ethereum was trading at around 2,814.10, down 0.39% in the last 24 hours at press time. Source: Ethereum price via Brave New Coin
Several analysts emphasize that Ethereum’s price trajectory historically unfolds in uneven cycles rather than linear expansions. As one crypto market researcher recently commented, Ethereum’s longer-term direction typically depends on liquidity conditions, technological upgrades, and investor risk appetite aligning simultaneously.
Looking ahead, ETH price expectations for 2025 and beyond remain highly conditional on factors such as ETF demand stability, global monetary policy shifts, and the pace of Ethereum ecosystem development.
Search
RECENT PRESS RELEASES
Related Post


