A novel approach to wind energy modeling in the context of climate change at Zaafrana region in Egypt
March 4, 2025
Abstract
Global warming, driven by the excessive emission of greenhouse gases from the combustion of fossil fuels, has emerged as a critical environmental challenge which is considered as a motivation for this research. Where, the switch to sustainable energy sources is crucial because of the pressing need to slow down climate change and lower carbon footprints. Of all the renewable energy sources, wind energy is particularly important as a means of reducing carbon emissions from the generation of electricity. With the increase in the penetration of renewable energy resources in electrical power systems, the stochastic behavior of the renewable energy resources has to be taken into account for better analysis in power systems. However, the stochastic behavior of the renewable energy is also affected by the environmental conditions. In this context, The main objective of this paper is to present a novel wind energy modeling that includes the effect of ambient temperature on the wind turbine capabilities. This effect is presented as the de-rating curve for wind turbine output power to respect the thermal capabilities of the electrical components of the wind turbine. That’s why this novel model is developed to consider the effect of ambient temperature to represent the practical limitations of wind turbines which wasn’t considered by previous literature although the temperature has a siginicant impact on the wind turbine output power. In this Paper, Gamesa G80 wind turbine is used to perform the numerical analysis of the proposed new model. Moreover, Exponential Distribution Optimizer (EDO), Aquila Optimizer (AO), and Equilibrium Optimizer (EO) algorithms are used to find various probability distribution functions (PDFs) parameters to model wind speed data from Zaafrana region in Egypt using Root Mean Square Error (RMSE) and Coefficient of Correlation (R^2) as judging criteria. In addition, real temperature data from the same site are used to validate the proposed model compared to the manufacturer’s capabilities. The results show that mixed PDFs provide a better representation for the wind speed data. Moreover, the study demonstrates that ambient temperature cannot be neglected in wind power modeling, as the wind turbine output power varies significantly. Additionally, this work highlights the impact of climate change on the efficiency of renewable energy sources like the wind energy. The proposed wind energy model could be valuable to system operators as a decision-making aid when dealing with and analyzing complex power systems.
Introduction
Alerts as a result of global warming and growing environmental concerns have been raised significantly as a result of using fossil fuels to generate electricity. Furthermore, the development of renewable energy technology has been essential in establishing them as the most economical and ecologically viable options. Hence, the efficient control and operation of power systems might be significantly affected by the strategic integration of renewable energy resources in suitable areas this will imply potential adjustments to traditional power network characteristics1,2,3,4. One of the renewable energy resources with high penetration and noticeable share over the past decades is the wind energy conversion system where the wind energy is converted to mechanical energy then this energy is converted into electrical energy5,6,7. According to the International Renewable Energy Agency (IRENA), the installed capacity of wind energy conversion systems reached 1017.4 GW in 2023 compared to 563.68 GW in 20188. With the continuous penetration of renewable energies, the stochastic behavior should be taken into account as it has a significant impact on electrical system stability, reserve scheduling, electrical losses and carbon emissions9. For better evaluation of wind energy in the electric networks, the stochastic characteristics for wind have to be taken into account where, this has to be done for every location with a potential for wind energy production through assessing the wind speed historical data through modeling the wind profile10.
Different PDFs have been used to model wind speed depending on each location such as Weibull, Lognormal, Gamma, Beta, Rayleigh and other distribution functions11. Many studies model renewable energy resources to predict the power generation for wind energy to maintain power system security considering wind power variability techniques, where several methods such as numerical, statistical12,13. Persistence, physical, statistical, and hybrid models were evaluated to accurately predict the available wind power Moreover, a new proposed model managed to provide a more accurate wind speed forecast14,15. Other techniques, such as kernel-density was also used to estimate the wind speed PDF in16.
The up-crossing rate method was used to estimate Rayleigh and Weibull PDFs parameters based on cumulative distribution function mapping, Rayleigh function was better compared to Weibull17. Numerical methods were used to estimate the Weibull and Gamma PDFs parameters for wind energy for modeling wind speed18,19. Maximum likelihood, modified maximum likelihood and Multi-objective moments methods were used to evaluate PDFs to model wind speed, the analysis showed that extended generalized Lindley and generalized gamma distributions had better representation20,21. The Power density (PD) method was also used as a numerical technique in22.
The modified maximum likelihood method was used to find the parameters for Weibull and Modified Weibull Distribution, the validation tests were performed using Chi-square and Kolmogorov-Smirnov, the results showed the superiority of Modified Weibull Distribution23. Moreover, Empirical, Moment and Energy pattern factor methods were used in24 to determine the parameters for Rayleigh and Weibull PDFs. Monte Carlo simulation (MCS) with its variations were used to find parameters for wind speed PDFs18. Quasi-MCS using truncated regular vine copula was more superior compared to numerical methods25. Metropolis–coupled Markov chain MCS was tested to predict the stochastic behavior of wind energy26. MCS combined with the K-means clustering method was proposed in27 and gave better results and reduced computational time.
Recently, Artificial Intelligence (AI) optimization algorithms are used over numerical methods to estimate PDFs parameters due to their higher accuracy. Genetic algorithm (GA), Bacterial Foraging Optimization algorithm (BFOA), Simulated Annealing (SA) were used to obtain Weibull PDF parameters showing better results over classical methods28. Firefly algorithm (FA) was used to obtain the Weibull PDF parameters in29. Whale Optimization algorithm (WOA) was used to obtain parameters for Weibull, Gamma and Rayleigh PDFs in30. Particle Swarm optimization (PSO), Cuckoo Search algorithm (CSA), Gray Wolf algorithm (GWA), Ant Colony optimization (ACO), Salp Swarm optimization (SSO)31,32, adaptive dynamic grey wolf-dipper throated optimization (ADGWDTO) algorithm33 were also used to obtain Weibull PDF parameters. Further approaches to better model wind speeds were implemented where, Two and three components mixture PDFs were evaluated based on Weibull, Gamma, and Inverse Gaussian PDFs. Aquila Optimizer (AO) and modern Mayfly algorithm (MA) were used to obtain he parameters for various PDFs combinations. The results showed that mixed PDFs managed to provide more accurate representation using root mean square error (RMSE), Chi-square error ((:X^2)), and coefficient of Correlation ((:R^2)) as judging criteria34,35.
Based on the previous studies, it can be found that there are some limitations on modeling the wind energy that can be summarized as:
-
Lack of analysis of wind speed modeling using mixed PDFs.
-
Lack of linkage between real wind turbine performance and theoretical models used in power system problem analysis.
-
No consideration for the environment and ambient temperature impact on wind energy modeling.
To cover the previous gaps, this paper provides;
-
Wind speed modeling using mixed PDFs combinations to represent wind speed accurately.
-
Novel wind enery model to consider the effect of ambient temperature on wind turbine output power.
-
A comparision between the classical and proposed wind energy models to show the contribution and achievements of the novel model.
In this paper, Weibull, Gamma, and Lognormal PDFs as well as their mixtures to accurately model the historical wind data in Zaafarana region in Egypt with a duration of three years. Where, Exponential Distribution Optimizer (EDO), Aquila Optimizer (AO), and Equilibrium Optimizer (EO) algorithms are used to find the optimum PDF parameters with the objective function of minimizing the root mean square error (RMSE). Moreover, the paper proposes a novel wind energy model incorporating the effect of the ambient temperature as the performance of wind turbine is reduced when wind turbine operates at high ambient temperature to respect the electrical components thermal capabilities of the turbine. Each manufacturer has a de-rating curve for his turbines. In this paper, Gamesa G80 wind turbine was used as an example to develop this model. The model is verified using historical temperature site data where, MCS is used to check that the proposed model matches the manufacturer de-rating curve. Finally, the wind power probability distribution is presented at different ambient temperature showing how the performance of wind energy system can vary significantly when the ambient temperature is taken into account. Hence, this model could provide more accuracy when wind energy systems are assessed in electrical power systems.
This paper is structured as follows: Firstly, the wind turbine speed modeling using various PDFs as well as the methods to estimate PDFs parameters are presented. Section 2. The optimization algorithms, EDO, AO and EO in addition to the problem formulation, are presented in Sect. 3. The classical wind energy modeling and wind power probability distribution is performed based on the historical data from Zaafarana in Egypt. Section 4. The novel model for wind energy considering the effect of ambient temperature is described in Sect. 5 where, the analysis is done based on Gamesa G80 wind turbine as a reference. Finally, In Sect. 6, the conclusion of the work is presented.
Wind speed modeling
This section discusses the common PDFs used for wind speed modeling with a focus on the PDFs used in this paper. Moreover, Different methods, numerical and artificial intelligence methods are used to obtain the PDFs parameters.
Probability distribution functions
Weibull probability function
The Weibull distribution is developed by Weibull36. It’s a two- parameter PDF where, the PDF, (:f_wleft(vright):), and the cumulative function (:F_wleft(vright)) are given by Eqs. (1–2) respectively. Weibull PDF is considered the most commonly used PDF for modelling the stochastic behaviour of wind energy.
Where, (:v) represents the wind speed, k and c are the shape and scale factors, respectively.
Lognormal probability function
The lognormal PDF, known as the Gaussian distribution, This probability function is named as the Galton distribution37 and with two parameters. Equation (3) represents the PDF, (:f_Lleft(vright)).
Where,, (:v) represents the wind speed, (:mu:) is mean value and σ is the standard deviation.
Gamma probability function
The gamma PDF is commonly used distribution due to its relation to exponential and normal distributions with two control parameters38. Equation (3) represents the PDF, (:f_Gleft(vright)).
Where, (:v) represents the wind speed, y and z are the scale and shape factors, respectively.
Mixed probability function
For enhanced representation, having mixed two or three PDFs was an approach provided in34 and it provided higher accuracy in modeling wind speed with lower errors compared to a single PDF. Equations (5–6) represent the mixed-two and mixed-three PDFs in a generic form.
Where, (:f_1), (:f_2) and (:f_3) are the first, second and third PDF respectively. (:w_1), (:w_2) and (:w_3) are the weights for each PDF function respectively. In case of mixed-2 function, the summation of weights, (:w_1+:w_2), is 1. For mixed-3 function, the summation of weights, (:w_1+:w_2+w_3), is 1.
Methods for estimating PDF parameters
Several methods are used to estimate PDF parameters. In this part, two common categories will be discussed in brief; Numerical and AI methods39.
Numerical methods
This section provides an overview for the common numerical methods being used with Weibull PDF. Now AI methods have shown more accurate results compared to numerical methods.
Maximum likelihood method
Maximum likelihood method requires extensive numerical iteration. Shape and scale parameters can be calculated by using Eqs. (7–8).
Where, (:v_i) is the wind speed in time step i and n is the number of non-zero points.
Modified maximum likelihood method
This method can be used when wind speed frequency distribution format is available. Equations (9–10) can be used to calculate the shape and scale parameters.
Where, (:v_i) is the wind speed central to bin i, n the number of bins, (:gleft(v_iright):)the frequency for wind speed ranging within bin i, and (:g(v:ge:0))is the probability for wind speed equal to or exceeding zero.
Energy pattern factor
This method is based on averaging a data set of wind speeds. Energy pattern factor ((:E_PF)), shape and scale factors are calculated as per Eqs. (11–13).
Where, (:stackrel-v^3) is the mean of wind speed cubes, (:stackrel-v) is the mean of wind speed.
Emperical method
This method is a subset of other method called the Moment method but using simplified formulas. Equations (13–14) can be used to calculate scale and shape factors respectively.
Where, (:sigma:) is the standard deviation of the wind data.
Graphical method
Using the principle of least squares, the graphic method fits a straight line to wind speed data; however, the time-series data must be divided into bins. Equation (15) represents the cumulative distribution function after applying double logarithmic transformation.
Artificial intelligence method
Recently, finding the optimal parameters to model wind speed PDFs can be achieved by using artificial intelligence optimization algorithms as they showed more accuracy and reliable representation compared to other methods. The objective function is set as a test criterion, where, the choice of this objective function is the factor most crucial to the results. Figure 1 shows the flow chart for using AI optimization algorithms to obtain the best PDFs parameters for wind speed modeling.
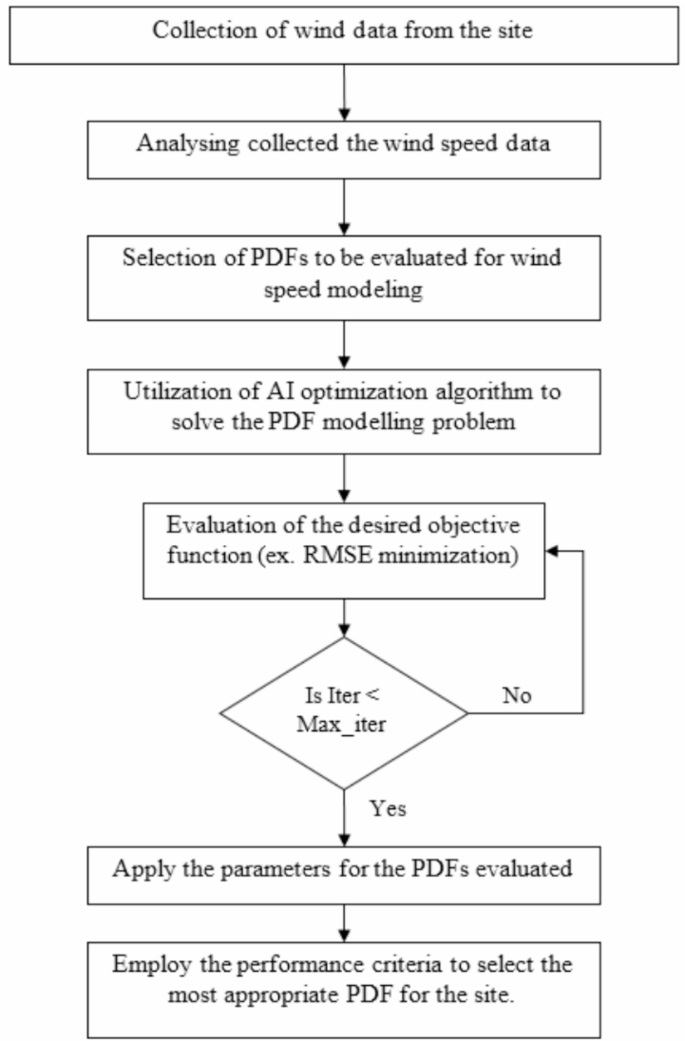
AI Optimization Method Flow Chart for Wind Speed Modeling.
In the next section, three AI optimization algorithms used in this paper are discussed in detail. Moreover, the objective function and evaluation criteria for selecting the suitable PDF are presented.
Optimization algorithms and objective function
Optimization algorithms
Exponential distribution optimizer
The EDO is a novel optimization algorithm introduced in 202340. Statistical and severalbenchmark tests and engineering problems were used showing the excellence of EDO technique40,41,42. EDO takes its foundational principles from the theories of exponential distribution. this continuous probability distribution that is frequently used to simulate how long it takes for an event to occur. Moreover, it simulates the intervals of time between events that occur randomly and independently at a constant rate. An exponential random variable, x, associated with a rate parameter,(::lambda:). The relationship between these parameters can be expressed as PDF in Eq. (16)41.
Memoryless feature
The “memoryless� feature of some statistical probability distributions is one of their distinctive features. This suggests that the likelihood that an upcoming event will occur is unaffected by previous occurrences. This memoryless quality is captured by the continuous exponential distribution, particularly when measuring the amount of time until an event occurs. When x, a random variable, follows the exponential distribution with this memoryless property, this means for any positive whole numbers s and t belonging to the series 0,1,2,. ∞ then the following comes true. Equations (17–20) explain the memoryless feature.
Search
RECENT PRESS RELEASES
Related Post


