Ethereum Sits at $1,644 — 10 Months After Its $4,946 All-Time High, What Changed
June 9, 2026
Ethereum is trading near $1,644, roughly 67% below its all-time high of $4,946 set on Aug. 24, 2025, as a combination of macro pressure, persistent ETF outflows, and bitcoin’s rising dominance has pushed the second-largest cryptocurrency to its weakest relative position in years.
-
Key Takeaways:
- Ethereum trades near $1,644, down 66.8% from its August 2025 all-time high of $4,946.
- Spot Ethereum ETFs recorded a single-week outflow of $241M, with BlackRock briefly reversing the trend.
- Ethereum’s DeFi TVL holds near $37B in June 2026, but $ETH dominance has compressed to roughly 9%.
$ETH by the Numbers
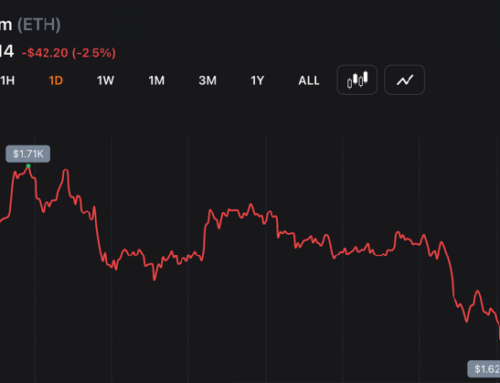
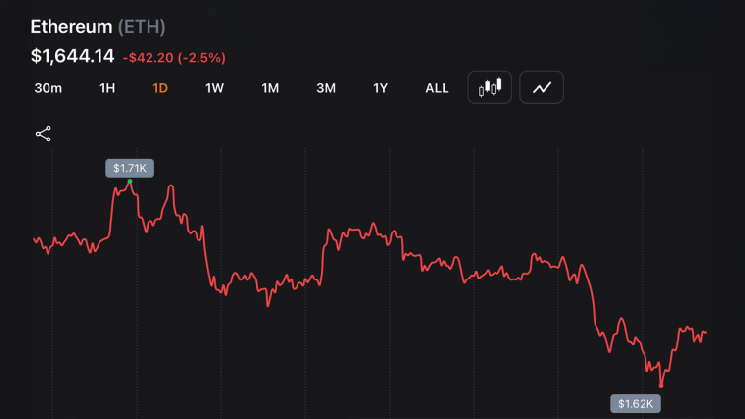
As of June 9, 2026, $ETH’s 24-hour range sits between $1,619 and $1,712, with a seven-day range spanning $1,522 to $1,909. At 2:30 p.m. EDT on Tuesday, $ETH is $1,644 per unit. Performance across timeframes paints a bleak picture:
- 24 hours: -2.6%
- 7 days: -14.5%
- 14 days: -20.9%
- 30 days: -30.5%
- 1 year: -35.9%
Ethereum’s market cap stands near $199 billion. Its dominance has compressed to roughly 9.1% to 9.3%, compared to bitcoin’s dominance near 58%.
Why $ETH Is Struggling
Analysts point to several overlapping pressures. Bitcoin’s dominance near 58% reflects institutional preference for $BTC as a store-of-value asset, amplified by stronger inflows into spot bitcoin exchange-traded funds (ETFs). The $ETH/ $BTC ratio touched lows near 0.027 in May, signaling significant capital rotation away from ethereum during periods of macro uncertainty.
Spot ethereum ETFs have added to the headwinds. One multi-week outflow streak saw funds shed approximately $241 million in a single week. A brief inflow of $19 million, led by Blackrock, broke a 17-day outflow run but provided only temporary relief. One converted fund logged roughly $3 billion in redemptions following its ETF conversion, reflecting pent-up selling pressure that had built ahead of the product launch.
Macro conditions have not helped. Analysts, including Fundstrat’s Tom Lee, have flagged the inverse correlation between oil prices and $ETH, describing the relationship as reaching historically elevated levels. Sticky inflation, geopolitical tensions, and broader risk-off sentiment have weighed harder on high-beta assets like $ETH than on bitcoin.
Upgrade Trade-offs
The Pectra upgrade, activated May 7, 2025, introduced account abstraction via EIP-7702, raised the maximum validator stake to 2,048 $ETH, and expanded blob throughput to reduce Layer 2 fees. The Fusaka upgrade in December 2025 extended those scaling improvements. Both are considered long-term positives for ether’s usability and adoption.
However, lower base-layer fees have reduced $ETH burn under EIP-1559, easing the deflationary pressure that had previously supported $ETH’s price narrative. Combined with layer two ( L2) activity pulling transaction volume from mainnet, some analysts argue $ETH is evolving more into infrastructure than a high-demand gas token in the near term.
The Bull Case Remains Intact
Despite the drawdown, many proponents believe ethereum‘s fundamentals remain among the strongest in its history. Decentralized finance ( DeFi) total value locked (TVL) on Ethereum mainnet stands near $37 billion, still the largest by a wide margin. Developer activity, institutional tokenization experiments, and real-world asset ( RWA) narratives continue to favor Ethereum as the dominant smart contract settlement layer.
Staking also provides a structural floor of demand, with roughly 30% or more of $ETH supply locked in validators earning approximately 2% to 4% APY. The Glamsterdam upgrade, expected later in 2026, targets MEV fairness and efficiency improvements.
Recovery likely hinges on a macro shift toward risk-on sentiment, a rotation out of bitcoin dominance, and continued execution on Ethereum’s roadmap.
Search
RECENT PRESS RELEASES
Related Post