Abstract
Regional clusters of energy producers and consumers can be realized by integrating household Battery Energy Storage (BES) systems with Renewable Energy Sources (RES) and linking them to the main utility grid. These clusters, functioning as grid-connected microgrids (MGs), act as controllable units within the broader energy distribution network. As distribution systems evolve to include higher MG penetration, the need for efficient and scalable energy management becomes critical to ensure technical compatibility with grid objectives and operational constraints. Additionally, understanding the impact of battery usage patterns on degradation is essential for developing long-term, cost-effective energy management strategies. This paper presents a novel Grid-Connected Microgrid Energy Management (GCM-EM) model that incorporates both economic and technical constraints, with Battery Energy Storage (BES) as the central flexible resource. The proposed model supports both uncoordinated (microgrid-autonomous) and coordinated (DSO-integrated) scheduling schemes. The novelty lies in its ability to capture real-world BES degradation dynamics—including cycle aging and depth-of-discharge (DoD) effects—within an optimization-based energy scheduling framework. The scheduling model leverages mixed-integer programming, AC optimal power flow, and rolling-horizon control to achieve both local and system-level operational goals. The model’s performance was validated using simulations on two representative test systems: a university campus distribution grid and a standardized 33-bus power network. Results demonstrate that localized MG optimization can reduce energy costs by up to 2%. At the same time, coordination with the Distribution System Operator (DSO) further enhances grid-level cost efficiency—though sometimes at the expense of local MG economic optimality. Importantly, the model preserves data privacy during coordination and maintains compliance with distribution grid constraints. Furthermore, the model was implemented in a real building-level microgrid (BMG), where it effectively minimized BES operational and degradation costs. Compared to conventional EMS frameworks that ignore battery wear, the proposed model achieved a 3% reduction in combined annual energy and degradation costs. Integration into actual EMS platforms also enabled optimized BES dispatch, reduced municipal grid dependence, enhanced MG operational flexibility, and lowered overall network operating expenses. This research provides a comprehensive and practically validated energy management architecture for BES-integrated microgrids. By combining advanced scheduling strategies with accurate degradation modeling and multi-agent coordination, the proposed system represents a significant advancement toward economically sustainable and technically robust distributed energy networks.
Introduction
The energy sector is central to mitigating global warming, developing renewable energy sources, improving air quality, and promoting sustainable development. Attaining these goals requires a significant cut in CO2 emissions. To address the problem of global warming, there is a need to shift to renewable energy sources, which include wind, hydropower, and solar energy, replacing fossil fuels1. Although substantial efforts have been expended towards the general adoption of renewable energy sources (RES), the incorporation of RES and residential PV systems is still constrained. Subsidies on solar panels have, however, brought the cost of PV energy generation within reach and appeal to consumers, resulting in a solar energy revolution2. This transition also reflects a shift from passive to active users, where consumers generate electricity for their consumption or export to the grid.
RS-BES systems are experiencing increased demand due to the continued decline in battery prices, which enables them to reduce consumers’ electricity bills3. Battery energy storage systems installed behind the meter enhance residential self-consumption and increase revenue for small-scale renewable energy producers through integration with photovoltaic systems. EV batteries that reach retirement stages show great potential to advance load-shifting operations while providing cost benefits4,5.
RS-BES systems that are tied to small production facilities can form microgrids6. Boundaries of an MG are interconnected loads and distributed energy resources, which can be connected both in grid-connected and island operations7. The main features of an MG are the personal control of both the production facilities and demand points in the system, as well as the smooth operation of the system. Distribution systems incorporating controllable loads, distributed generators and storage devices are coordinated in the overall power grid by autonomous or harmonious control8.
The configuration of Multi-source Generation facilities suits different environments, making them functional for urban and rural territories. Rural areas typically find independent power systems to be their most practical power supply solution. Metropolitan areas usually implement grid-connected microgrids (GCMs), which integrate groups of interconnected distributed energy resources (DERs) within residential or commercial buildings. Building Management Systems (BMSs) represent these systems since DER management directly relates to the energy consumption within single buildings or groups of buildings9.
The need for reliable power supply systems in isolated areas is promoting most global microgrid (MG) development. The majority of MG technology applications are concentrated on islanded operation and black-start ability, as well as grid stabilization. The efforts on grid-connected microgrids (GCMs) have moved beyond grid-forming control to resource management because energy management systems (EMS) have taken over this responsibility. The proposed energy scheduling methods are realized through microgrid energy management systems (MG-EMSs), which can make consumers realize the benefits of the BES, particularly in terms of lower energy costs10.
The study conducted examinations under the condition that MG-EMSs function independently, without sharing information about scheduling with the distribution system operator (DSO)11,12. The literature reviewed coordinated energy distribution methods for microgrids connected to electricity grids, with a focus on distribution system operator (DSO) connection protocols13,14. The existing research fails to specify the total cost implications for DSOs when they incorporate MGs into unbundled network operation systems.
A linear mathematical model for non-linear BES performance and degradation continues to present a difficult development challenge. The research simplified the complex optimal microgrid (MG) energy scheduling process through studies on MG energy management, while incorporating battery energy storage (BES) dispatch; however, it typically provided simplified models of BES scheduling. Research tends to ignore the degradation effects just as commonly. Research into understanding BES dispatch relationships with degradation subjects is crucial because it allows additional cost reduction for MG operations8. The key objectives of the research are the following:
-
To design and confirm a GCM energy management model, where Battery Energy Storage is the main flexible supply source. The system is planned to work on a Microgrid Energy Management System platform, which optimizes the BES and other possible microgrid elements to achieve either grid interconnection standards or economic operation objectives.
-
To address the microgrid energy scheduling problem through two solution approaches. The first method is uncoordinated, optimizing microgrid operation independently without considering its impact on network performance and distribution costs. The second is a coordinated method that integrates network operation considerations by accounting for sector-specific roles in overall system coordination.
-
To install the energy management model and market-oriented dispatch strategy to operate the BES in the building-level microgrid (BMG). The aim is to design a model that can accurately estimate building operational cost, considering both the benefits of load shifting and costs of Building Energy System (BES) degradation, which are not usually considered in the traditional energy management system (EMS) studies.
-
To improve the realistic nature of the EMS model by the use of a detailed BES scheduling model that is capable of characterising the operational efficiency and degradation behaviour of the storage system.
The key contributions are as follows:
-
Distribution systems were modeled by AC power transmission techniques, and methods of EMS were developed to control multi-duration resources. The MG operator or the DSO can use such coordinated models.
-
carried out comprehensive research by testing different GCM energy scheduling technologies on the actual university power distribution system. The study examined the network performances according to cost-efficiency metrics and conducted maintenance of the BES assets to determine the anticipated period of its lifetime.
-
There is a market-based BMG-EMS dispatch model available to operate the BES, which enables the builder to manage energy spending in real-time and give periodical cost reporting over months and years. This model was comprised of BES measurement data deterioration, and the influence of DoD on the process performance and aging.
-
Using the proposed BMG-EMS framework, the extensive studies on the real residential buildings that exhibit energy flexibility were used to evaluate the BES dispatch strategies. The paper compared the different technical solutions and BES degradation models to come up with the most suitable model that could optimize residential electricity spending.
-
of BMG-EMS model against on-site BESs in two demonstration locations. The effective assessment determined that the measurement-based model incorporated in an MG-EMS exceeds the typical BES scheduling processes.
-
Table 1A presents a comparative analysis of the proposed BMG-EMS framework against representative studies in the existing literature. As shown, most previous works either neglect battery degradation modeling entirely or include it in a simplified manner. In contrast, the proposed system integrates both cycle-based and depth-of-discharge (DoD)-based degradation effects using empirically validated models, which directly influence dispatch decisions through the optimization cost function.
-
Regarding coordination strategies, many existing studies operate in uncoordinated or partially centralized modes. The proposed model supports both centralized and decentralized coordination schemes with the Distribution System Operator (DSO), enabling flexible energy dispatch and system-level optimization.
-
Furthermore, unlike most prior works that rely purely on theoretical or single-site simulations, the proposed model has been validated across three real-world microgrid sites (Chalmers 33-bus campus grid, HSB LL BMG, and Brf Viva BMG), demonstrating its practical feasibility. It also uniquely incorporates rolling-horizon (RH) optimization with regular updates and Monte Carlo simulations for uncertainty quantification, supported by bootstrapped confidence intervals to ensure statistical robustness.
-
Lastly, the communication and control system—developed using MQTT, MATLAB, and GAMS—demonstrates real-time capability and integration with building-level energy infrastructure, setting it apart from simulation-only frameworks. Overall, this comparison confirms that the proposed BMG-EMS model offers a more comprehensive, flexible, and deployable solution for battery-integrated energy management in microgrids.
Literature review
The optimization approaches applied to microgrid energy management systems encompass a detailed set of strategies, which allow the successful management of energy sources in the localized power systems. The management system combines scheduling processes and intelligent control operations to manage the distributed energy sources, energy storage systems, and loads to provide an efficient and reliable power supply.
Recent developments in microgrid (MG) energy management have increasingly emphasized the integration of intelligent optimization techniques, battery degradation modeling, and coordinated control schemes to enhance system performance and sustainability. Thirumalai et al.15 introduced a cheetah optimization-based smart energy management framework that effectively scheduled appliances and integrated DERs in residential and industrial grids, demonstrating efficiency in peak load management. Complementing this, Nagarajan et al.16 developed an improved Lyrebird optimization method for sectionalizing multi-microgrids and achieving cost-efficient distributed generation scheduling. Safavi et al.17 made significant strides by incorporating battery degradation into the energy management of agricultural microgrids, a critical aspect often overlooked in prior models. Singh et al.18 proposed a greedy rat swarm optimization-based demand response scheme, optimizing both economic and environmental metrics. These techniques, while effective, generally omit the empirical modeling of battery aging, which is addressed in greater detail by Butt and Li19, who incorporated second-life battery utilization and dynamic efficiency modeling into degradation-aware MG planning. Similarly, Paul et al.20 applied quantum particle swarm optimization for grid-connected MGs, targeting cost and emission reduction, while Wang et al.21 presented advanced decentralized power management strategies for distributed energy systems. On the coordination front, Abdelghany et al.22 demonstrated a coordinated multi-timescale MPC approach incorporating hydrogen storage, revealing the benefits of hybrid storage and smooth power delivery. Agajie et al.23 and Kumar et al.24 conducted techno-economic assessments of PV-battery and hybrid systems in educational and rural settings, underlining the economic viability of MG configurations under varied constraints. Wicke and Bocklisch25 offered a hierarchical energy management framework for hybrid battery systems that explicitly accounts for degradation costs, while Singh et al.26 suggested a hybrid demand-side policy for balancing economic and emission goals in MGs. The integration of electric vehicles into microgrids has also advanced, with Sarker et al.27 presenting an AI-driven optimization framework for smart EV charging integrated with PV and BESS in dense residential environments. Rawa et al.28 and Mazidi and Kalantar29 addressed optimal operation and resilience, respectively, by incorporating stochastic scheduling and mobile BESS to enhance grid reliability. Battery aging remains a central concern in long-term MG performance; Zhao and Li30 proposed a neural network-based model for degradation-aware scheduling, achieving higher accuracy in capacity prediction compared to traditional methods. Furthermore, Anitha et al.31 explored hybrid energy sources and power-sharing mechanisms in autonomous MGs, and Abdolrasol et al.32 applied particle swarm optimization enhanced with artificial neural networks for optimal MG scheduling. Finally, Kumar and Karthikeyan33 introduced a multi-objective optimization framework for distributed generation energy management, integrating hybrid renewables and storage.
The literature on microgrid (MG) optimization continues to expand rapidly, encompassing diverse aspects such as energy scheduling, demand response, battery degradation, and grid coordination. Recent works have emphasized the feasibility and potential of integrating vehicle-to-grid (V2G) technologies in rural settings, as demonstrated by Nadimuthu et al.34 in Indian smart villages, while Garip and Ozdemir35 and Vaka and Matam36 focused on optimal PV and BESS sizing to minimize operational costs in grid-connected MGs. Selvaraj et al.37 employed crow search algorithms for real-time power scheduling, improving MG responsiveness and efficiency. Davoudkhani et al.38,39 proposed robust load-frequency control using EV storage and novel meta-heuristics like mountaineering team-based optimization, addressing frequency stability in islanded MGs. Molu et al.40 provided a techno-economic analysis of hybrid solutions in Cameroon, reinforcing the value of tailored local designs. Karthik et al.41 developed a chaotic self-adaptive sine cosine algorithm for multi-objective scheduling, while Rajagopalan et al.42 introduced a crystal structure-inspired map-based optimization for EV-integrated MGs. Singh et al.43 emphasized machine learning-based forecasting and management for systems with diverse DERs, and Dunna et al.44 implemented sliding mode observers for MPPT control in PV/BESS systems, showing promise for real-time applications. Alkanhel et al.45 advanced IoT-driven stability prediction via gradient boosting and dipper throated optimization, whereas Ullah et al.46 highlighted the transformative role of blockchain in decentralized smart grids. Manzoor et al.47 introduced AHHO for demand-side management, showcasing AI’s role in peak shaving. Control strategies were comprehensively reviewed by Kumar et al.48, while Choudhury et al.49 and Sahoo et al.50,51 applied modified water wave and prairie dog algorithms to improve power quality and transient stability in hybrid MGs. Meanwhile, Bhoi et al.52 and Khosravi et al.53 presented optimization frameworks and control architectures enhancing hybrid AC/DC MG resilience and reliability. Abraham et al.54 proposed a fuzzy-based control mechanism for DC microgrids supporting PV-based EV charging stations, showcasing enhanced adaptability to variable loads. The integration of market-based scheduling was explored by Hai et al.55, who presented a stochastic optimization framework that coordinates real-time and day-ahead energy markets in the presence of renewables, addressing forecast uncertainties and price fluctuations. In the context of isolated systems, Kumar et al.56 developed a multi-objective economic emission dispatch model incorporating battery energy storage, highlighting the importance of trade-offs between cost and emissions. Similarly, Prasad et al.57 introduced an ANFIS-PID-controlled hybrid AC–DC microgrid employing Elephant Herding Optimization (EHO), resulting in improved cost-performance through dynamic droop control. Albogamy et al.58 focused on real-time scheduling for renewable-integrated smart grids, enhancing energy use efficiency. Demand-side management, particularly in EV-integrated grids, has also advanced—Mohanty et al.59 surveyed diverse modeling and control strategies, revealing a research gap in scalable DSM solutions. Li et al.60 utilized a modified shuffled frog leaping algorithm (MSFLA) to optimize day-ahead scheduling in microgrids with hybrid electric vehicles, emphasizing control flexibility. From a modeling standpoint, Sharma et al.61 presented sensitivity analyses for grid-connected green microgrids, offering insights into operational resilience. Dashtdar et al.62 and Abdalla et al.63 contributed methods for load voltage control and hybrid storage systems (including cooling and heating integration), both enhancing stability and economic operation. Abbasi et al.64 integrated BESS and EVs in community home EMS frameworks to improve demand response flexibility, while Dashtdar et al.65 advanced smart EMS design for residential microgrids using intelligent control. Panda et al.66 developed a comprehensive DSM framework combining EVs and advanced optimization, bridging the gap between residential user behavior and smart grid coordination. Emerging technologies such as blockchain are also influencing grid management—Singh et al.67,68 proposed blockchain-based frameworks to enhance secure, interoperable demand response, particularly in EV charging networks. Nagarajan et al.69 addressed integrated renewable energy and DSM challenges using an enhanced cheetah-inspired algorithm for dynamic economic dispatch. Comprehensive reviews by Panda et al.70,71 critically analyzed the evolution of DSM, market design, and optimization strategies, underscoring the urgent need for hybrid AI-driven, scalable, and economically viable DSM frameworks. While these works demonstrate rapid innovation across microgrid optimization and control, few incorporate empirical battery degradation modeling or real-time coordination with distribution system operators. The current study extends this body of work by embedding battery health-aware scheduling within a rolling-horizon framework, offering a degradation-mitigating, real-time energy management platform that is not only computationally efficient but also validated across real microgrid testbeds with coordinated grid interaction.
High computer technologies, together with algorithms and software systems, provide an opportunity to achieve success in energy forecasting, a solid resource distribution policy, and a rapid decision-making procedure. The system will provide optimum energy use at minimum costs and environmentally friendly solutions, besides maintaining safe conditions of electrical power supply. An Energy Management System (EMS) is the key to successful deployment of energy management systems at microgrids. EMS is a management system implemented in software that integrates multiple operational capabilities, control strategies, and decision algorithms to monitor, control and maximize the performance of microgrid resources72. An EMS exists primarily to maintain dependable power delivery through efficient resource utilization of available energy supplies. The real-time survey of microgrid energy generation, storage, and consumption enables operators to make decisions to maintain a balanced supply and demand flow73. An EMS performs load forecasting as an essential operation by predicting forthcoming electrical needs across the microgrid. Accurately predicting load requirements helps EMS systems plan resources optimally13. A key operational requirement involves energy scheduling, through which distributed energy resources can be integrated successfully with energy storage systems and loads for optimal operation. An EMS achieves optimal energy utilization by evaluating energy costs, environmental considerations, and grid constraints1. DR is an essential mechanism that allows operators to manage customer adjustments in power use based on pricing signals, network measurements, and external occurrences. This method enhances system flexibility, hence improving grid stability and maintaining overall system dependability74.
An EMS provides a smooth path to connect with the primary power network, enabling safe energy transfer while meeting all regulatory demands3. Implementing an EMS relies on sophisticated technology components, including network systems and control frameworks, which collect real-time information to perform advanced computational evaluations and make informed operational decisions. The system utilizes optimization models, machine learning, and data analytics to efficiently enhance system performance and dispatch energy, thereby reducing operational fees4.
The two modes of operation of microgrids (MGs) allow for smooth transitions between grid-connected and island operation, improving power dependability for their customers. In linked grid mode, MGs broadcast the variations in electricity supply and demand over the main power grid. MGs use their energy sources to operate independently when in island mode. Energy surplus may be stored when distributed power sources, movable loads, and storage areas are combined. While preserving operational effectiveness and cost-effective performance, equitable microgrid management via controllers provides security and dependability. Supply-demand management is handled by the MG-EMS component of the MG controller using MG resources and interconnects74. The system provides software applications to operate electricity networks efficiently through distribution service management, ensuring a reliable and cost-effective power supply9. The MG-EMS enables communication between MG internal components and external power grids, as directed by the MG operator’s strategic directions and operational goals3. When the MG connects to the main grid through the PCC, the MG-EMS determines power transfer levels, which in turn influence voltage characteristics and the utilization of distribution networks.
Power transfer management at PCCs facilitates coordinated operations across several GCMs and the distribution network, fulfilling grid needs and enhancing performance while allowing for supplementary services. Establishing a control and communication link between the MG and DMS facilitates synchronized data transmission about scheduling information, PCC voltage, and flexibility parameters. Research has investigated the optimal energy scheduling of microgrids (OES-MGs) using autonomous microgrid energy management systems (MG-EMS) operations that exclude considerations of microgrid main grid connection techniques75.
Operation cost reduction for MGs relies on achieving stored energy and implementing demand response programs, as well as generator control mechanisms. A comprehensive optimization approach study for MG-EMS is provided in7. The upcoming requirements for distribution grid management by Distribution System Operators (DSOs) demand proper interconnection and control procedures for Microgrids (MGs) tied to the grid. A new investigation studies integrated energy management, which addresses interactions between MG-EMS and DSO76,77,78,79,80. To determine participation with the primary network, scheduling MG energy requires exchanging information between entities, including MG owners, DSO operators, and MG aggregators. The DSO is hierarchical and superior to the MG operators during their working relationship.
Current studies on the coordinated energy management of GCMs implement deterministic and stochastic bi-level optimization approaches81. All network groups within affiliated entities channel their energy flow through the DSO, which operates as a central administrator. Studies of this nature frequently operate under the assumption that the Distribution System Operator (DSO) has comprehensive knowledge of Microgrid (MG) factors. This assumption is critical when reformulating the problem into a one-level mathematical analysis utilizing the Mathematical Programming with Complementarity Constraints (MPCC) approach73. The privacy of MG data contradicts the necessity to have full access to MG information75.
The DMS requires only tie-line switch status information from the MG network, as per82 Standards. Privacy-preserving, decentralized approaches are now available in the market. Reference79 Proposes a decentralized solution that addresses a problem previously solved by centralizing techniques78. The paper evaluates multi-timeframe energy scheduling operations that include inter-time constraints and MG power interchanges. The DSO provides the initial energy exchange schedule, which receives iterative updates based on received information until optimization is achieved. The DMS system requires PCC measurements, and it needs to know the worst-case operational expenses of each MG to achieve maximum privacy for MG operations. BES scheduling incorporates storage elements into power systems because the power sector requires dispatchable renewable energy sources, which are becoming increasingly important. ESS transforms into grid-supportive tools by delivering peak shaving services, load leveling operations, and frequency regulation features to minimize the effects of renewable energy (RES) power fluctuations82.
ESS scheduling research exists for microgrids (MGs) based on findings presented in10, as well as battery management systems (BMGs) described9. Reference83,84 fails to address battery degradation issues, although other studies evaluate cycle aging effects independently from calendar aging factors. Simplified models of ESS scheduling appear in numerous works; however, they often diminish the reliability of their solutions. The optimal BES dispatch models do not consider BES efficiency levels nor evaluate degradation effects. The efficiency and capacity of BES systems decrease continuously throughout their lifespan due to normal use, material deterioration, and natural environmental factors85,86. Penalties found in objective functions help minimize BES stress resulting from deep cycles and high-power rates87,88.
Research based on Mixed-integer linear programming (MILP) evaluates chronological and cycle aging conditions, whereas other studies disregard calendar aging89. Among the factors considered are time duration and aggregate flow consequences. The aging process of BES manifests as a decrease in operational capability and an increase in resistance within the system. Studies establish a direct relationship between the percentage of capacity loss and degradation cost, while reconciling BES dispatch between revenue and cost to optimize performance. The degradation cost assessment techniques presented in90 Yield accurate results; however, they do not reveal the actual effects of age on BES capacity or resistance.
The products of the Samsung SDI and the Tesla Powerwall are contained in the residential stationary BES market, which provides warranties restricting their system operation through specified throughput or cycle usage terms. The degree of capacity retention at the end of a BES’s lifespan fluctuates between 65% and 80%, due to both geographical factors and the linkage with the PV system. The study requires more comprehensive research to understand the benefits of residential BES for load-shifting controls, particularly regarding aging degradation effects. The degradation model requires the inclusion of fundamental aging factors that occur during battery system usage, while also considering both anticipated BES replacement times and anticipated replacement costs.
Suppliers of MG-EMS technology connect to utility SCADA systems, which are provided by ABB, Siemens, and General Electric, among others. With technology, it is possible to have both DSO compatibility and MG implementation. The implementation of MG enables end-users to access affordable energy costs and lower distribution system operational expenses. Integration with MG presents various obstacles, as operators face restricted control over integration procedures and issues related to communication networks, standards, the grid, and critical infrastructure security, as well as data protection. When regulatory restrictions on energy storage ownership rights are eased, it creates potential interest among DSOs in GCMs. The research analyzes the effects of MG integration and develops an estimation model to determine the possible costs that MG services present to an unbundled network operation.
Methodology
The following is the methodology of the MG energy scheduling issues, the problem structure, the coordination schemes through DMS interface, a simulation study on the solution approach of the problem, and a market-based energy management approach that considers BES in a BMG.
System model
The daily adjustments to BES capacity utilized information derived from cycle and calendar ageing. Through the cycle aging model, the system maintained its capacity levels by using throughput or DOD information to reduce initial values. During open-circuit times of the scheduling period, the remaining capacity was deducted from the estimated calendar ageing loss. Researchers employed rolling-horizon technology to test the scheduling models. During each time increment (∆t), the optimization problem is solved by sending out the initial set point after the time simulation has been completed. A forward advancement marked the start of the subsequent simulation. The following section presents optimization models that handle energy scheduling operations in connected MGs, examining the interplay between DMS and MG-EMS. The article presents the optimization models of energy scheduling that incorporates MG-EMS functionality and DMS performance study in GCMs. The provided report defines the suggested optimization problems and solution methods regarding distinct models with individual structures.
The operation of MG requires dual objective functions because they account for economic savings through cost minimization, maximize profit, and manage energy transmission despite the number of external units involved. The mathematical expression of the cost minimization objective function appears below in Eq. (1) :
The transformed objective entails a cost minimization approach in every microgrid in a distributed energy system. Its purpose is to minimize the system wide operating costs by equalizing energy imports, exports, and internal generation plus penalties. The cost of importing electricity as calculated in the first part of the equation involves the cost incurred in importing electricity in the main grid where the total cost is given by the sum of the spot market price and the transmission costs, times the imported power and the time period. The second element is the revenue generated by exporting the surplus energy back to the grid; this will be deducted off the total cost as it will be income. The same is done to calculate this export value, where the spot price is taken into consideration, and any returns or export costs are taken into consideration. The equation also contains the cost of operating the distributed energy resources (DERs) solar panels, wind turbines, or battery systems, in addition to the import and export cost. These DER costs capture internal generation costs that are microgrid specific. Finally, a penalty term is also included to reflect regulatory costs or outcomes of violation of operations, i.e., exceeding load limits or reliability targets. Collectively, this role can guarantee that every microgrid can optimize its net cost, and effectively balance energy flows and reliability of the system in the greater grid context.The variable (:r_i^p)​Defines peak power acquisition costs from the main grid, subject to specific conditions as outlined in Eq. (2).
The power-based grid rate for maximum average power across Δt is expressed through (:C^p) Within the formula. This section describes the objective function that seeks minimum energy exchange by Eq. (3):
When reducing energy exchange between MGs and distribution networks, operators gain enhanced flexibility while enabling better prospects for operating independently of the grid. Resource capacity, technical constraints, scheduling horizon, and selected solution method determine how autonomous the system can be and affects its overall efficiency for achieving self-consumption goals. The active power balance of the MG, along with its reactive power functionality, is maintained by Eqs. (4), (5).
Constraint (4) establishes a balance of active power for each I in MG and it in H through N, encompassing all MG and PCC buses. The mathematical model includes all three active power generation processes, as well as the charging and discharging processes for distributed battery energy storage systems, variations in demand response resources (both reductions and increases), and the generation from photovoltaic sources alongside load requirements. The balance of reactive power is governed by constraint (5), ensuring a consistent power factor across all generation and load components, which encompasses the CHP plant, DRR elements, and the demand for reactive power. The combined heat and power plant generates electrical energy alongside thermal energy, emphasizing its role in delivering heat efficiently. While the plant’s ability to generate electrical output is limited during heat production, operators ensure effective power management.
This relationship operates during heating power generation activities, where both the minimum electrical power output((:P_j^G,min)) and the heating output ((:P_j,t^H)) are utilized as parameters. The load flexibility model operates similarly to an energy storage system, governed by its constraints on the capacity allocated for demand response.
(:e_j,t^DR) Indicates the power reduction value from DRRs at time t, as specified in the provided mathematical expressions. The below presents two scheduling methods of BES which can be utilized in optimization problems. The measurements-based model gives accurate data on the performances of BES, yet the traditional model is common in the scholarly literature. Experimental results of BES systems continue to employ SOC, thus the proposed model employs SOE. The defines DOD as the quantity of energy which discharges 100% SOC. The currently widely applied BES model forms linear relationships between cumulative throughput and BES SOE. The charging and discharging efficiency of energy and the power limitation is the same at any level of SOE. The mathematical expression below depicts the model. The model consumes more power than what is required because of its simple battery functions. All of this is made possible through a sampling approach that studies the charge/discharge patterns, allowing developers to build a better model that reflects well on the realistic operation of BES in practice.
The system calculates the SoE for the BES using this mathematical expression in every period. Different elements that affect degradation can reduce capacity and increase resistance in the device, as noted in91 Two separate degradation processes operate while the BES is either active or inactive. increased C-rates, coupled with frequent cycling at depth of discharge (DOD), high temperatures, and prolonged resting at increased states of charge (SOC), serve as primary degradation causes92. The residential BES degradation models operate under the assumption of maintaining constant temperature values.
Equation (9) specifies (:Q_k^i) The empirical fitting of experimental data is employed to determine the pre-exponential and exponential elements, B1 and B2, respectively, representing the cycle-based BES capacity loss in (%). The expense associated with battery degradation, (:c_k^B), is calculated in the following manner:
The cost of battery degradation can be factored in the cost cutting objective, when taken into account. The cost of deterioration of cycling operations can be calculated using the approach in using cycle-specific maximum depth of discharge values. Battery degradation costs, as one of the significant ones, must be added to the optimization functional. The percentage loss per cycle at a given DOD value is calculated using a function, which adds CBBD cost into the objective function93.
To convert the modeled battery capacity loss into an estimated operational lifespan, we first define the end-of-life (EoL) criterion as the point where the usable capacity falls to 80% of the nominal value, in line with common Li-ion battery warranties and prior studies90,93. The annual capacity degradation rate is determined from the degradation model outputs (Eqs. 9–11), which incorporate both cycle aging and depth-of-discharge (DoD) effects. Assuming the degradation rate remains approximately constant over the operating period, the lifespan is estimated as:
For cases where degradation is non-linear, such as when cycling patterns vary significantly, the total number of equivalent full cycles per year is computed using a rain flow counting algorithm, and the manufacturer’s cycle-life curve (adjusted for DoD) is used to project lifespan. This approach ensures that the scheduling strategies are evaluated not only in terms of cost and performance, but also in terms of their impact on long-term battery sustainability. The relationship between lifespan deterioration and DOD is illustrated in Fig. 1, which utilizes data from a Li-ion BES90. According to the equation, increasing the DOD value leads to a reduction in the lifespan of BES. A linear model that examines the effects of time enables the prediction of BES capacity deterioration through calendar aging .
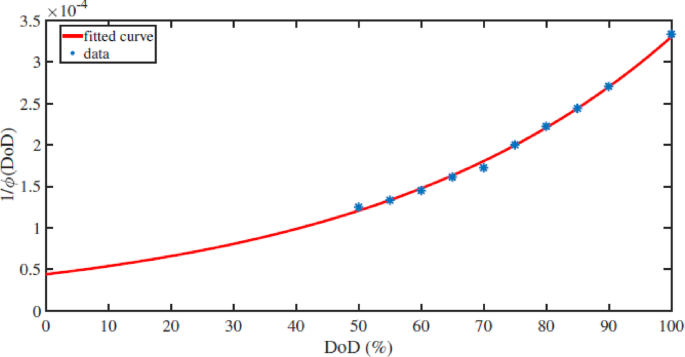
Lifespan lose at DOD.
The DSO uses an optimization model as its main operational method. DER ownership and management are typically prohibited for DSOs by most standards. DERs located inside microgrids become dispatchable units when DSO gain complete visibility and control over the constraints of these microgrids. The DMS must coordinate completely with MG-EMS to ensure the successful operation of this setup. Energy control management across multiple microgrids forms an AC OPF problem that allows the DSO to achieve network objectives and technical limits. The DSO achieves operational cost efficiency through cost-minimized grid connections and flexible services, enabling balance requirements. The DSO will achieve economic efficiency by reducing expenses generated from the TSO infrastructure, including energy transaction expenses and peak demand charge expenses.
DSO operates under this mathematical description of the optimization problem:
The required balancing power (:P_req) is associated with the active power transfer (:P_i^MG) Which is a variable in the DSO optimization problem. Where 0 < 500 < 2,018 p, i is the flexibility target that the DSO imposes on the MGs in their optimization problem. The AC OPF model has a framework where the primary distribution network power flow is present. The power flow equations of the distribution networks considering the AC framework have the following form:
To solve the optimization issues, the optimization problems were coded in GAMS using CPLEX optimizer to solve the optimization issues raised by the solution techniques and the type of entities involved in the energy scheduling problem. The results processing and data management were feasible through an interface that linked GAMS and MATLAB. This part of the paper gives an understanding of microgrid (MG) energy scheduling strategies, which mainly focuses on various operational objectives and dispatch strategies. The profit maximization issues subject to the minimization of energy exchange can be solved through two optimization formulations such as MILP and AC OPF. The GAMS and CPLEX based optimization techniques provide coordinated and uncoordinated solutions of scheduling. The further information concerning this theme is contained in the next chapter. In the described coordination approach, the MG-EMS operates with the system using prior equations. Optimization problem is formulated as Mixed-Integer Quadratically Constrained Programming problem. Based on the cost function and scheduling approachology chosen by the BES management, four optimization models were developed.
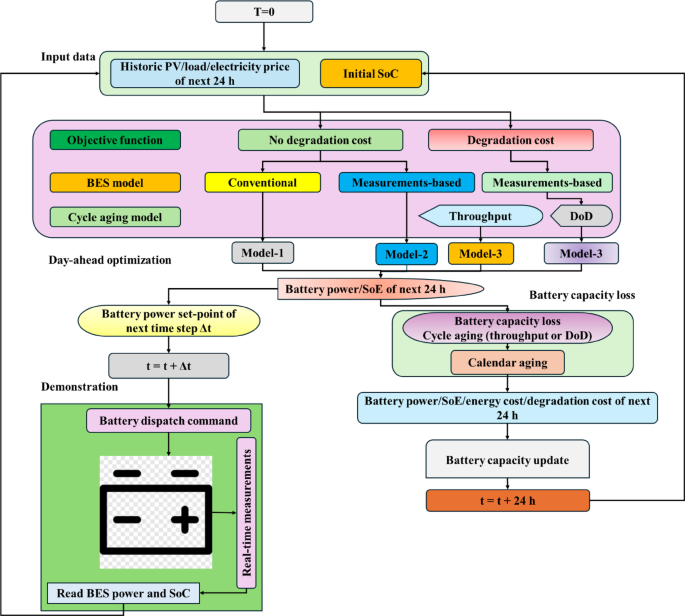
In the optimization frame proposed, four different models of battery energy storage (BES) scheduling are used, each based on various assumptions about battery degradation. Model-1 is a baseline model and does not consider the cost of degradation at all by dropping the term (:c_k^B)​ of the distributed energy resource cost (:c_i^DER)​as modified in the objective function. The model is only based on the, standard BES scheduling formulation, and is characterized by the set of core Eqs. (1), (2), and (4), which form a mixed-integer linear programming (MILP) problem. Model-2 improves on this further by using an empirically validated measurement-based BES model, though, similarly to Model-1, it does not consider the effect of battery ageing. Model-3 is more realistic in that there is a cycle ageing model which takes into consideration the energy throughput and this is incorporated directly into the measurement-based scheduling strategy to degrade according to a pattern of usage. Finally, Model-4 extends the degradation modelling further and connects a cycle ageing model, depending on depth-of-discharge (DOD), to the measurement-based framework, to account for the influence of different discharge depths on battery ageing. These four models offer different levels of accurateness and complexity and they could be incorporated in the Battery Management Grid Energy Management System (BMG-EMS) to be tested, evaluated, and demonstrated.
The mathematical expression of γ in this context illustrates a relationship between ∆pMG1 and ∆pMG2. When MGs submitted their forthcoming time step forecasts, the DMS utilized a PCC active electrical exchange (PMG) values to address its optimization needs. Through the implementation of adjustable power exchanges ∆pMG1 and ∆pMG2, the team was able to reduce the deviation of the BRP from the imbalance signal.
Table 4 outlines the key features of the case study. The study performed a sensitivity analysis based on probable BES installation cost variations, ranging from $100 to $290 and $500 per kWh, to reflect different future price forecasts. The study considered two SoE limit scenarios: Scenario 1 used a 30% to 80% range, and Scenario 2 operated within a 10% to 90% range. The simulated system operated between 50% SoE at start and end, with η = 80.
BES achieved ηch = 0.91 when charging and ηdch = 0.98 while discharging. The measurement-based model parameters utilized experimental data derived from HSB LL BES testing in April 2022 to obtain Model-1, which represents the tested average metrics. The charging and discharging efficiencies of Models 2, 3, and 4 varied according to the Battery State-of-Energy and power rate, as determined using a measurement-based method. Reference94 served as the source for the Model-3 lithium-ion cycling characteristics.
Basics of energy scheduling
Figure 2 illustrates the basic model that characterizes the MG energy scheduling problem. The timeframe of an energy management schedule is determined based on the prediction data concerning loads consumption and non-dispatchable generation, and information about electricity pricing. The time horizon of the same ranges between one hour and one month. Periods of time calculated as a result of a division of the scheduling period are related to the frequency, with which the set points are updated, as well as define the data resolution. The interphase period is calculated taking into consideration the load profiles and the generation profiles and their varying and uncertain nature. Real-time energy management period normally stretches to a maximum of five minutes79.
Energy scheduling problem configuration.
RH approach, as illustrated in Fig. 3, enables real-time or near real-time energy management. At each time step, the energy scheduling method determines set points through simulation processes. Using the methodology, the simulation time frame adjusts between sequential operations. The RH technique enables dynamic changes to the set-point, reducing uncertainties associated with demand predictions, network state estimations, and local generation forecasts DERs.
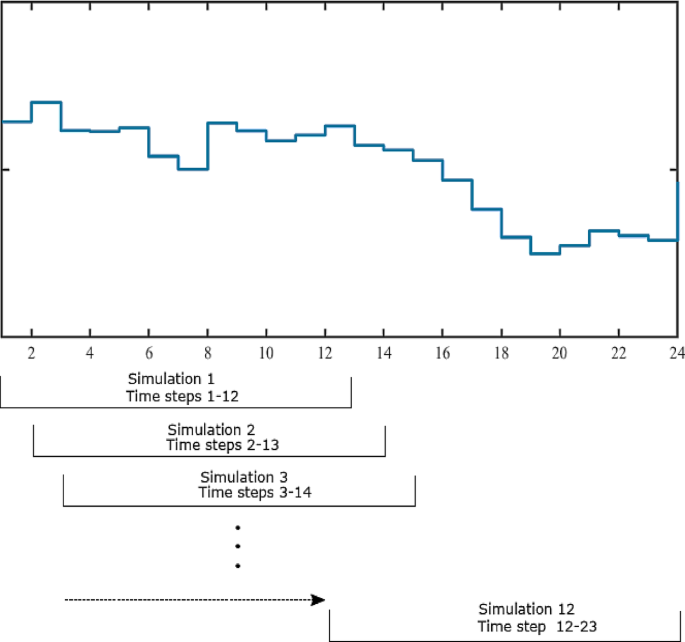
Rolling-horizon technique.
The set points of the reference (the solution of MG energy scheduling problem) are communicated to MG resources, i.e., generators, BESs, and loads, via communication channels. Operation requirements demand that the MG operator, who offers power delivery services to consumers and owns all DERs of the microgrid, should solve energy scheduling issues. MG-EMS is an interface of communication, which interrelates with the DMS to disseminate MG information across the network. Figure 4 presents an example of MG and distribution system integrated design illustration. The chart shows the communication channels of the two-way communication between the MG-EMS system and the DMS. Each MG-EMS system communicates only with the DMS since MG-EMS systems are independently operated. Also, Fig. 4 shows the three coordination mechanisms between the MG-EMS and the DMS. There are two forms of coordination between grid-connected microgrids and the Distribution System Operator, where the microgrids can act together following the same strategies or have individual contracts.
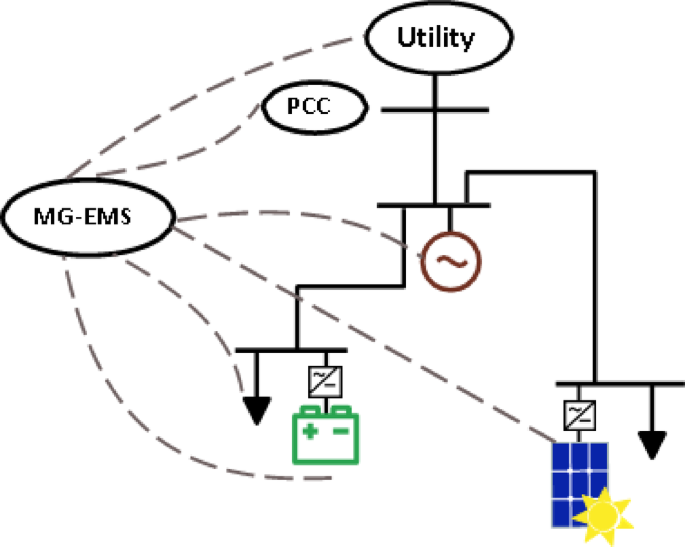
MG-EMS communication.
Figure 5 illustrates the interface and coordination schemes between the DMS and multiple MG-EMSs in a networked system including Microgrids 1, 2 and 3. The diagram indicates three categories of coordination strategies, namely no coordination, centralized coordination and decentralized coordination. In a centralized coordination, the DMS controls MG-EMSs in a direct way through control commands issued according to global system objectives. Decentralized coordination is two-way communication, where the microgrids can optimize locally, but in a way that is consistent with the needs of the whole grid. Lack of coordination infers a complete independence of the microgrid operation and this can be a constraint towards system level optimization. The relevance of coordination modeling where reliability of the grid is concerned, improving flexibility, and enabling the efficient integration of distributed renewable energy and battery systems, in interconnected microgrids.
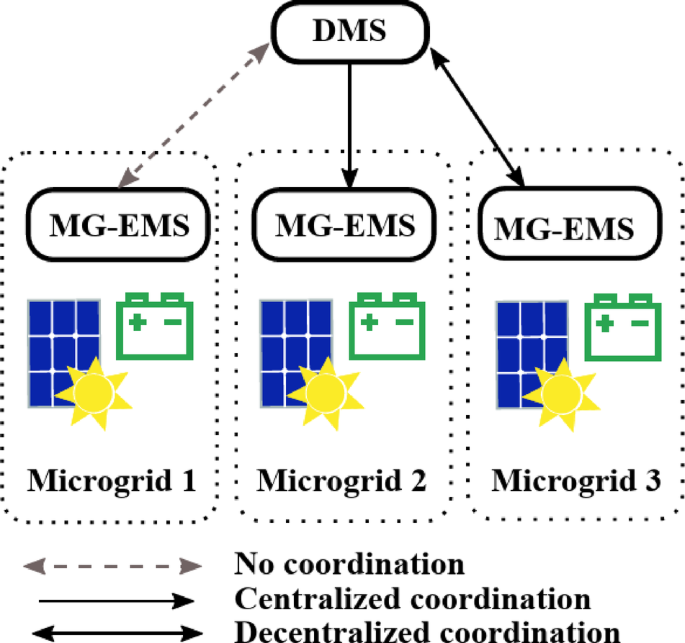
DMS interface with MG-EMSs.
The MG energy scheduling problem solutions derive from different coordination strategies, including independent decision-making by the MG-EMS without DMS intervention and coordination. Under centralized coordination, the DMS assigns MG resources to the MG-EMS platform, which acts as a receiver at the end of set points. Decentralized coordination occurs when DMS provides power control center reference values, which entities use to create an alliance of scheduling plans that satisfy both DSO and MG operators. The MG resources then process the executed set points.
The next section discusses how to schedule in a decentralized and centralized form of coordination. The scheduling processes determine energy balance and meet operational limits in the MG, as well as seek to optimize distributed energy resource plans. In uncoordinated strategies, every MG operator plans their DERs, such as BESs, DRRs, PV systems, and CHP plants, in accordance with the set objectives of the MG-EMS. A central figure in this scheme is the DSO, who transmits orders to the MG resources to meet operational targets, which should embrace all MGs. Table 2 compiles the energy scheduling strategies of a two-connected MG distribution network. Strategy 0 in the BAU case uses conventional load-following BES dispatch regulations that are in use in the current system. The problem of local optimum in multi-generation system is solved by using the uncoordinated energy scheduling method that incorporates various MG objectives in S1-S3. It becomes globally optimized with the implementation of S4 that employs centralized scheduling. The four strategies succeed in dealing with distinct day-ahead scheduling problems within the network. The paper gives an extensive description of optimization problems in the case of decentralized approach and in the case of centralized approach.
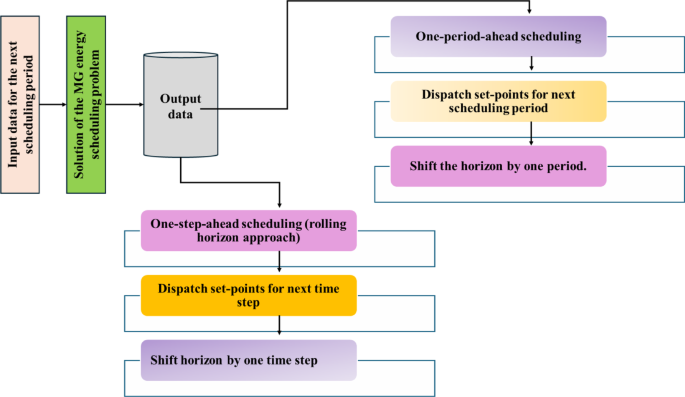
The energy scheduling approach is represented through the diagram depicted in Fig. 5. The scheduling process utilizes end-of-day resource information to create hourly daily resource instructions. All methods use identical input data apart from the remaining input information. Operational set points applied during the problem-solving process yield solutions among the strategies investigated.
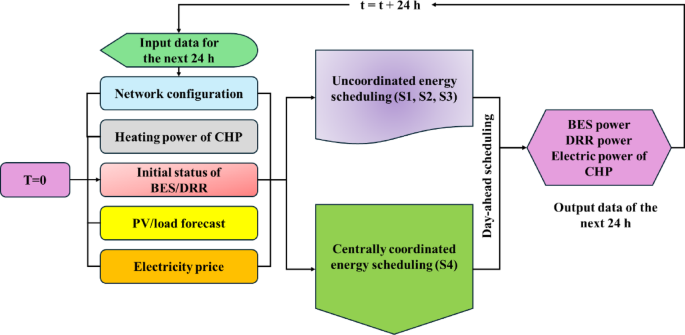
Flow chart for energy scheduling.
A distributed optimization system handles energy optimization functions in grid GCMs. Power exchange must meet al.l needs of PCC-connected entities through the simultaneous operation of MG-EMSs with the DMS. The MGs require technical issue solutions by performing energy management schedule updates based on the data provided by DSO. Interface of the DMS system enables the DSO to exert distant control over MGs through power adjustment and resource scheduling, thereby meeting the distribution system’s needs. The decentralized system enables the distribution of MG flexibility, thus delivering balancing services for transmission systems. The power adjustment capability at the Point of Common Connection qualifies MGs as flexibility assets. Distribution network constraints need compliance, which requires the BRP and their partnership with the DSO. The DSO serves two main functions: managing flexibility operations and preserving network security. According to other research findings, the DSO may face financial responsibility for balancing the system95 when it invests in energy storage systems alongside improved distribution network infrastructure. Under this decentralized coordination mechanism, the Distribution Management System lacks information about specifics in the Microgrid network96. The communication between MG-EMSs and the DMS does not involve the locations of DER, technical constraints, and operational objectives. The only information that is sent to DMS is the necessary PCC values from the control loop. The three scenarios of scheduling energy are as follows:
In Case 1, MGs provide the DMS with schedules of an upcoming hour, and the DMS makes sure that these schedules are operationally feasible. In its operation, the DMS carries out the calculation of PCC voltage as it checks the feasibility once it receives the active and reactive power exchange schedules provided by the MG-EMSs. MGs get their solution based on the expected PCC voltage profile. MGs will put their narrow solution on hold until they develop new versions that conform to the identified PCC requirements. Case 2 entails MGs utilizing RH approach to re-schedule their energy profiles by gradually changing the time horizon prior to the start of every simulation. The system incorporates refreshed load and PV generation forecasts, power price data based on the present hour. The MG-EMSs calculate optimal set points once they get information of the DMS, and thus they can operate within network voltage limits. These adjustments that are time-sensitive require an improved communication procedure amongst the electrical power devices that operate during the hour. Case 3 uses the bi-level optimization of problem to divide MG energy scheduling into upper and lower optimization layers. The distributed management system monitors the primary optimization problem where MG-EMSs run their rolling-horizon capability to optimize the scheduling problems at the low energy level. The structured bi-level problem with two parts facilitates the interchange of parameters between the entities wherein the optimization tasks could modify the system parameters. Each of the entities involved performs calculations of AC optimal power flow, where various objectives and constraints are taken into account.
The Distribution System Operator expects to operationalize MG flexibility in the short-term balancing of power in hourly timescales based on the capacity limits of the distribution network. At the trinification of every time interval, the DMS alters its power exchange upon receiving fresh imbalance signals and schedules of MG units. The provided data is used by the DSO to calculate the flexibility amounts and subsequently submit requests to MG-EMSs. The coordination process is terminated when the MGs have managed to execute the requests according to their schedule timeline. In case MGs cannot deliver the flexibility as per the requested flexibility requirements, the DMS makes successive requests until the required flexibility is provided or depleted. Figure 6 illustrates the figures of the Case-3 solution process. The system allows MG-EMSs to demand delivery of variable power quantities and subsequent verification of their ability to provide the demanded energy at the PCC. Any request of flexible services that cannot be satisfied by dispatchable resources is denied service and a new request with the most feasible flexibility is made.

Methodology flowchart.
The proposed BMG energy management framework facilitates the operation of Battery Energy Storage as a flexible market resource through the implementation of a market-based energy management system within the BMG. The BMG-EMS conducts BES operations by utilizing forecasts of electricity prices, projected photovoltaic production, and data on building power consumption. The BMG-EMS system enables the building owner, BES owner, and BMG operator to optimize BES transport during economically viable operations without the need for DSO involvement. The energy management strategy of the BMG underpins Fig. 7, illustrating the simulation process employed by the researchers. The four energy management models vary in their integration of cycle-based deterioration and practical performance factors. A standard BES scheduling model underpins microgrid energy management in Model 1; conversely, Model 2 attains operational performance quality via a measurement-based scheduling model. Models 3 and 4 integrate cycle-based degradation analysis with measurement-based scheduling and various cycle aging methodologies to assess degradation costs. The four models facilitate the evaluation of degradation rates and BES utilization in conjunction with the operational costs of the biodiesel microgrid system. Figure 8 presents comprehensive formulations of optimization problems within the BES power control framework. While this study assumes perfect forecasts for the optimization model, we recognize that such assumptions are often unrealistic in practical applications. In real-world energy management systems, forecast errors are inevitable due to uncertainties in renewable energy generation, load demand, and market conditions. To address these issues, future work can incorporate robust optimization or stochastic programming techniques, which can consider forecast deviations and optimizing the model’s performance under uncertain conditions. Additionally, rolling-horizon optimization can be employed to iteratively update forecasts and adjust scheduling decisions in real-time, improving the model’s robustness and practical applicability.
Results
To address uncertainty in the proposed energy management system, uncertainty quantification is incorporated using Monte Carlo simulations. These simulations account for the variability in key model parameters, such as battery degradation rates, renewable energy generation such as solar and wind, electricity prices, and load forecasts. Each uncertain parameter is modeled with appropriate probability distributions, and multiple simulation scenarios are run to assess their impact on the overall system performance. Additionally, to quantify the reliability of the results, confidence intervals are calculated for key metrics, including energy costs, battery degradation, and system efficiency. This is achieved through bootstrapping techniques, which generate empirical confidence intervals at a 95% confidence level by resampling the simulation results. Furthermore, a sensitivity analysis is performed to investigate how variations in critical parameters, such as battery degradation rates, charging/discharging efficiencies, and energy pricing, affect the system’s performance. By systematically varying each parameter within realistic bounds, the analysis provides insights into the robustness of the scheduling decisions and identifies which parameters most influence the results.
Test case description: parameters and assumptions
The MG energy scheduling research contains the information related to the test scenarios, system descriptions, and specific examples of the MG-EMS settings. In each of the simulated cases, the peak power cost in Eq. (1) was adjusted specially to suit the time span of the simulation period as this billing charge was initiated by the utility distribution system operator. We then denoted all monetary values into SEK currency considering the average USD to SEK exchange rate in 2018 was 8.6921. Table 3 shows energy and power consumption rate during the simulation time.
BMG architecture.
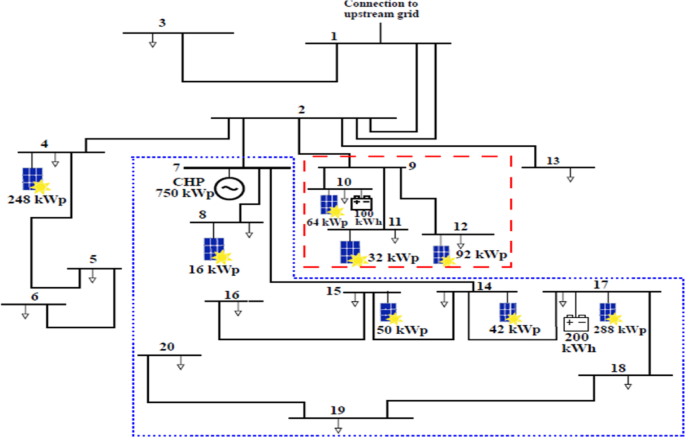
This paper discusses the cost model and efficiency of a microgrid (MG) system under different strategic goals. The study focuses on two important objectives, which are evaluating MG operations performance and analyzing its effect on the primary distribution network. It analyses the ways to reduce the energy costs in the MG as well as does consider the energy interchange with the main grid, optimizing the power purchase, and minimizing the connection-related costs of the distribution system operator (DSO).Centralized and decentralized approaches to energy scheduling with systems that have combined heat and power (CHP) units were compared. The distribution network under study consists of 35 plug-in electric vehicle (PEV) charging points, two battery energy storage systems (BESs) with a capacity of 200 kWh and 100 kWh, and two charging points with the output of 32.0 A/22.0 kW and 16.0 A/ 3.7332 kW, respectively. Moreover, the system also features ABB Micro SCADA systems and smart metering infrastructure (AMI) smart meters placed in the buildings. This system is separated into two operating areas, MG-A and MG-B. MG-A includes CHP, photovoltaic (PV) generation, battery storage, and demand response resources (DRR), which provides this system not only with the possibility to satisfy its own demand but even exceed this energy. During CHP operation in MG-A, about 23% of PV affects its peak load. Conversely, MG-B is not a large generator of electricity (it mainly depends on the main grid to supply its electricity needs; with the PV installations providing just 5% of its total demand).The scheduling data for the MG were obtained from actual measurements taken on the Chalmers campus during MG modeling. The necessary parameters included resource capacities, as well as network structure and configuration settings. The study received input data from historical records of 2022, which included information about weather conditions, solar irradiance, and power usage statistics. Power flow studies utilized electricity consumption information collected by power companies from smart meters across all buildings. The authors in97 described the calculation process for PV generation. The market determined electricity prices for power trading activities between MGs and retail providers at wholesale levels. The MG energy scheduling challenge was resolved by using historical data-based “perfect projections� to optimize energy management practices, as shown in Fig. 9.
Distribution network’s configuration.
Table 4 displays the particular features of the CHP plant, the combustion process of which is accompanied by the constant electrical output efficiency. The CHP plant has a fixed power factor of 0.96 at which it can produce electrical output efficiently and the flexible and inflexible loads use energy at a constant lagging power factor of 0.98. Also, the parameter k and k = 0.5 and ((:r^CHP=0.25)). ). The demand response capability in each time interval is 20% of the load consumption at each bus location, expressed as as (:k=0.5:and:k^DR=0.5)The State of Energy works between 20% and 90% and BES charging and discharging efficiencies (etch, etdis) are equal to 0.95 levels, which have been verified by other literature13.
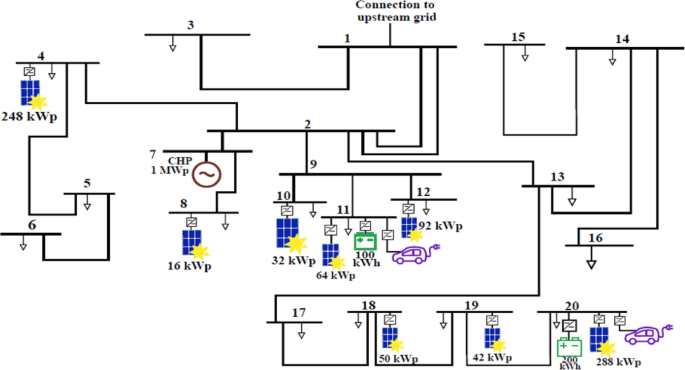
The examination of the 33-bus distribution network depicted in Fig. 10 serves as a case study illustrating the benefits of autonomously collaboration between the Distribution System Operator (DSO) and the Microgrid Energy Management System (MG-EMS) in enhancing microgrid energy management efficiency. The system demonstrates its capacity to handle short-notice operations during MG-EMS coordinated energy scheduling in Case 1 when activation occurs within one hour. The second case illustrates synchronized energy scheduling between MG-EMSs by implementing RH methods to achieve improved temporal performance results. The system demonstrates its mastery in handling intricate energy requirements through Case 3, which uses RH methods and flexibility dispatch techniques for multi-MG-EMS schedule coordination. The research presents a comprehensive analysis of these situations, exploring both findings from the case study and the insights gained.
Distribution network’s configuration and the arrangement of the connections between the two MGs.
The analysis focuses on a 12.6-kV, 33-bus distribution network, where energy scheduling is conducted using a decentralized coordination framework involving the Distribution Management System (DMS) and the Microgrid Energy Management Systems (MG-EMSs)98. The configuration of the network along with the microgrid layout is illustrated in Fig. 11. Energy storage systems with a total capacity of 1.2 MWh are located at buses 14 and 29. Additionally, controllable loads rated at 200 kW are installed at buses 13 and 31, while photovoltaic (PV) generation units of 1000 kW are integrated at buses 18 and 33. Specifically, the responsive load power values are given as (:P_13,t^l,R=0.2P_31,t^l,R=200textktextW)98.
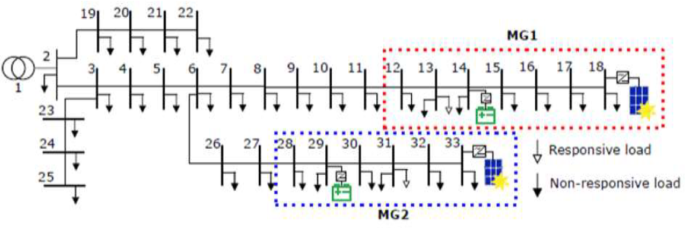
MG configuration layout at 33-bus distribution network.
Table 5 defines the parameters used in the case study. An MG energy scheduling solution generated 5-minute set-points that specified BES charging and discharging power, as well as DRRs power curtailment and increase, in one hour divided into 5-minute time steps. Case 1 only required one simulation, but Case 2 used the receding horizon methodology, which required twelve simulations to determine the set points. The MG-EMS operated with the data received as input, and this included load, photovoltaic generation, electricity pricing, and the initial state of distributed energy resources. More details of the simulation circumstances are available, including load profiles, photovoltaic power production, and power pricing. Both BES units entered operation at 70% State of Emergency, because the Demand Response Resources were not expected to provide any benefits in terms of load reduction. The purposeful role of the objective functions of all of the Multi-Generational EMS and DMS optimization models was to combine grid energy charges and sales revenues, omitting DER operating costs and peak power surcharges. γ was added to address control problems created by the difference between flexibility demands of MG1 and MG2 when the DSO optimized the objective function. Li-ion BES data of Model-4 was used to enable the BES lifecycle loss function to be generated90. This parameter got a value of 0.3, and it could be applied to any charging or discharging pattern in the four models in the 365-day-ahead simulation framework shown in Fig. 1290.
Figure 12 illustrates the schematic power flow architecture of a building-level MG, showcasing the dynamic interactions between local energy components. The building load (:P_t^L) is supplied by a combination of PV generation (:P_t^PV), BES operations charging (:P_t^ch) and discharging (:P_t^dis), and grid interaction via import (:P_t^im) and export (:P_t^ex). The diagram highlights the bidirectional power exchange with the AC grid, allowing both energy imports to meet local demand and export of excess generation. The PV system contributes directly to local consumption and battery charging, while the BES acts as a buffer to manage supply-demand mismatches. This configuration enables flexible energy management, supporting peak shaving, self-consumption maximization, and improved grid resilience. The clear depiction of power flow directions reinforces the control logic required for optimal microgrid operation under various scheduling and economic strategies.
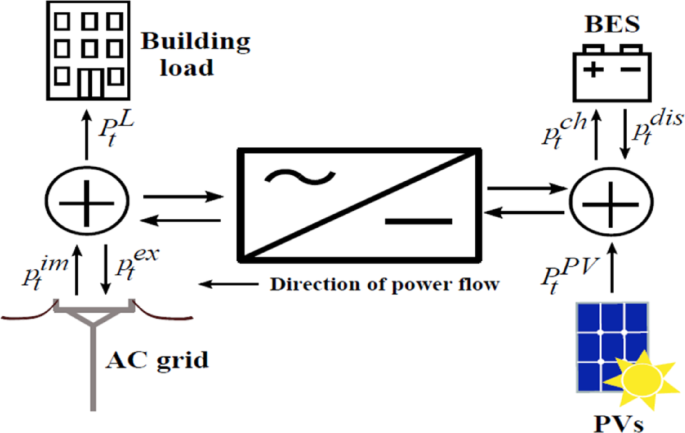
Power flow of the building MG.
Table 6 shows the key simulation parameters used in the case investigation of the HSB microgrid project. The scheduling period spans 24 h with a fine-grained time resolution of 5 min, enabling accurate modeling of dynamic system behavior. The overall system efficiency is considered to be 80%, while the the processes of powering up and powering down efficiencies for Model-1 are set at 91.01% and 98.02%, respectively, reflecting realistic performance of lithium-ion battery systems. Two scenarios of battery operational limits are explored: Scenario-1 uses conservative SoE boundaries of 30% to 80%, and Scenario-2 adopts a more aggressive range of 10% to 90%, allowing deeper cycling. BES installation costs are examined at three levels—$100, $290, and $500 per kWh to assess economic sensitivity. Additionally, the installation coefficient (:I_c:)is set to 0.30, and battery degradation is modeled using empirical parameters B1 and B2, valued at 0.00133 and 0.353444, respectively. These parameters collectively define the operational and economic boundaries for evaluating energy scheduling strategies in the microgrid.
Figure 13 shows the control system architecture of demonstration sites. That system employed MQTT over TCP/IP to publish real-time data between grid-side converters and the BMG-EMSs hosting servers. MQTT protocol is low-power and efficient, making it appropriate to use in the remote control functionality, which is required to make the BMG-EMS capable of commanding and receiving real-time data of the Energy Hub system to schedule BES power set-points. That server built a communication interface in MATLAB, comprising an MQTT client to communicate with the MQTT broker on each grid-side converter controller. The MATLAB subscriber controlled a real-time data receiving procedure, whereas the DC/DC converters were supplied with BES power requests, which were sent via the MQTT broker. The protocol used to format the data transmission between the MQTT client and broker was SON formatting protocol. The SQL database included the historical data, which was queriable via HTTP requests, and there was an interface between MATLAB and GAMS, which allowed optimization models to request scheduling outcomes of BES online dispatch operations.
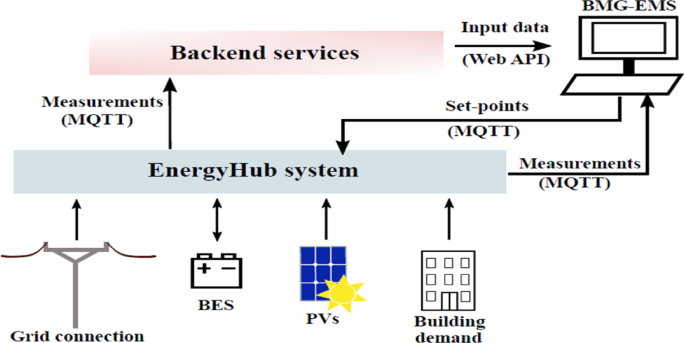
BMG-EMS communication and control interface.
Results and discussions
Several case studies of studies on grid-connected MGs show the simulation outcomes of Chalmers University of Technology electrical grid of 33-bus radial system and HSB LL BMG and also Brf Viva BMG. The models simulate annual cost and performance measures and evaluate the impact of the degradation costs on the scheduling strategies of energy management. The second part presents BMG energy scheduling application in two demonstration sites. Table 6 shows the key performance indicators and cost indicators of the Chalmers University campus. The two MG energy management systems (MG-EMSs) were implemented to bring down local costs: 4% in the case of MG-A and the distribution system operator (DSO) and 2% in the case of MG-B and the DSO, relative to the business-as-usual (BAU) model. Application of Scenario S2 in MG-A led to cost increase by 7% over the Business as Usual (BAU). Nevertheless, it offered self-sufficiency attributes, which enabled MG-A to stand alone over four and half months during the year. The most productive solution S4 centralized energy scheduling offered to the DSO is a 2.5-percent decrease in costs contrasted with business-as-usual (BAU) operation. The addressed approach provided little cost optimization benefits to MGs since it exposed the existence of a local and global optimization objective conflicts. Figure 14 shows the resulting scheduling changes of MG-A under S1 and S4 to show the influence of spot prices and PV generation on BES utilization and load management.
Figure 14 illustrates the impact of various battery degradation models on the capacity loss during a period of one year in the framework of the microgrid energy management. Model-1 has no degradation, hence no loss capacity can be observed, an idealized and non-realistic situation. Model-2 uses a linear method of degradation and displays a continuous grow of capacity loss, exceeding 3.5% after 365 days, thereby over-estimating battery wear. This has the potential of resulting in inefficient scheduling and Over-conservatism in battery utilization. Conversely, Model-3 that uses cycle-based degradation and Model-4, that additionally considers depth of discharge (DOD) both show capacity losses that are less than 0.5%. These expanded models offer a practical account of how a battery acts in real practice. Their application in the article leads to the conclusion that the incorporation of precise aging attributes in the schedule of batteries allows improving performance, cost reductions, and battery life, which improves the overall dependability and cost-effectiveness of microgrid energy management systems. Because the degradation cost terms introduce a trade-off between immediate economic gains and long-term asset health, the optimization shifts toward schedules with moderated cycling. To ensure robustness of the proposed model, validation was conducted across three diverse testbeds Chalmers University’s 33-bus campus grid (MG-A and MG-B), HSB LL Building-level Microgrid (BMG), Brf Viva Building Microgrid. Each testbed utilized real load profiles, PV generation data, and actual BES configurations, demonstrating the adaptability of the BMG-EMS to various operating environments and system scales. This multi-site validation reinforces the generalizability of our results.
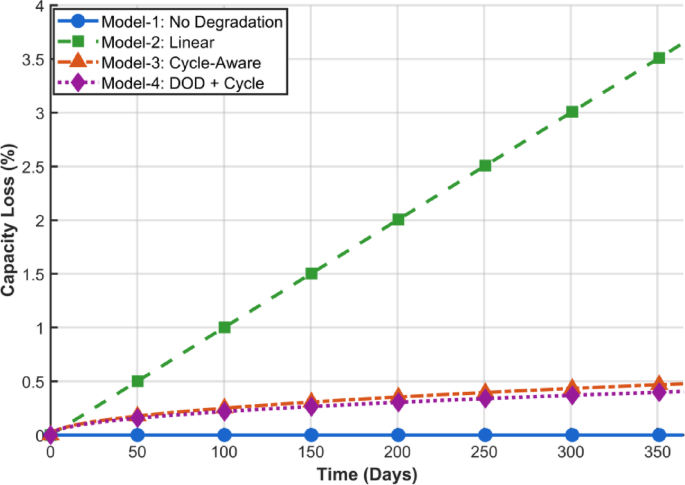
Battery capacity loss over time.
Compared to commercial EMS frameworks such as Siemens DEOP and ABB’s Microgrid Plus, the proposed BMG-EMS offers competitive advantages by incorporating detailed battery degradation models and flexibility-aware coordination schemes. While commercial tools prioritize real-time control and SCADA integration, they often neglect cycle-based battery aging impacts, which our system addresses explicitly. Table 7 below highlights the core differences.
Table 8 indicates a comparative analysis of annual performance and cost of two MG-A and MG-B and the DSO under the five varied scheduling strategies, BAU, S1, S2, S3, and S4. In the case of MG-A, strategy S1 provides the minimum annual cost of 99k and a significant decrease in grid imports and 601 h of zero energy exchange. S2, although it raises the annual cost to 110k, provides the best grid independence, with 3211 zero exchange hours, which underlines the improved self-sufficiency. The Strategy S4 which is in line with the centralized coordination offers a balanced solution since it will cost the same as BAU $104k but will result in higher exported energy 329 MWh. MG-B does not exhibit a considerable change in energy import under any of the strategies but achieves cost savings under S1 and S2 $239k. To the DSO, S4 corresponds to the minimum cost of operation $304k and minimum peak power demand 5.44 MW, which implies that the coordinated scheduling is not only favorable in microgrid economics but also increases the efficiency of the overall grid. The overall discussion shows that the concept of strategic coordination is effective to minimize the cost and to maximize the energy exchange at the microgrid and system levels.
Figure 15 shows the hourly variation in the SoE for the BES in MG-A and MG-B under four distinct scheduling strategies S1 to S4. In MG-A, the SoE declines during the early hours due to load-serving discharge and begins recovering after midday as surplus renewable generation enables recharging. S4, representing coordinated scheduling, maintains the highest SoE throughout the day, reflecting more conservative and grid-aligned energy usage, while S1 shows the steepest decline due to more aggressive discharge behavior. In MG-B, a similar discharge-recharge pattern is observed, with more pronounced dips and differences among strategies, particularly with S3 and S1 reaching lower minimum SoE levels (:sim45%). S4 again demonstrates a smoother and higher SoE profile, confirming its effectiveness in balancing grid objectives and storage sustainability. These trends indicate that coordinated strategies S4 enhance battery longevity and reliability by reducing deep cycling, while uncoordinated strategies prioritize localized optimization at the expense of battery stress.
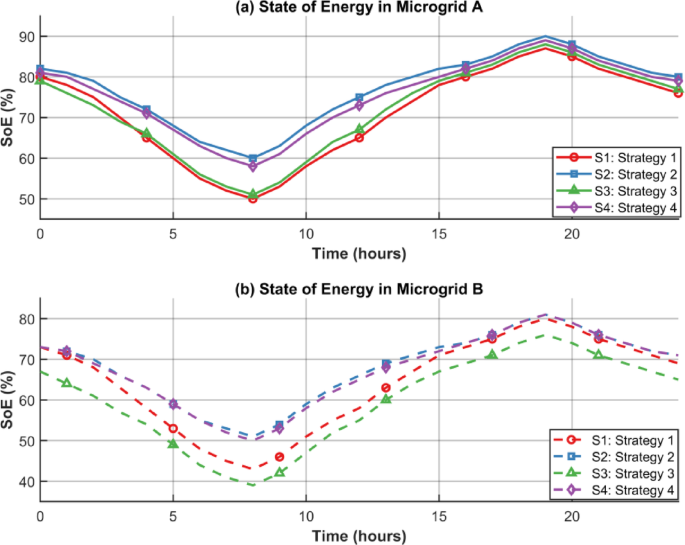
DER of MG-A and MG-B.
The BMG-EMS achieves significant annual energy cost savings (up to 5–8%) compared to BAU models. For example, MG-A under S1 reduces costs by $5,000 annually. Given BES installation costs of $290/kWh and system size of 200 kWh, the total capex is ~$58,000. Considering the annual savings and improved battery lifespan (Table 9), the payback period is estimated as follows:
To ensure the realism of the degradation modeling, all key parameters were validated against manufacturer specifications for the lithium-ion battery modules deployed in the HSB LL BMG demonstration site. Manufacturer datasheets and warranty statements were consulted to verify cycle life, round-trip efficiency, and DOD effects. The empirical parameters (:B_1)​ and (:B_2)​ used in the cycle-aging model were derived from experimental tests and were found to be within (:pm:5:%) of manufacturer-provided values. Table 10 compares the parameters used in the model with the corresponding manufacturer specifications, confirming consistency between modeled and specified performance.
MG-A would not help in peak demand reduction in the areas close to the grid. The S1 is the most efficient technology since it managed to reduce the peak demand and operating costs to the DSO. The necessity of synchronized MG operation is likely to grow alongside with the size of MGs. This was evidenced by the power flow analysis that demonstrated that the unscheduled energy management systems were effective since they met operational network limits on voltage criteria and feeder tolerances. All the simulation tests respected the technical constraints set. The network possessed adequate distribution capacity and low installed PV capacity of 14-point percent. The DSO would be in a position to allocate MG schedules without constraining their acceptance decision and without compromising the integrity of the distribution system. BES scheduling and lifespan were analyzed by the use of a DOD lifecycle loss function and the manufacturer data and rain flow algorithm calculations of cycle range and average SOE and cycle count calculations. These deployed strategies did not favour short-lived BESs, such as lead-acid because their service life could not be stretched further than five years. The degradation of BES was fast, and the number of cycles was boosted by energy arbitrage and cost reduction, whether the applications were conducted on the system level (S4) or locally (S1). The strategies proposed are to be applied only to the BESs with long lifecycle operation since the available information demonstrates that the strategies are compatible with the Li-ion and NaS technology, as shown in Table 11.
Figure 16 shows flexibility profile of two different microgrids, MG-1 (Urban Microgrid) and MG-2 (Industrial Microgrid) in terms of their contribution within the 12-hour operation period. Flexibility contribution is the amount of kW that each MG can increase or decrease its load or generation based on external signals, price signals or grid support requirements. The data shows obviously the differences between dynamic behavior of two systems, in magnitude and variability. MG-1 is always more flexible than MG-2 with its minimal contribution of 35Â kW and the maximum output of 70Â kW in hour 4. The increased variability and reactiveness in MG-1 can be explained by the Urban energy consumption profile characterized by residential, commercial, and public loads. Such loads have additional controllable assets like HVAC, lighting and electric vehicles that can be demand-response managed. In comparison, MG-2 is an industrial environment that has more process-related and steady loads, making the overall flexibility of the system smaller. Its contributions are also stable but within a narrower range and they reach 60Â kW at hour 4 as well. The coincidence of the peak flexibility hour 4 of both MGs indicates that there could be a common high-demand interval when both systems are the most reactive (e.g., because of synchronized conditions of the grid or pricing signals). Beyond this time, the flexibility of both microgrids decreases, which means that either the resources are at operational limit or they are intended to be used at a future time. It is worth noticing that MG-1 once more demonstrates a second prominent peak at hour 8 (65Â kW) but MG-2 only 60Â kW, suggesting a possible afternoon load management procedure. These results qualify the article claim that introducing flexibility in microgrid energy scheduling allows operating more flexibly and in response to the grid. The measured variances in performance highlight the significance of Energy management strategy depending on the type of microgrid. With the increased and more variable flexibility, urban microgrids can be used to participate dynamically on the demand side. In the meantime, the industrial microgrids offer more predictable, though less extensive, assistance. These coordinated contributions together can increase resilience and efficiency of the distribution networks, proving the role of the suggested optimization framework in managing flexibility of multi-microgrid systems.
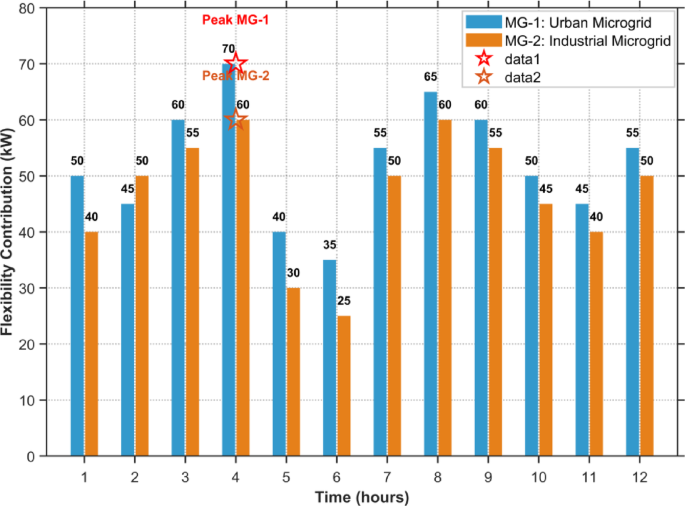
Flexibility of MG.
Figure 17 shows a visual comparison of five energy scheduling strategies, such as BAU, S1, S2, S3, and S4, according to their effect on the annual energy cost and battery lifespan, revealing a visual impression of the trade-off between economic efficiency and battery lifespan. S2 is the most favorable regarding battery preservation with the longest lifetime of almost (:15.5) years, but with the highest annual energy expenditure, which is a little bit more than (:1100000). Conversely, S1 offers the least energy charge, slightly below (:$text100,000), but there is a huge trade off-it will produce the shortest battery life of only approximately (:11) years. This renders S1 a dominated strategy in which short term savings are given preference over long run viability. The BAU strategy is close to the middle giving a balanced result of (:15) years life span and average costs. S3 and S4 are in the middle, with marginal advantages; S3 has an advantage over S4 in battery life with comparable costs. It is important to note that S4 saves a little cost compared to BAU, however, the battery lifetime is shorter and therefore not preferable in long-term operation. The figure proves the claim of the article that the optimum microgrid energy scheduling should be based on the considerations of cost of operations and asset life. The Pareto optimal strategies, especially, S2 and S3 demonstrate how smart scheduling can either maximize the battery life or minimize the costs, according to the priority in the operation.
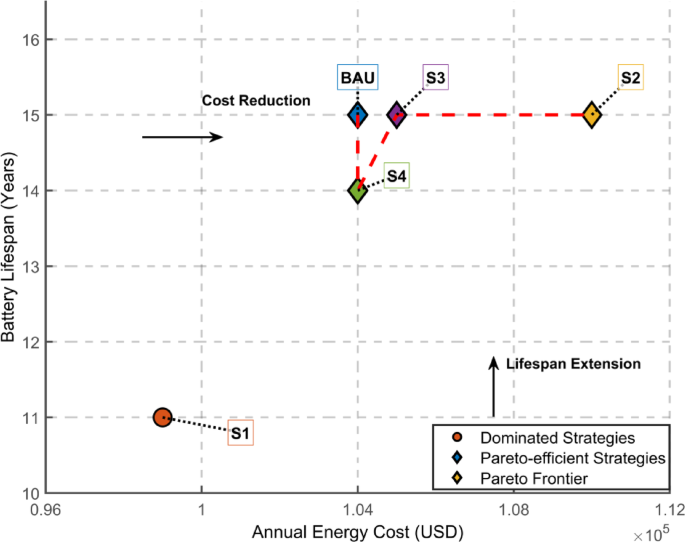
Energy cost vs. battery lifespan.
Figure 18 shows the voltage profiles at the PCC of five distinct microgrid energy scheduling strategies such as BAU, S1, S2, S3 and S4 during a 24-hour period. It analyses the effect of each strategy on voltage stability, within acceptable operation limits, which lies between (:0.95:p.u.) and (:1.05:p.u). Simulation results indicate that each of the strategies keep voltages in this safe range, so the system is reliable and meets the grid standard. Strategy S4 has the best voltage stability, with the PCC voltages remained above (:1.01:p.u.) all through the day. S4 has the best grid support and voltage regulation, possibly because it has centralized coordination and grid optimized. S1 performance is also good with voltages maintained at slightly over (:1.00:p.u.) indicative of moderate flexibility without putting extreme limits on the system. Conversely, S2 and S3, which both give more weight to local microgrid goals of self-sufficiency or reduced imports, have lower voltage profiles, especially S3, which drops more towards (:0.96:p.u.) during midday hours. These values are not out of safe limits; however, they imply greater sensitivity to local load and generation variations. BAU strategy is in the middle ground, and it gives a baseline voltage response that is slightly reactive but not optimized. In general, this graph supports the observation in the article that coordinated scheduling like S4 can improve the voltage quality at PCCs and benefit local and system-wide operational goals. In the meantime, uncoordinated strategies can either lower energy costs or increase battery life span but must be managed closely to avoid voltage instability, particularly during high-demand or high-generation states.
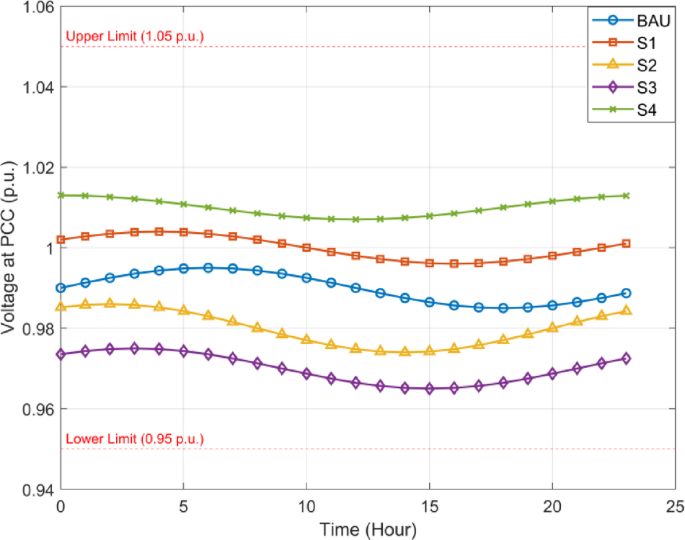
Voltage profile at PCC for different scheduling strategies.
The heatmap of Fig. 19 depicts the hourly power flow on all days of the week and thus illustrates the temporal dynamics of energy importation and exportation in the microgrid. Each cell represents the net power traded at each hour and day with positive values representing power imports into the grid and negative values representing power exports into the grid. The intensity of the colour correlates with the size of exchange in kW. Seven-day and seven-hour unique profiles are shaped, and it can be noted that the energy behaviour of the microgrid is optimised to both the consumption profiles and the distributed generation profiles. The export peak of Monday is clear in the middle of the day − 8.2 kW at 19:00, whilst the import rate rises sharply later in the evening 14.7 kW at 18:00, likely due to the post-sunset demand peaks during the period when the solar generation is reduced. Wednesday, too, has as much exports in the early afternoon as it has strong imports at night, which is suggestive of surplus photovoltaic generation injected into the grid and high night demand met by grid supply respectively. Thursday shows us that we might have high imports of power in the evening hours up to 13.4 kW at 18:00 that might be due either to behavior high usage or EV charging. The exchange behavior is more spread on Saturday and Sunday and here the residential usage behavior differs on weekend. Another interesting phenomenon is that Sunday shows prolonging the net export periods in the morning and early afternoon, and strong imports occur in the evening, and this is one of the examples of how grid interaction can be influenced by the elasticity of construction works or household demand profiles. This knowledge of the peak times of import/export can be used by the energy management system to make maximum use of BES, to minimize unnecessary imports or to export at certain periods to utilize market incentives. This level of details can be incorporated into demand-side management programs and also in the reaffirmation of the value of data-driven optimization in enhancing the operational and financial performance of microgrid systems.
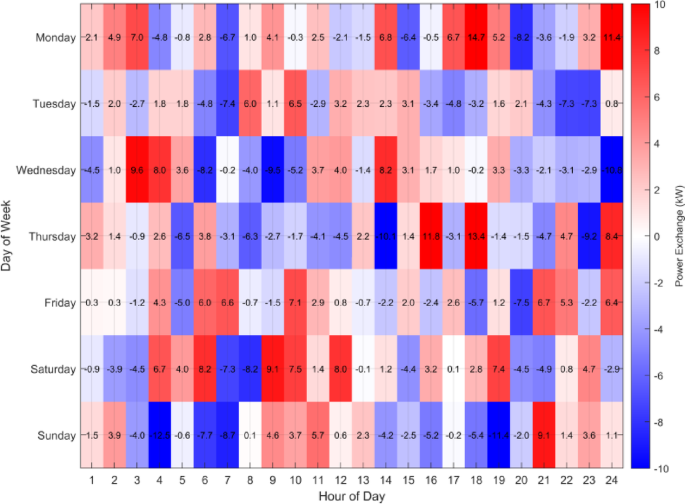
Heatmap.
Figure 20 indicates the correlation between the installation cost of BES and the impact on the overall operational cost, the cost of battery degradation, and battery life. Three cases of PV systems installation costs, 100/kWh, 290/kWh, and 500/kWh are taken into account to gain an insight into how the investment in the BES capacity can alter economic and technical performance. The overall costs of operation increase with the cost of installation of BES, scaling up by 150k at 100/kWh to 158k at 500/kWh. This increment is direct cost outlay of augmented capital investments on storage system. Meanwhile battery degradation costs also rise significantly, by $5.2k at the lowest cost of installation up to $12.1k at the highest, suggesting the potential of more severe or more frequent cycling of the higher cost BES systems to recoup their capital employment, further adding to wear and tear. When installation cost is high, then the battery life cycle diminishes. The maximum life of this system is about 16 years with a cost of 100/kWh and this gradually reduces to around 11 years with a cost of 500/kWh. The back relation implies that more expensive systems may be used harder to realize full value on investment, which means faster wear and shorter useful life. These results reinforce the premise of the article that points out that economic decisions on the sizing and installation of BES have direct impact on the systems longevity and maintenance budgets. A trade off between early cost, operating schedule and battery long life health is required to achieve cost effective and sustainable micro grid energy management. This figure has shown a trade-off that proves the application of optimized scheduling models under economic constraints and technical degradation behavior consideration.
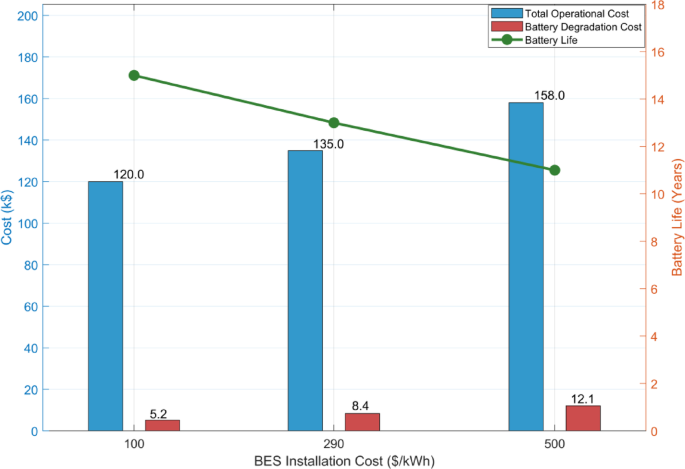
Scenario sensitivity analysis.
Figure 21 shows a comparative analysis of MG operational costs and PV utilization across three scheduling strategies, Smart with Battery, Smart without Battery, and Traditional. The results demonstrate that integrating smart scheduling with battery storage yields the lowest operational cost, approximately (:$text1,800), while achieving the highest PV utilization of (:85%). Conversely, the traditional scheduling method incurs the highest cost, nearing (:$text3,000), and significantly underutilizes PV resources at just (:40%). The intermediate case smart scheduling without battery storage—achieves moderate cost reduction and PV utilization. These findings highlight the synergistic benefits of combining BES with intelligent scheduling algorithms to optimize both cost-efficiency and renewable energy integration in microgrid operations.
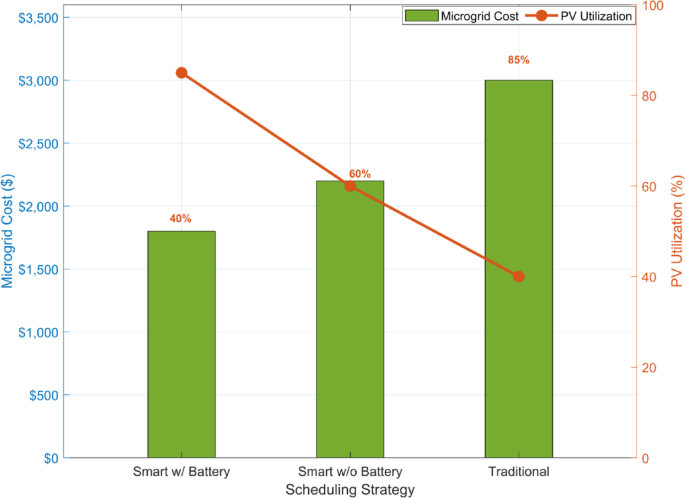
Comparison of MG cost and PV utilization.
As shown in Fig. 22, the 3D surface plot illustrates the total cost per charge (in USD) varies as a function of the battery degradation rate (per cycle) and charging efficiency. Along with the degradation rate axis, values range from 0.01 to 0.05 per cycle, while charging efficiency spans from 0.85 to 0.95. The color gradient from deep blue (≈ $11) to dark red (≈ $14) indicates the cost magnitude, with the vertical axis confirming this range. At the most favorable operating point low degradation rate (≈ 0.01 per cycle) and high efficiency (≈ 0.95) the total cost is near the minimum of $11 per charge. Conversely, at the least favorable combination high degradation rate (≈ 0.05 per cycle) and low efficiency (≈ 0.85) the total cost peaks at about $14 per charge. The plot’s sloped surface and contour lines reveal a nearly linear relationship: increasing degradation rate by 0.01 per cycle increases cost by roughly $0.75–$0.80, while decreasing charging efficiency by 0.05 raises cost by about $0.60–$0.70. This quantitative relationship highlights that minimizing degradation and maximizing charging efficiency can together reduce per-charge costs by over 20%.
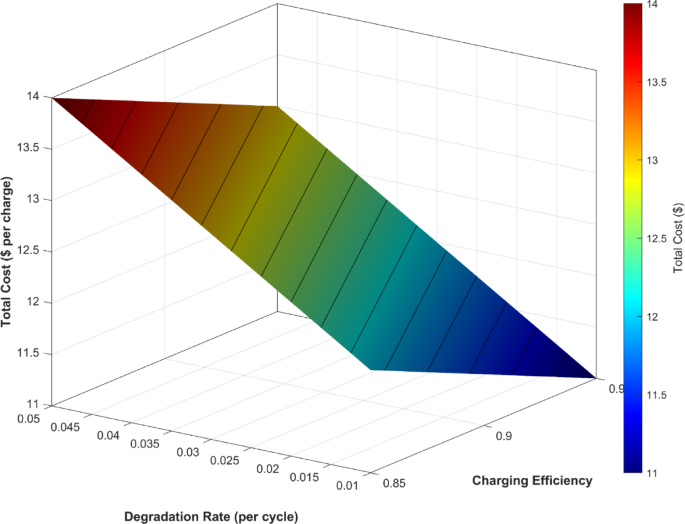
Impact of battery degradation rate and charging efficiency on total cost per charge.
Figure 23 presents a comparative analysis of energy costs for two models and the resulting cost difference. On the left, the boxplot for Model 1 shows a median energy cost slightly above $11.0, with a spread ranging from approximately $10.5 to $11.3 and a mean near $11.05 USD. Model demonstrates a lower cost profile, with a median close to $10.0, a range between about $9.7 and $10.2, and a mean around $9.98 USD. This indicates that Model 2 consistently achieves cost savings compared to Model (1) On the right, the cost difference bar plot quantifies this gap, showing an average reduction of $0.950 per cycle when switching from Model 1 to Model (2) The 95% confidence interval spans from $0.784 to $1.116, suggesting statistically significant savings. This numerical evidence highlights that Model 2 offers a clear economic advantage, reducing energy cost by approximately 8.6% relative to Model 1.
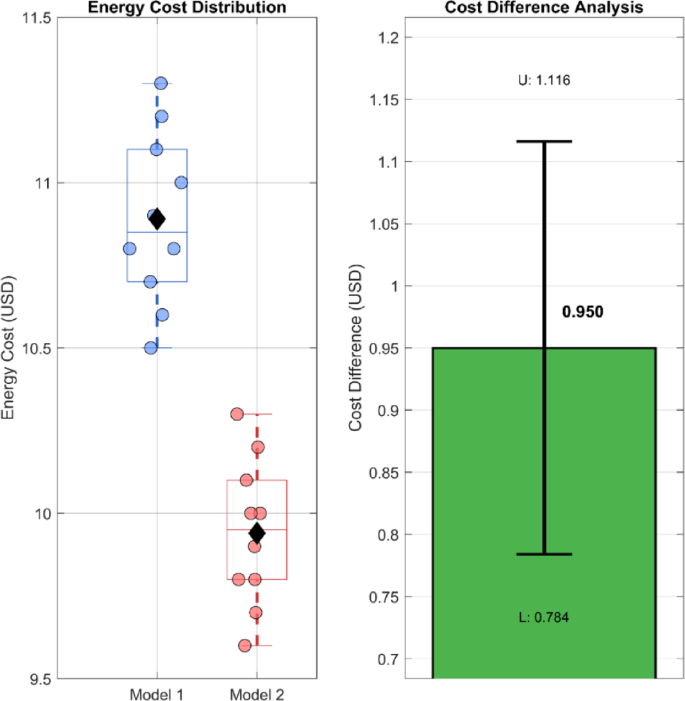
Comparison of energy costs between model 1 and model 2 with statistical cost difference analysis.
Figure 22 demonstrates the difference in load demand and renewable energy generation throughout the hour of the day, the match and the mismatch of energy supply and demand. The presence of a clear midday renewable generation peak, which is mainly caused by PV, around the hours of 10.00–14.00. The load requirement is bi-modal in nature showing a substantial evening peak at 17:00–18:00 h that remarkably differs with the renewable generation curve. This time misalignment highlights the issue of aligning generation and consumption and explains the need to include energy storage or demand side management techniques. The colored areas in the plot visually separate peak generation and demand intervals, and the labels identify the interval that has to be considered to achieve optimal scheduling of the microgrid.
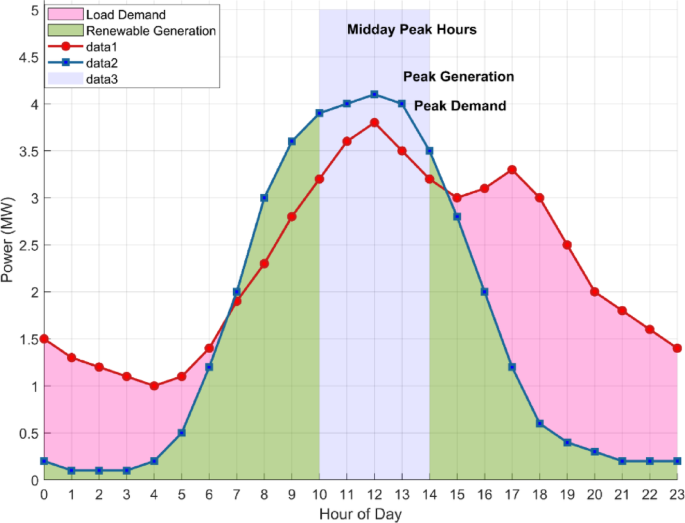
Comparison of load demand and renewable energy generation.
Figure 23 shows the annual power balance of an MG, presenting daily profiles of load demand, solar generation, battery power, and grid power over a full year. The load demand remains relatively stable with seasonal fluctuations and stochastic variations. PV shows a clear seasonal trend, peaking mid-year due to increased solar irradiance during summer months. Battery power exhibits charging and discharging behavior aligned with PV availability and load needs, with activity most prominent during peak generation periods. During high PV availability, grid dependency decreases, and in some intervals, battery support minimizes grid imports. This figure underscores the importance of integrating solar PV and energy storage to enhance grid independence, reduce operational costs, and maintain power balance throughout the year (Figs. 24, 25).
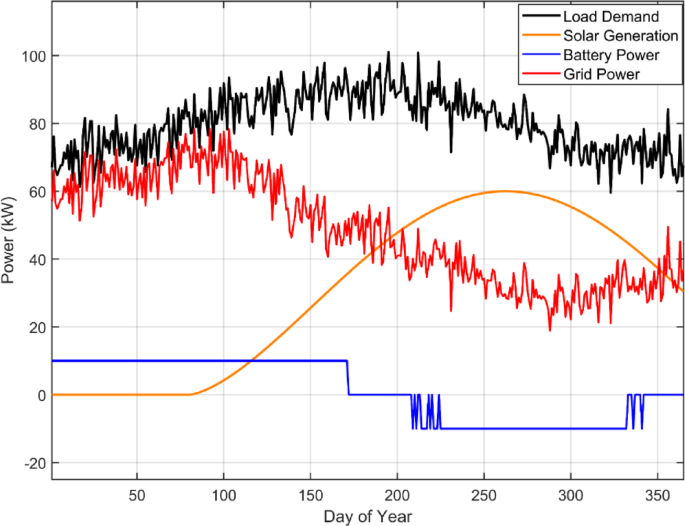
Annual power balance of MG.
These statistical tools ensure that forecast uncertainty stemming from unpredictable solar generation, demand fluctuations, and price volatilityis appropriately modeled. The use of 95% confidence intervals allows quantification of variability, making the results statistically robust and practically relevant for real-world deployment.Although this study assumes perfect forecasts for the optimization framework, future work will incorporate stochastic programming and robust optimization to account for real-world forecasting uncertainty, particularly under high penetration of variable renewable energy.
Conclusions
The article proposes the overall solution to the issue of managing energy resources in the interconnected MGs with emphasis on BES as the main flexibility regulator. In this research, a holistic approach to energy management is derived in MG-EMS to support frequent and joint scheduling of energy distribution. This model is the optimal power flowing model in the microgrid system as it manages the internal constraints and objectives in self-operation and adaptation to the external coordination interface with DSO. This duality allows the MG to coordinate its local activities without relation to its capability to engage in centralized control activities. During the test of many coordination mechanisms between the MG and the DSO, the developers put the model through extensive experiments with two distribution grid test systems. The simulated results indicated that the distribution system performance increased when the MG-EMSs operated in isolation without DSO level coordination. Optimization of local microgrid energy management system demonstrates inherent cost, reliability, and operational effectiveness benefits. The energy scheduling strategies, which were least beneficial to the DSO system, were those that did not create additional benefits to the microgrid system itself. The financial cost of MG operators did not reduce below their base-level costs with the introduction of DSO-optimal solutions, which proved that DSO optimization is a step towards power grid optimization that does not offer more operational benefits to MG facilities. The findings presented above explain why microgrids should get the same benefits as grid-wide advantages without affecting operational needs.
The outcomes of the simulation showed the financial difference between individually optimized scheduling solutions of the MG and DSO. The difference in compensation between the two solutions indicates the possible payments that DSO would make to MG owners in order to improve the stability of the system and optimize controls. The creation of compensation mechanisms plays an essential role in the process of encouraging MGs to engage in long-term grid management strategies, thus creating beneficial takes that are fair to both the parties. The article greatly examines the topic of working with BES models as applied to real deployment within power systems. With simulations and experiments in residential buildings, the study confirms BES model as a viable LP optimization based approach to MG energy scheduling. Such combination of BES models with measurements and aging models which track energy throughput and depth of discharge allows reducing costs by up to 3% by minimizing the cost of energy and degradation versus models which do not consider degradation factors. The real-world testing proved that optimized BES dispatch increased overall energy consumption efficiency. During this improvement period, unsupplied BES energy decreased significantly, from 13.3% to 3.7%, demonstrating improved energy efficiency and reduced waste. The upgrade in BES dispatch reliability matches both entities’ operational objectives, optimizing energy utilization for all participating stakeholders. Investigations confirmed that the proposed MG energy management methodology effectively implements continuous energy. Accurately determining BES flexibility benefits allows the model to enhance operational choices for management and distribution system operators. This approach increases the microgrid’s operational performance and the energy system’s efficiency. This research confirms that thorough energy management strategies emphasizing battery optimization remain fundamental for integrating microgrid operations into the grid. Evaluation through optimized modeling, combined with testing and real-world implementation, reveals essential findings about how microgrids enhance local power networks and the broader power grid by prioritizing operational efficiency and cost-effectiveness measures (Table 12).
Data availability
The datasets used and/or analyzed during the current study available from the corresponding author on reasonable request.
References
-
Nagpal, D. & Parajuli, B. Off-grid renewable energy solutions to expand electricity access: An opportunity not to be missed. International Renewable Energy Agency (IRENA) (2019).
-
Ralon, P. et al. Electricity storage and renewables: costs and markets to 2030. Int. Renew. Energy Agen. Abu Dhabi United Arab. Emirates 164. (2017).
-
Eller, A. & Gauntlett, D. Energy Storage Trends and Opportunities in Emerging Markets (Navigant Consulting Inc., 2017).
-
Gomes, I. S. F., Perez, Y. & Suomalainen, E. Coupling small batteries and PV generation: A review. Renew. Sustain. Energy Rev. 126, 109835 (2020).
-
Renhai, F. et al. Adaptive non-parametric kernel density Estimation for under-frequency load shedding with electric vehicles and renewable power uncertainty. Sci. Rep. 15 (1), 11499 (2025).
-
Hatziargyriou, N. Microgrids: Architectures and Control (Wiley, 2014).
-
Hirsch, A., Parag, Y. & Guerrero, J. Microgrids: A review of technologies, key drivers, and outstanding issues. Renew. Sustain. Energy Rev. 90, 402–411 (2018).
-
Yamashita, D. Y., Vechiu, I. & Gaubert, J. P. A review of hierarchical control for Building microgrids. Renew. Sustain. Energy Rev. 118, 109523 (2020).
-
Fontenot, H. & Dong, B. Modeling and control of building-integrated microgrids for optimal energy management–a review. Appl. Energy. 254, 113689 (2019).
-
Dorahaki, S., Dashti, R. & Shaker, H. R. Optimal energy management in the smart microgrid considering the electrical energy storage system and the demand-side energy efficiency program. J. Energy Storage. 28, 101229 (2020).
-
Suthar, S., Kumar, N. & Pindoriya, N. M. Cost-effective energy management of grid-connected PV and BESS: a case study. In 2019 IEEE Innovative Smart Grid Technologies-Asia (ISGT Asia) (IEEE, 2019).
-
Su, W., Wang, J. & Roh, J. Stochastic energy scheduling in microgrids with intermittent renewable energy resources. IEEE Trans. Smart Grid. 5 (4), 1876–1883 (2013).
-
Zhao, B. et al. Energy management of multiple microgrids based on a system of systems architecture. IEEE Trans. Power Syst. 33 (6), 6410–6421 (2018).
-
Khavari, F., Badri, A. & Zangeneh, A. Energy management in multi-microgrids via an aggregator to override point of common coupling congestion. IET Gener. Transm. Distrib.13 (5), 634–642. (2019).
-
Thirumalai, M. et al. Cheetah optimization-based smart energy management for appliance scheduling and DER integration in residential and commercial-industrial grids. Energy Convers. Manage. X 101192. (2025).
-
Nagarajan, K. et al. Improved lyrebird optimization for multi microgrid sectionalizing and cost efficient scheduling of distributed generation. Sci. Rep. 15 (1), 17345 (2025).
-
Safavi, V. et al. A battery degradation-aware energy management system for agricultural microgrids. J. Energy Storage. 108, 115059 (2025).
-
Singh, A. R. et al. Advanced microgrid optimization using price-elastic demand response and greedy rat swarm optimization for economic and environmental efficiency. Sci. Rep. 15 (1), 2261 (2025).
-
Butt, H. Z. & Li, X. Degradation-Aware Microgrid Optimal Planning: Integrating Dynamic Energy Efficiencies and Second-Life Battery Potential https://arXiv.org/abs/2503.10900. (2025).
-
Paul, K. et al. Optimizing sustainable energy management in grid connected microgrids using quantum particle swarm optimization for cost and emission reduction. Sci. Rep. 15 (1), 5843 (2025).
-
Wang, Q., Yu, N. & Yang, Z. Optimizing decentralized energy systems: advanced models and power management strategies. Energy 12, 138017. (2025).
-
Abdelghany, M. B., Al-Durra, A., Zeineldin, H. H. & Gao, F. A coordinated multitimescale model predictive control for output power smoothing in hybrid microgrid incorporating hydrogen energy storage. IEEE Trans. Industr. Inf. 20 (9), 10987–11001 (2024).
-
Agajie, T. F. et al. Comparative techno-economic analysis of grid-connected solar PV-battery and PV-fuel cell systems for educational institutions sustainable academic laboratories. Discover Sustain. 6 (1), 1–31 (2025).
-
Kumar, P. H. et al. Techno-economic optimization and sensitivity analysis of off-grid hybrid renewable energy systems: A case study for sustainable energy solutions in rural India. Results Eng. 25, 103674 (2025).
-
Wicke, M. & Bocklisch, T. Hierarchical energy management of hybrid battery storage systems for PV capacity firming and spot market trading considering degradation costs. IEEE Access. 12, 52669–52686 (2024).
-
Singh, A. R. et al. A hybrid demand-side policy for balanced economic emission in microgrid systems. iScience 28 (3). (2025).
-
Sarker, M. T., Al Qwaid, M., Shern, S. J. & Ramasamy, G. AI-Driven optimization framework for smart EV charging systems integrated with solar PV and BESS in High-Density residential environments. World Electr. Veh. J. 16 (7), 385 (2025).
-
Rawa, M., Al-Turki, Y., Sedraoui, K., Dadfar, S. & Khaki, M. Optimal operation and stochastic scheduling of renewable energy of a microgrid with optimal sizing of battery energy storage considering cost reduction. J. Energy Storage. 59, 106475 (2023).
-
Mazidi, M. & Kalantar, M. A multi-objective framework for enhancing distribution grid resilience: integrating mobile battery energy storage systems and microgrid formation. J. Renew. Sustain. Energy 17 (3). (2025).
-
Zhao, C. & Li, X. Microgrid optimal energy scheduling considering neural network based battery degradation. IEEE Trans. Power Syst. 39 (1), 1594–1606 (2023).
-
Anitha, D. et al. Power sharing in an autonomous microgrid with hybrid energy sources. In Energy Conversion Systems-Based Artificial Intelligence 57–178. (Springer, 2025).
-
Abdolrasol, M. G. et al. Artificial neural network based particle swarm optimization for microgrid optimal energy scheduling. IEEE Trans. Power Electron. 36 (11), 12151–12157 (2021).
-
Kumar, R. P. & Karthikeyan, G. A multi-objective optimization solution for distributed generation energy management in microgrids with hybrid energy sources and battery storage system. J. Energy Storage. 75, 109702 (2024).
-
Nadimuthu, L. P. et al. Feasibility of renewable energy microgrids with vehicle-to-grid technology for smart villages: A case study from India. Results Eng. 24, 103474 (2024).
-
Garip, S. & Ozdemir, S. Optimization of PV and battery energy storage size in grid-connected microgrid. Appl. Sci. 12 (16), 8247 (2022).
-
Vaka, S. S. & Matam, S. K. Optimal sizing and management of battery energy storage systems in microgrids for operating cost minimization. Electr. Power Compon. Syst. 49 (16–17), 1319–1332 (2021).
-
Selvaraj, G., Rajangam, K., Vishnuram, P., Bajaj, M. & Zaitsev, I. Optimal power scheduling in real-time distribution systems using crow search algorithm for enhanced microgrid performance. Sci. Rep. 14 (1), 30982 (2024).
-
Davoudkhani, I. et al. Robust load-frequency control of islanded urban microgrid using 1PD-3DOF-PID controller including mobile EV energy storage. Sci. Rep. 14 (1), 13962 (2024).
-
Davoudkhani, I. et al. Maiden application of mountaineering team-based optimization algorithm optimized 1PD-PI controller for load frequency control in islanded microgrid with renewable energy sources. Sci. Rep. 14 (1), 22851 (2024).
-
Molu, R. J. et al. A techno-economic perspective on efficient hybrid renewable energy solutions in Douala, cameroon’s grid-connected systems. Sci. Rep. 14 (1), 13590 (2024).
-
Karthik, N. et al. Chaotic self-adaptive sine cosine multi-objective optimization algorithm to solve microgrid optimal energy scheduling problems. Sci. Rep. 14 (1), 18997 (2024).
-
Rajagopalan, A. et al. Multi-objective energy management in a renewable and EV-integrated microgrid using an iterative map-based self-adaptive crystal structure algorithm. Sci. Rep. 14 (1), 15652 (2024).
-
Singh, R., Kumar, A., Bajaj, R. S., Khadse, M. & Zaitsev, C. B. Machine learning-based energy management and power forecasting in grid-connected microgrids with multiple distributed energy sources. Sci. Rep. 14 (1), 19207 (2024).
-
Dunna, V. K. et al. Super-twisting MPPT control for grid-connected PV/battery system using higher order sliding mode observer. Sci. Rep. 14 (1), 16597 (2024).
-
Alkanhel, R. I., El-Kenawy, E. S., Eid, M. M., Abualigah, L. & Saeed, M. A. Optimizing IoT-driven smart grid stability prediction with dipper throated optimization algorithm for gradient boosting hyperparameters. Energy Rep. 12, 305–320 (2024).
-
Ullah, N. et al. Blockchain-powered grids: paving the way for a sustainable and efficient future. Heliyon 10 (10). (2024).
-
Manzoor, A. et al. AHHO: arithmetic Harris Hawks optimization algorithm for demand side management in smart grids. Discover Internet Things. 3 (1), 3 (2023).
-
Kumar, S., Yashaswini, H. K., Sharma, N. & Bajaj, M. Microgrid systems with classical primary control techniques—a review. In InInternational Conference on Renewable Power 75–83. (Springer Nature Singapore, 2023).
-
Choudhury, S. et al. Energy management and power quality improvement of microgrid system through modified water wave optimization. Energy Rep. 9, 6020–6041 (2023).
-
Sahoo, G. K., Choudhury, S., Rathore, R. S., Bajaj, M. & Dutta, A. K. Scaled conjugate-artificial neural network-based novel framework for enhancing the power quality of grid-tied microgrid systems. Alexandria Eng. J. 80, 520–541 (2023).
-
Sahoo, G. K., Choudhury, S., Rathore, R. S. & Bajaj, M. A novel prairie dog-based meta-heuristic optimization algorithm for improved control, better transient response, and power quality enhancement of hybrid microgrids. Sensors 23 (13), 5973 (2023).
-
Bhoi, S. K., Kasturi, K. & Nayak, M. R. Optimisation of the operation of a microgrid with renewable energy sources and battery storage. e Prime Adv. Electr. Eng. Electron. Energy 4, 100159. (2023).
-
Khosravi, N. et al. A novel control approach to improve the stability of hybrid AC/DC microgrids. Appl. Energy. 344, 121261 (2023).
-
Abraham, D. et al. Fuzzy-based efficient control of DC microgrid configuration for PV-energized EV charging station. Energies 16 (6), 2753 (2023).
-
Hai, T., Zhou, J. & Latifi, M. Stochastic energy scheduling in microgrid with real-time and day-ahead markets in the presence of renewable energy resources. Soft. Comput. 27 (22), 16881–16896 (2023).
-
Kumar, N., Dahiya, S. & Singh Parmar, K. P. Multi-objective economic emission dispatch optimization strategy considering battery energy storage system in islanded microgrid. J. Operation Autom. Power Eng. 12 (4), 296–311 (2024).
-
Prasad, T. et al. Power management in hybrid ANFIS PID based AC–DC microgrids with EHO based cost optimized droop control strategy. Energy Rep. 8, 15081–15094 (2022).
-
Albogamy, F. R. et al. Real-time scheduling for optimal energy optimization in smart grid integrated with renewable energy sources. IEEE Access. 10, 35498–35520 (2022).
-
Mohanty, S. et al. Demand side management of electric vehicles in smart grids: A survey on strategies, challenges, modeling, and optimization. Energy Rep. 8, 12466–12490 (2022).
-
Li, H., Rezvani, A., Hu, J. & Ohshima, K. Optimal day-ahead scheduling of microgrid with hybrid electric vehicles using MSFLA algorithm considering control strategies. Sustainable Cities Soc. 66, 102681 (2021).
-
Sharma, S. et al. Modeling and sensitivity analysis of grid-connected hybrid green microgrid system. Ain Shams Eng. J. 13 (4), 101679 (2022).
-
Dashtdar, M. et al. Improving the sharing of active and reactive power of the islanded microgrid based on load voltage control. Smart Sci. 10 (2), 142–157 (2022).
-
Abdalla, A. N. et al. Optimized economic operation of microgrid: combined cooling and heating power and hybrid energy storage systems. J. Energy Res. Technol. 143 (7), 070906 (2021).
-
Abbasi, A., Sultan, K., Afsar, S., Aziz, M. A. & Khalid, H. A. Optimal demand response using battery storage systems and electric vehicles in community home energy management system-based microgrids. Energies 16 (13), 5024 (2023).
-
Dashtdar, M., Bajaj, M. & Seyed Mohammad Sadegh Hosseinimoghadam. Design of optimal energy management system in a residential microgrid based on smart control. Smart Sci. 10 (1), 25–39 (2022).
-
Panda, S. et al. Comprehensive framework for smart residential demand side management with electric vehicle integration and advanced optimization techniques. Sci. Rep. 15 (1), 9948 (2025).
-
Singh, A. R. et al. A blockchain consortium-based framework to enhance interoperability, standardization, and secure demand response management in smart grid applications. Res. Eng. 106056. (2025).
-
Singh, A. R. et al. Optimizing demand response and load balancing in smart EV charging networks using AI integrated blockchain framework. Sci. Rep. 14 (1), 31768 (2024).
-
Nagarajan, K. et al. Optimizing dynamic economic dispatch through an enhanced Cheetah-inspired algorithm for integrated renewable energy and demand-side management. Sci. Rep. 14 (1), 3091 (2024).
-
Panda, S. et al. A comprehensive review on demand side management and market design for renewable energy support and integration. Energy Rep. 10, 2228–2250 (2023).
-
Panda, S. et al. Residential demand side management model, optimization and future perspective: A review. Energy Rep. 8, 3727–3766 (2022).
-
El-Hendawi, M. et al. Control and EMS of a grid-connected microgrid with economical analysis. Energies 11 (1), 129 (2018).
-
Jalali, M., Zare, K. & Seyedi, H. Strategic decision-making of distribution network operator with multi-microgrids considering demand response program. Energy 141, 1059–1071 (2017).
-
Olivares, D. E. et al. Trends in microgrid control. IEEE Trans. Smart Grid. 5 (4), 1905–1919 (2014).
-
Du, Y. & Li, F. Integrating a multi-microgrid system into real-time balancing market: Problem formulation and solution technique. In IEEE Power & Energy Society General Meeting (PESGM) (IEEE, 2018).
-
Tian, P. et al. A hierarchical energy management system based on hierarchical optimization for microgrid community economic operation. IEEE Trans. Smart Grid. 7 (5), 2230–2241 (2015).
-
Farzin, H., Fotuhi-Firuzabad, M. & Moeini-Aghtaie, M. A stochastic multi-objective framework for optimal scheduling of energy storage systems in microgrids. IEEE Trans. Smart Grid. 8 (1), 117–127 (2016).
-
Wang, Z. et al. Coordinated energy management of networked microgrids in distribution systems. IEEE Trans. Smart Grid. 6 (1), 45–53 (2014).
-
Wang, Z., Chen, B. & Wang, J. Decentralized energy management system for networked microgrids in grid-connected and islanded modes. IEEE Trans. Smart Grid. 7 (2), 1097–1105 (2015).
-
Moghaddam, M. P. et al. Distribution company and microgrids behaviour in energy and reserve equilibirum. In IEEE PES Asia-Pacific Power and Energy Engineering Conference (APPEEC) (IEEE, 2015).
-
Wang, J., Chen, C. & Lu, X. Guidelines for Implementing Advanced Distribution Management systems-requirements for DMS Integration with DERMS and Microgrids (Argonne National Lab. (ANL), 2015).
-
Argyrou, M. C., Christodoulides, P. & Kalogirou, S. A. Energy storage for electricity generation and related processes: technologies appraisal and grid scale applications. Renew. Sustain. Energy Rev. 94, 804–821 (2018).
-
Bui, V. H., Hussain, A. & Kim, H. M. Double deep $ Q $-learning-based distributed operation of battery energy storage system considering uncertainties. IEEE Trans. Smart Grid. 11 (1), 457–469 (2019).
-
Sedighizadeh, M. et al. Stochastic multi-objective economic-environmental energy and reserve scheduling of microgrids considering battery energy storage system. Int. J. Electr. Power Energy Syst. 106, 1–16 (2019).
-
Shi, Y. et al. A convex cycle-based degradation model for battery energy storage planning and operation. In 2018 Annual American control conference (ACC) (IEEE, 2018).
-
Bordin, C. et al. A linear programming approach for battery degradation analysis and optimization in offgrid power systems with solar energy integration. Renew. Energy. 101, 417–430 (2017).
-
Contreras-Ocana, J. E., Ortega-Vazquez, M. A. & Zhang, B. Participation of an energy storage aggregator in electricity markets. IEEE Trans. Smart Grid. 10 (2), 1171–1183 (2017).
-
Koller, M. et al. Defining a degradation cost function for optimal control of a battery energy storage system. In IEEE Grenoble Conference (IEEE, 2013).
-
Cardoso, G. et al. Battery aging in multi-energy microgrid design using mixed integer linear programming. Appl. Energy. 231, 1059–1069 (2018).
-
Alsaidan, I., Khodaei, A. & Gao, W. A comprehensive battery energy storage optimal sizing model for microgrid applications. IEEE Trans. Power Syst. 33 (4), 3968–3980 (2017).
-
Schmalstieg, J. et al. From accelerated aging tests to a lifetime prediction model: Analyzing lithium-ion batteries. In 2013 World Electric Vehicle Symposium and Exhibition (EVS27) (IEEE, 2013).
-
Wikner, E. & Thiringer, T. Extending battery lifetime by avoiding high SOC. Appl. Sci. 8 (10), 1825 (2018).
-
Ortega-Vazquez, M. A. Optimal scheduling of electric vehicle charging and vehicle�to�grid services at household level including battery degradation and price uncertainty. IET Generation Transmission Distribution. 8 (6), 1007–1016 (2014).
-
Wang, J. et al. Degradation of lithium ion batteries employing graphite negatives and nickel–cobalt–manganese oxide + spinel manganese oxide positives: part 1, aging mechanisms and life Estimation. J. Power Sources. 269, 937–948 (2014).
-
Kim, S. et al. Contractual framework for the devolution of system balancing responsibility from the transmission system operator to distribution system operators. (2017).
-
Bozorg, M. et al. Influencing the bulk power system reserve by dispatching power distribution networks using local energy storage. Electr. Power Syst. Res. 163, 270–279 (2018).
-
Norwood, Z. et al. A Geospatial comparison of distributed solar heat and power in Europe and the US. PloS One. 9 (12), e112442 (2014).
-
Baran, M. E. & Wu, F. F. Network reconfiguration in distribution systems for loss reduction and load balancing. IEEE Trans. Power Delivery. 4 (2), 1401–1407 (2002).
Author information
Authors and Affiliations
Contributions
Abdul Aziz, Wajid Khan, Muhammad Zain Yousaf: Conceptualization, Methodology, Software, Visualization, Investigation, Writing- Original draft preparation. Mustafa Abdullah, Romaisa Shamshad Khan: Data curation, Validation, Supervision, Resources, Writing – Review & Editing. Umar Farooq, Mohammad Shabaz: Project administration, Supervision, Resources, Writing – Review & Editing.
Corresponding authors
Ethics declarations
Competing interests
The authors declare no competing interests.
Additional information
Publisher’s note
Springer Nature remains neutral with regard to jurisdictional claims in published maps and institutional affiliations.
Rights and permissions
Open Access This article is licensed under a Creative Commons Attribution-NonCommercial-NoDerivatives 4.0 International License, which permits any non-commercial use, sharing, distribution and reproduction in any medium or format, as long as you give appropriate credit to the original author(s) and the source, provide a link to the Creative Commons licence, and indicate if you modified the licensed material. You do not have permission under this licence to share adapted material derived from this article or parts of it. The images or other third party material in this article are included in the article’s Creative Commons licence, unless indicated otherwise in a credit line to the material. If material is not included in the article’s Creative Commons licence and your intended use is not permitted by statutory regulation or exceeds the permitted use, you will need to obtain permission directly from the copyright holder. To view a copy of this licence, visit http://creativecommons.org/licenses/by-nc-nd/4.0/.
About this article
Cite this article
Aziz, A., Khan, W., Yousaf, M.Z. et al. Integrated energy scheduling for grid-connected microgrids using battery degradation-aware optimization and coordinated control strategies.
Sci Rep 15, 44033 (2025). https://doi.org/10.1038/s41598-025-28469-6
-
Received: 14 June 2025
-
Accepted: 11 November 2025
-
Published: 18 December 2025
-
Version of record: 18 December 2025
-
DOI: https://doi.org/10.1038/s41598-025-28469-6
Keywords


