Interesting Chart: How Much Solar or Wind Dominate Renewable Energy in Different Countries
September 22, 2024
Sign up for daily news updates from CleanTechnica on email. Or follow us on Google News!
I was going through the new Integrating Solar and Wind: Global experience and emerging challenges report from the International Energy Agency (IEA), and I noticed an interesting graph. Well, there are at least a few interesting charts, but this one chart is something I don’t think I’ve ever seen.
The chart (above and below) shows three core things for a handful of selected markets in the year 2023 compared to the year 2018. It shows 1) the electricity generation share in those markets (all countries except in the case of California) that is coming from solar PV power, 2) the electricity generation share in those markets that is coming from wind power, and, here’s the new one: 3) the degree to which these systems’ renewable energy systems are more solar dominated or more wind dominated.
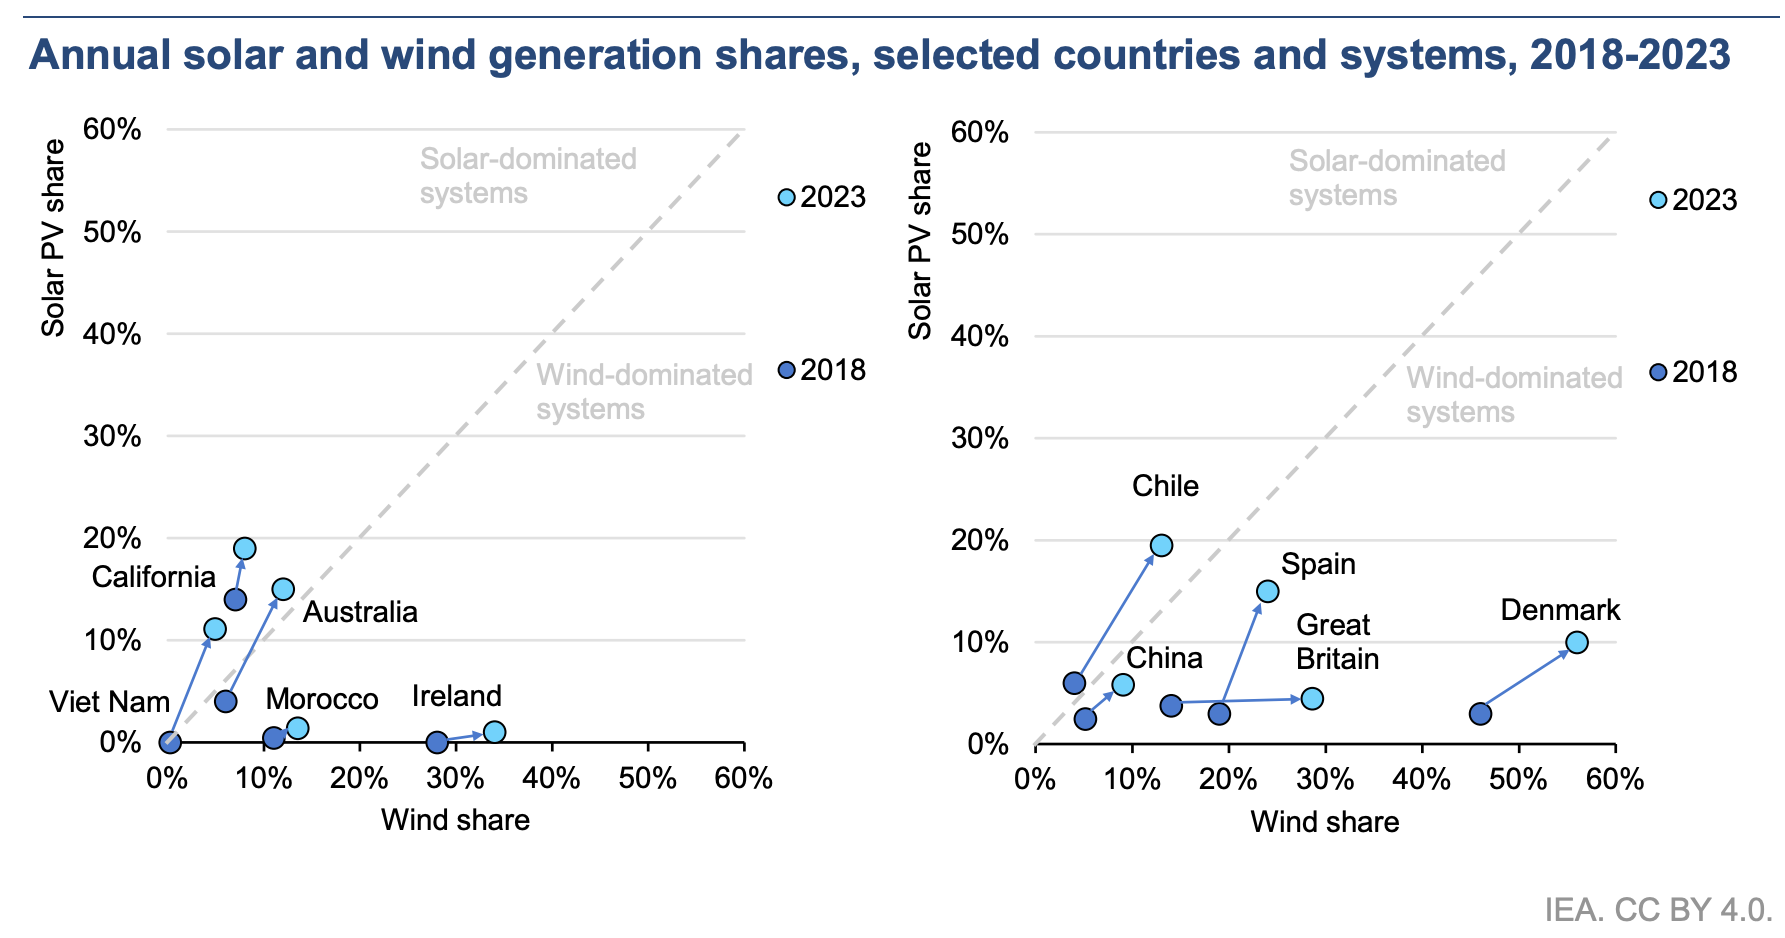
Some markets — like California, Vietnam, Australia, and Chile — have gotten more solar dominated. Other markets have gotten more wind dominated — like Great Britain (extremely so), Denmark (slightly so, but it’s already extremely wind dominated), and Ireland. The latter are getting a boost from the growing offshore wind market.
China, funny enough, is almost evenly split between solar generation and wind generation and that has not changed. What may surprise some is how low the shares of both are despite such extremely large-scale deployments of solar and wind in China. That just shows how large the energy market there is and how much the country is still installing and using fossil fuel power sources.
Of course, these are notable markets that have seen growth in electricity market share of solar and wind. So, progress is relative here, and due to its size, China is more typically compared to the European Union and United States. California, another relative large economy, doesn’t have the most dramatic growth in renewable generation share either.
In a separate chart (below), we get combined annual solar and wind electricity generation share for some of these markets, as well as their maximum hourly generation share.
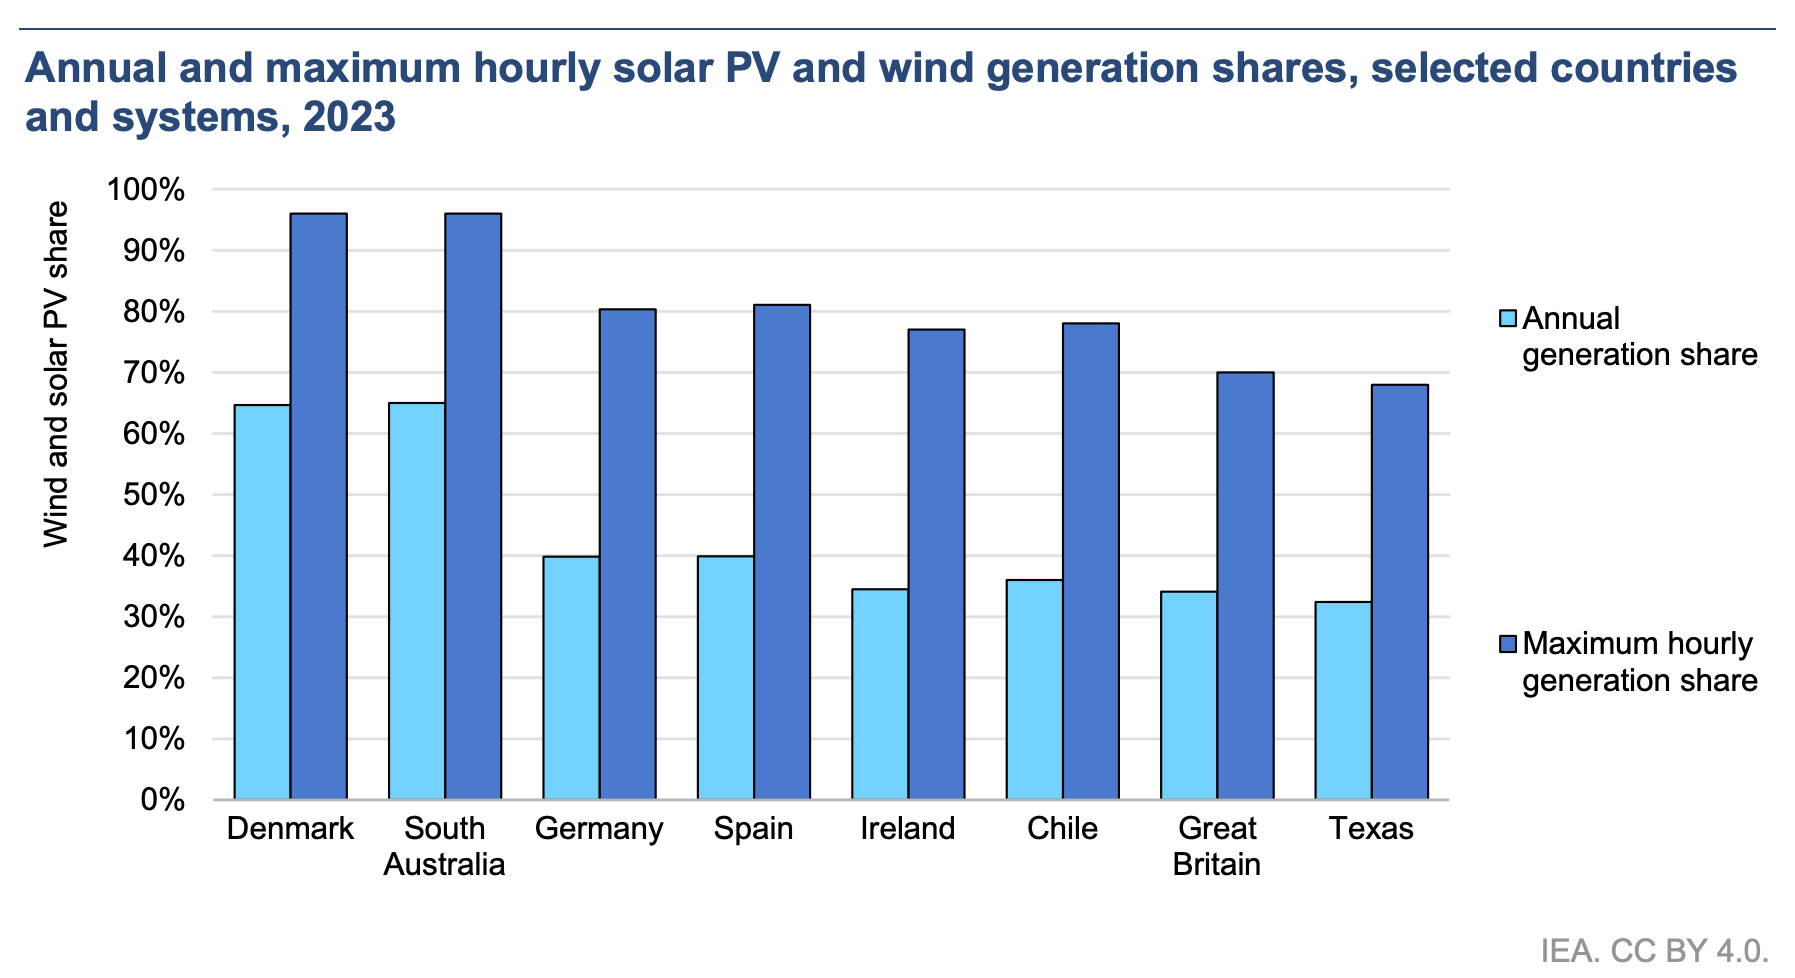
I find it a bit funny, and surprising, that Texas and Great Britain are so similar here, and also that Germany and Spain are and Denmark and South Australia are.
One thing all of this shows is there are many ways to grow a renewable energy grid, and different countries can lean on wind or solar to different extents in order to retire fossil fuel power plants. Naturally, wind and solar are complementary, so every country and state should use some mixture of both. Also, any markets just getting rolling on this now have several great examples of how to do it, and they’ve got the lessons learned and identified best practices from these places to help them avoid hurdles, pitfalls, and distracting challenges.
“[Variable renewable energy] is becoming central to the operation of power systems in many countries and regions,” the IEA notes. “In South Australia, while in 2018 VRE provided less than 50% of total generation in roughly half of the year, by 2023 VRE generation provided at least 70% of the region’s total generation during half of the year. In another example, Germany’s power grid operated with hourly VRE shares below 30% for most of 2018. By 2023 almost 70% of the year saw a VRE share above 30%. Many other systems around the world have seen similar transitions.” Indeed. Now let’s just speed it all up.
There are some other interesting charts in the report as well.
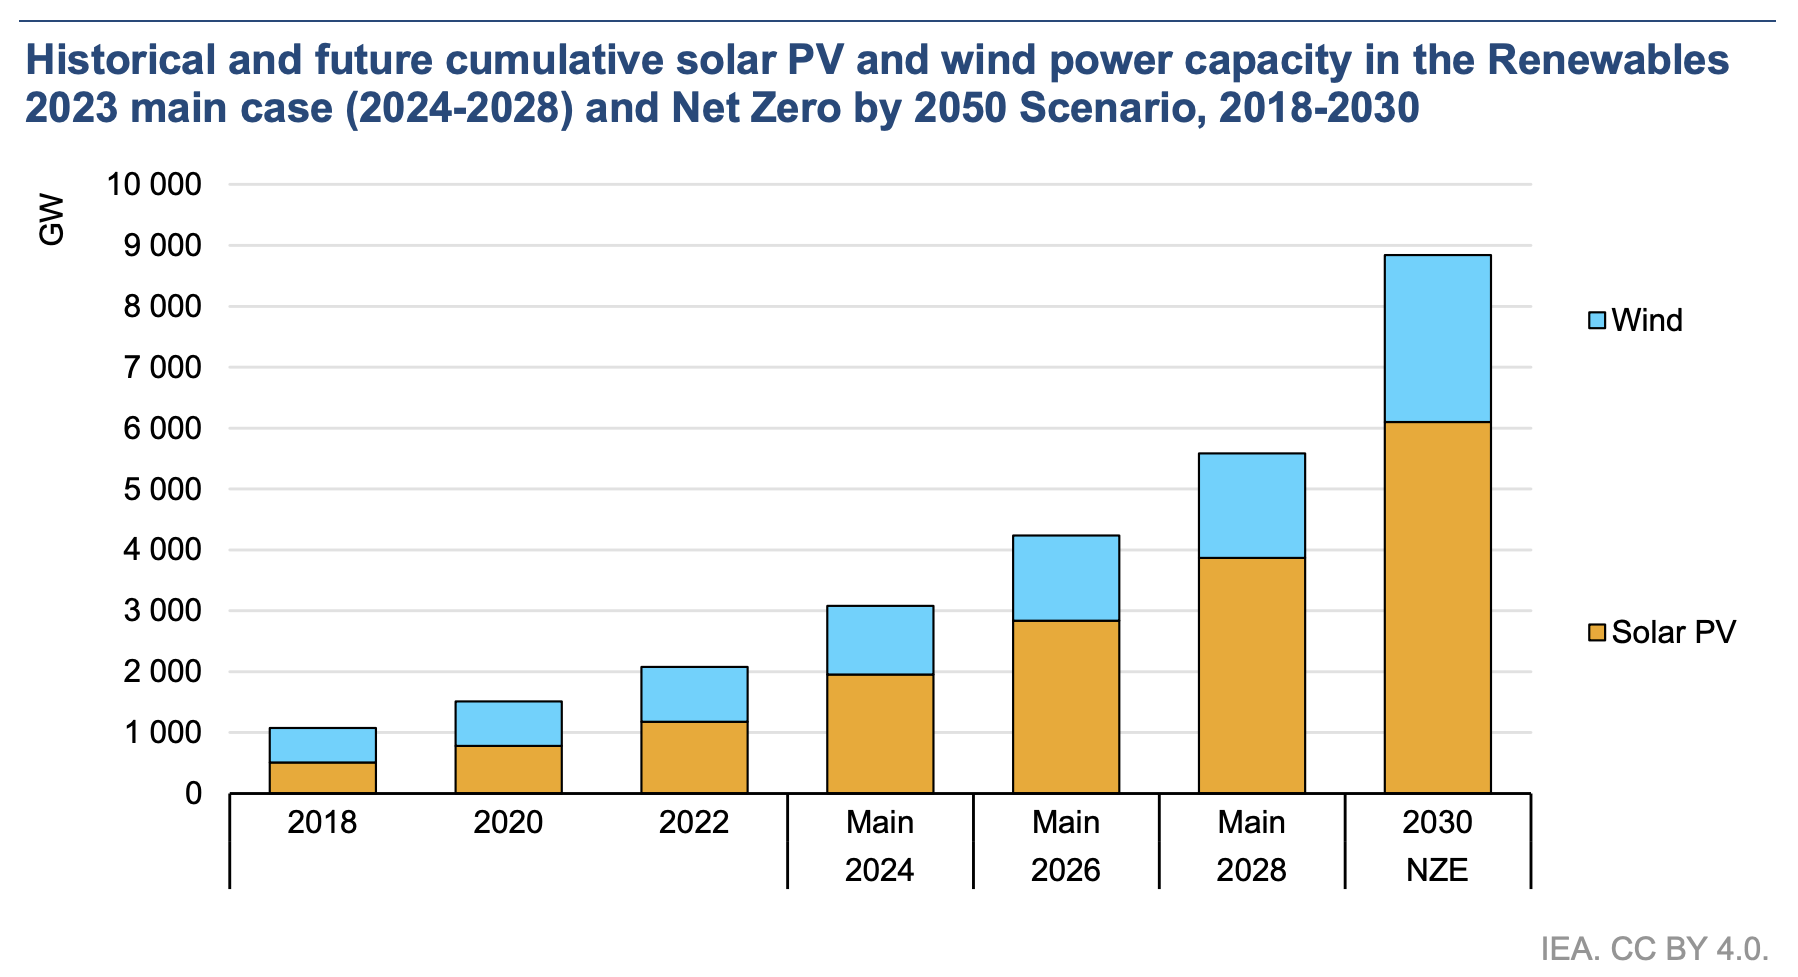
What’s interesting here? To me, two things are interesting here. For one, it’s interesting to see how much solar PV power capacity is expected to outgrow wind power capacity in the coming years. Going from 2022 to 2024, you can see much more of the bar in 2024 is coming from solar, and 2026 it’s even more so. The second thing is just how much the combined cumulative capacity of solar and wind is expected to grow in the coming 6 years. Of course, to some extent, we’ve seen this story repeatedly, so it’s not a surprise, but it’s still great to visualize and see.
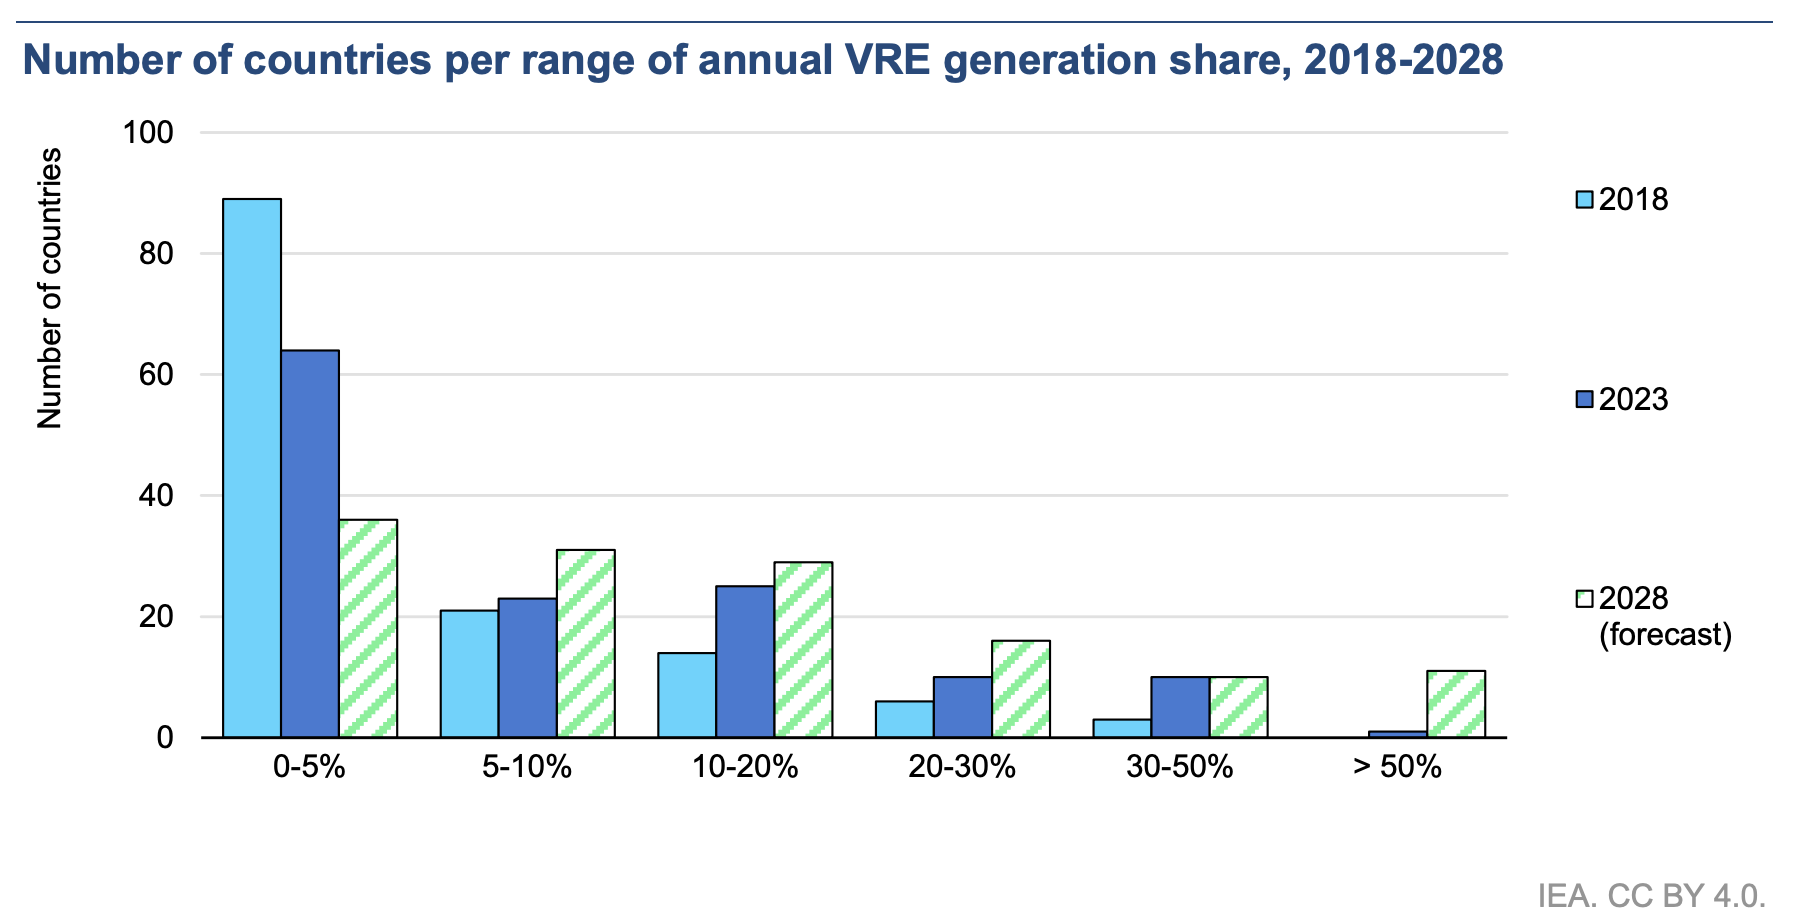
It’s a little hard to make use of this one, but there’s one big general point and it’s a little fun getting lost in each segment of the chart. In short, more and more countries are getting a higher and higher percentage of their electricity from solar and wind power. Here’s how the IEA leads into that:
“Power systems around the world have done rapid progress on VRE uptake, and expected capacity additions are set to continue driving the contribution of VRE to new heights. From a sample of 133 countries covering 99% of global electricity generation, in 2018 only around 15 countries had an annual VRE generation share of 10% or higher — that amount of countries nearly doubled in 2023. By 2028 almost 70 countries are set to have a VRE generation share of at least 10%, whereas those with VRE shares above 30% will grow from only four in 2018 to more than 20 in 2028. This shows that higher levels of VRE penetration will not only be a reality for a select group of frontrunner systems, but a common trend for a large group of systems around the world. This highlights the speed of the transformation that electricity systems are experiencing around the world, with solar PV and wind playing a key role in this transition.” Indeed. Now let’s just speed it all up.
You can check out the whole IEA report here.

Have a tip for CleanTechnica? Want to advertise? Want to suggest a guest for our CleanTech Talk podcast? Contact us here.
Latest CleanTechnica.TV Videos

Advertisement
CleanTechnica uses affiliate links. See our policy here.
CleanTechnica’s Comment Policy
Search
RECENT PRESS RELEASES
Related Post


