Robust distribution networks reconfiguration considering the improvement of network resilience considering renewable energy resources
October 3, 2024
Abstract
The integration of renewable energy sources into smart distribution grids poses substantial challenges in maintaining grid stability, efficiency, and reliability due to their inherent variability and intermittency. This study addresses these challenges by proposing a novel two-level optimization model aimed at enhancing operational efficiency and robustness in smart distribution grids. The model synergistically integrates renewable energy sources, energy storage systems, electric vehicles, and demand-side management through a dynamic reconfiguration approach. It employs a robust optimization framework combined with a two-stage second-order cone optimization model to manage real-time operations and strategic grid reconfiguration. Key findings from simulations on the IEEE 33 and 69-bus networks underscore the model’s effectiveness. In the 33-bus system, implementing the demand response program led to a significant reduction in power losses, from 0.64 MW to 0.52 MW, and improved voltage stability, with the minimum voltage increasing from 0.970 to 0.980 p.u. Similarly, in the 69-bus system, power losses decreased from 0.85 MW to 0.79 MW, and voltage stability improved, with the minimum voltage rising from 0.962 to 0.972 p.u. The model also demonstrated reduced energy procurement needs, showcasing its impact on enhancing grid efficiency and reliability. These results highlight the model’s potential for advancing smart grid management strategies, offering significant improvements in operational performance and stability under varying demand conditions.
Background
In the dynamic landscape of modern power systems, the increasing integration of diverse energy sources and advanced management technologies has brought about a paradigm shift in how we approach electrical distribution networks. The advent of smart grid technologies has opened up new frontiers in efficiency, reliability, and sustainability. Among the various strategies being explored, smart distribution grid reconfiguration stands out as a particularly promising approach. This paper delves into an innovative model of dynamic reconfiguration in smart distribution grids, underscoring its potential to address some of the most pressing challenges in the field. The conventional objectives of distribution grid management, primarily focused on loss reduction and maintaining voltage stability, are rapidly evolving. The integration of emerging complexities such as energy storage systems, electric vehicles (EVs), demand-side management (DSM), and both renewable and conventional distributed generation resources, calls for a more nuanced and holistic approach. Recent advancements in this domain have expanded the scope of optimization to encompass not only the traditional goals but also to strategically minimize power procurement from the transmission network at distribution substations. This shift reflects a growing recognition of the need for more efficient, cost-effective, and sustainable energy distribution methods. Responding to these developments, our paper introduces a robust, dynamic reconfiguration model that leverages two-stage second-order cone optimization. This model is meticulously designed to integrate a diverse array of resources: from renewable energy sources like solar and wind to energy storage systems, electric vehicles, and demand-side management initiatives. Moreover, it accommodates fossil-fuel-based distributed generation resources, such as gas and diesel generators, recognizing their continued relevance in the current energy mix. The cornerstone of our model is its ability to optimize a multi-objective function. This function is carefully constructed to address three key goals: reducing power losses within the distribution system, decreasing the dependency on power purchases at distribution substations, and minimizing the costs associated with the curtailment of renewable energy resources. Achieving a balance among these objectives is crucial for the development of a more resilient, efficient, and sustainable distribution grid. To tackle the inherent complexities and computational challenges of this multi-objective optimization, we employ the column-and-constraint generation (C&CG) algorithm. This choice is underpinned by the algorithm’s proven efficacy in handling large-scale, complex optimization problems. The implementation of our model is carried out using the Gurobi solver, renowned for its robust performance, and the Julia programming language, known for its speed and efficiency in numerical computations. This paper addresses the dynamic reconfiguration of smart distribution grids to enhance efficiency, reliability, and sustainability. The key objectives are to reduce power losses, decrease dependency on power purchases, and minimize renewable energy curtailment costs.
Literature review
In the study referenced as1, the authors address the challenge of distribution network reconfiguration and the strategic placement of capacitors within the distribution system. They propose a solution utilizing an optimized discrete gray wolf optimization algorithm. This approach is designed to minimize various costs associated with the distribution network, including the annual energy loss cost, the investment cost for capacitors, their operation and maintenance expenses, and the costs related to switching operations. In the study denoted as2, the authors introduced a chance-constrained optimal scheduling approach for reconfiguring island microgrids. This methodology aims to minimize several key operational costs, including those associated with general operations, reliability, switch operations, and the procurement of energy. In the research presented in3, the authors tackled the challenge of stochastic reconfiguration in distribution systems, focusing on enhancing small-signal stability. They considered the complexities of correlated load patterns and the variable output of renewable distributed generation sources (DGs). To address this intricate problem, they employed an advanced evolutionary algorithm. In the study referenced as4, the authors put forth a data-driven learning algorithm designed for dynamic optimal reconfiguration in distribution networks. Notably, this algorithm aims to minimize switching operations, contributing to more efficient and streamlined network management. In the research cited as5, the authors introduced a hybrid meta-heuristic algorithm. This algorithm is specifically engineered to tackle the distribution system reconfiguration problem, with the primary goal of minimizing the total harmonic distortion across the entire network. In the study referred to as6, researchers introduced a multi-objective optimization function. This function is designed to optimize both the distribution network and the natural gas network. It leverages the reconfiguration of the distribution system with the aim of reducing the cost associated with purchasing gas for fossil fuel-based distributed generation sources. This optimization approach employs a fuzzy methodology to achieve its objectives. In the study denoted as7, researchers utilized a meta-heuristic algorithm to tackle the dynamic multi-objective reconfiguration problem. This approach specifically focused on incorporating various models of photovoltaic (PV) resources into the solution process. The research presented in8 introduces a global optimization model designed to address the reconfiguration problem in unbalanced distribution networks. The primary aim of this model is to minimize the actual power loss across the network. In9, the authors have developed a stochastic reconfiguration model for distribution systems with indeterminate loads. This model is primarily aimed at reducing both loss and operating expenses. In10, a sophisticated mixed integer nonlinear model, utilizing AC load flow and the hot start point technique, was proposed. This model, aimed at solving the distribution system reconfiguration issue, focuses on minimizing real grid power losses. It employs advanced optimization methods, specifically the particle swarm and genetic algorithms, for effective problem-solving. In the study referenced as11, a bi-level dynamic reconfiguration model was proposed. The primary objective of this model is to minimize both the operating cost of load shedding and the operating cost associated with fossil distributed energy resources. Reference12 introduces an optimal dynamic reconfiguration approach designed to enhance the efficiency of the 33-bus distribution network. This strategy aims to reduce real power losses, optimize voltage levels, decrease operating costs, and bolster network reliability. The methodology uniquely incorporates renewable resources using an adaptive modified crow search algorithm. Reference13 presents a proposed optimal dynamic reconfiguration model, designed to augment the flexibility of distribution networks during island operation. This model strategically aims to minimize total power shortages while concurrently reducing the number of switching operations. In reference14, the authors introduced a meta-heuristic algorithm tailored to address the optimal reconfiguration problem within distribution networks. This solution uniquely accounts for the uncertainties associated with fossil fuel-based distributed generation resources and the variable availability of electric vehicle parking lots over a 24-hour period. In reference15, a novel formula for the reconfiguration of the distribution network was introduced. This formula is specifically designed to mitigate voltage fluctuations induced by distributed generation resources. In study16, the authors presented a method aimed at minimizing reconfiguration switching operations. This approach takes into account the start-up requirements of fossil distributed generation resources over a 24-hour period. In reference17, the authors introduced an optimal reconfiguration model designed for both balanced and unbalanced distribution networks. The primary focus of this model is to enhance the expected energy supply and improve the voltage stability index. Notably, it takes into consideration the integration of energy storage systems and renewable energy resources. In reference18, the authors developed a stochastic model addressing the issue of distribution system reconfiguration. This model uniquely integrates transmission network optimization and market operations, aiming to effectively reduce operating costs. In study19, the researchers introduced a time-division methodology to tackle the multi-objective reconfiguration challenge in the 33-bus network. This approach utilizes an evolutionary algorithm, enabling efficient problem-solving in a structured time-segmented manner. In publication20, the researchers introduced an innovative linear scheduling model. This model is noteworthy for its precise reliability evaluation and strategies for post-fault reconfiguration in distribution networks. In reference21, a deep learning method is introduced to address the optimal reconfiguration problem. This method takes into account short-term voltage stability in the context of renewable energy resource integration. In study22, the researchers proposed an optimization framework centered on the integrated multi-time flexible fuzzy uncertain demand response model. This model serves the dual purpose of demand response management and optimal reconfiguration of distribution networks. The aim is to enhance customer satisfaction, achieved through the adaptive particle swarm optimization algorithm. In reference23, the authors introduced a probabilistic approach to distribution system reconfiguration. The objective is to enhance the capacity of photovoltaic (PV) resources, stabilize voltage, and minimize power losses. This is accomplished through the utilization of the NSGA-II algorithm and fuzzy decision-making techniques. In reference24, the authors put forth a state-based sequential network reconfiguration strategy employing the Markov decision process model. The aim is to minimize curtailment of renewable generation and reduce load under various operating constraints over a 24-hour period. In reference25, the authors introduced the problem of dynamic distribution system reconfiguration, taking into account renewable energy resources and energy storage systems. The objective is to reduce pollution costs and network switching costs. In26, the authors present an optimal coordinated strategy for demand response and energy management, incorporating electric vehicles. This strategy is based on the application of the Jaya algorithm. In27, the authors introduce a robust distributed approach utilizing mixed-integer programming for dynamic reconfiguration in three-phase unbalanced distribution networks. In28, the authors present a mixed-integer nonlinear programming model designed to address the dynamic reconfiguration challenge in distribution networks. The objective is to minimize the cost of purchasing energy from the upstream network while considering the integration of renewable resources, batteries, and demand-side management programs. In29, the authors introduce an integer quadratic conic programming model tailored for the multi-objective dynamic reconfiguration of urban distribution networks. This model uniquely incorporates multi-level switching modes and the integration of photovoltaic resources. In30, the authors put forward a stochastic mixed-integer linear programming model designed for the optimal charging and discharging of batteries, coupled with demand-side management, within smart distribution substations. In31, the authors introduce a comprehensive approach for optimizing distribution networks by incorporating fossil distributed generation resources, PV resources, and reactive resources to minimize real power losses. References32] and [33 have developed an algorithm to solve two-stage integer robust problems. In34, robust energy management for microgrids with island operation is proposed. In35, a resilient restoration strategy is proposed for multi-energy distribution systems, coordinating multi-stage dispatch decisions in a distributed manner. In36, a phase measurement-based model is proposed for the reconfiguration of distribution networks with limited defense, aimed at enhancing physical cybersecurity. The study37 proposes a Cloud-Edge collaboration solution for distribution network reconfiguration using multi-agent deep reinforcement learning. In38, a two-level service recovery problem is presented, focusing on identifying a suitable reconfigurable network to serve loads while considering a fault affecting some components. In the study39, the authors suggest bidirectional inhibition of a step voltage regulator in reconfigurable active distribution networks by adjusting one tap. Reference40 reviews and outlines the incorporation of various technologies, including artificial intelligence, wireless sensor networks (WSN), the Internet of Things (IoT), cloud computing, blockchain, computational algorithms, machine learning techniques, and communication protocols. Reference41 presents a resilient multi-objective optimal design for an island hybrid system that incorporates renewable energy sources along with fixed and mobile diesel energy storage systems. Reference42 introduces an optimal risk-based recommendation strategy for smart electric vehicle parking that utilizes IGDT and is centered on hydrogen storage solutions. Reference43 presents a strategic approach for smart load management that employs optimal electric vehicle charging within power networks through the use of an optimization algorithm. Reference44 proposes a multi-phase framework for the coordinated scheduling of grid microgrids within active distribution systems that include refueling and hydrogen charging stations. Reference45 introduces a hydrogen-based energy-efficient strategy aimed at minimizing the frequency of transmission switchings in the smart grid through a multi-phase approach. In46, hydrogen’s role in decarbonizing the electricity sector is explored through a three-stage methodology for day-ahead scheduling in energy communities, incorporating hydrogen storage and addressing uncertainties. A case study shows the method’s effectiveness in improving economic and self-sufficiency outcomes. In47, an energy hub management model is developed for residential, commercial, and industrial hubs, incorporating demand response programs and AC optimal power flow constraints. Results show coordinated operation reduces costs, power losses, and emissions, demonstrating superior performance. In48, a four-layer optimization model is proposed for managing network congestion in Distribution Systems using smart prosumers. The model, tested on a 118-bus system, achieves a 46.85% reduction in DSO costs by integrating adaptive ADMM and market-based mechanisms. In49, a hierarchical framework for managing electricity, heat, and hydrogen markets in multi-energy microgrids is presented. Results show a reduction in peak-hour prices and confirm the model’s effectiveness in managing competitive multi-energy markets. In50, the use of large industrial energy hubs and mobile energy storage is analyzed for enhancing power system resilience. A stochastic model applied to a modified IEEE 24-bus system shows significant resilience improvements and effective mitigation of power interruptions. In51, the paper proposes a robust Home Energy Management model for residential applications using electric vehicle batteries. The model accounts for various uncertainties and shows effectiveness in handling unfavorable scenarios, though it may increase electricity costs by 38%. In52, a three-stage hierarchical model enhances the resilience of decentralized microgrids by addressing network outages through proactive actions, generation scheduling, and repair crew allocation. Results show significant reductions in energy not served and improvements in resilience. In53, a bi-level scheduling strategy for active distribution networks involving energy communities is developed. The strategy manages energy within communities and oversees distributed assets, with results indicating a 28% variation in incomes and a 3% change in expected profits based on robustness levels. In54, the role of demand response in local energy systems is examined, highlighting its effectiveness in managing consumption, improving reliability, and integrating renewable sources. Demand response enhances flexibility, balances supply and demand, and supports grid stability. In55, a three-stage mechanism for flexible energy management of social microgrids based on renewable energies with high penetration of smart homes and electric vehicles is proposed. In56, a bi-level model of joint optimization of battery storage investment and network expansion in integrated energy systems is proposed. In57, a three-layer stochastic framework for power market management in a smart community in the presence of energy storage systems is presented. In58, a two-stage optimal mechanism for managing energy markets and ancillary services in renewable energy-based transmission and distribution networks with electric vehicle participants and demand response is proposed. In59, a two-level model is proposed for the integration of energy management of independent smart grids in electricity market operations. In60, a distance-based nested optimization framework is proposed to obtain flexibility from smart buildings and electric vehicle fleets in TSO-DSO coordination. In61, a three-layer game theory-based strategy for optimal scheduling of microgrids using a dynamic demand response scheduler is proposed to unlock the potential of smart buildings and electric vehicle fleets. In62, a two-level mechanism for decentralized coordination of Internet data centers and energy communities in local congestion management markets is proposed. In63, an alternating direction method of a robust optimization framework with multiple capabilities is proposed for self-healing planning of smart grids integrated with smart clients. In64, a decentralized two-level strategy for environmental planning of multi-energy communities in local electricity and natural gas markets is proposed, taking into account the carbon tax. To provide a clear understanding of how this paper differs from previous research, a detailed taxonomy table is included. As illustrated in Table 1, the study compares its model and methodology with those in earlier publications. The comparison reveals that each referenced study has certain limitations, which this paper aims to address. For example, in reference1, demand side management modeling is overlooked, and the presented nonlinear model relies on an evolutionary algorithm for its solution. Recent literature underscores that reconfiguration is a crucial optimization challenge in distribution networks, and obtaining an exact solution can yield significant benefits for the network. While previous studies have explored various optimization algorithms for distribution network reconfiguration, our approach uniquely integrates multiple energy resources and employs a robust two-stage second-order cone optimization model.
Motivation
The motivation behind this research is driven by the transformative changes occurring in the electricity distribution sector, particularly with the advent of smart grid technologies. The rise of renewable energy sources, energy storage systems, and electric vehicles (EVs) is reshaping traditional electrical distribution paradigms, necessitating a fundamental reevaluation of grid management strategies. As the integration of these technologies grows, distribution grids face unprecedented challenges in maintaining efficiency, reliability, and sustainability.
Addressing emerging challenges
A primary motivation for this research is the pressing need to tackle the complexities associated with the increasing penetration of distributed energy resources. The variability and intermittency of renewable energy sources, combined with the dynamic nature of EV charging and energy storage, complicate the management of power flow and grid stability. Traditional grid management techniques are insufficient for addressing these new challenges, necessitating the development of advanced optimization strategies that can adapt to real-time conditions and uncertainties.
Identifying gaps in existing literature
Existing literature has predominantly focused on static or simplified models of grid management, often overlooking the dynamic and multi-faceted nature of modern energy systems. While some approaches address aspects of grid optimization, they frequently fail to integrate the full spectrum of emerging technologies and their interactions. This research aims to bridge this gap by introducing a two-level optimization model that incorporates not only renewable energy and storage but also EVs and demand-side management (DSM) strategies, offering a comprehensive approach to grid reconfiguration.
Enhancing operational efficiency and resilience
A key objective of this study is to enhance operational efficiency and grid resilience through improved loss reduction and voltage stability. As distribution grids become more complex, maintaining optimal performance requires innovative solutions that can dynamically adjust to varying conditions. By employing a robust optimization framework and a two-stage second-order cone optimization model, this research addresses the need for advanced computational tools capable of solving complex optimization problems in smart grid environments.
Minimizing dependency on centralized power generation
Reducing reliance on centralized power generation and minimizing power procurement from transmission networks are crucial for promoting a decentralized and resilient energy system. This research contributes to this goal by optimizing grid performance in a way that decreases energy purchased from external sources, thereby supporting a more sustainable and self-reliant distribution network.
Practical implications and real-world applicability
The practical implications of this research are underscored by its focus on real-world applicability. By analyzing the IEEE 33-bus and 69-bus networks and employing day-ahead scheduling with a detailed 24-hour load curve, the study not only demonstrates the theoretical benefits of the proposed model but also validates its effectiveness in practical scenarios. This validation is crucial for ensuring that the developed solutions are not only theoretically sound but also feasible and beneficial for actual distribution network operations.
In summary, this research is motivated by the need to address the evolving challenges in smart grid management, fill gaps in existing methodologies, and provide practical, actionable solutions for enhancing the efficiency, reliability, and sustainability of modern distribution networks. The proposed model represents a significant advancement in grid optimization, offering a comprehensive approach that integrates emerging technologies and addresses the complexities of contemporary energy systems.
Research gap
Despite significant advancements in smart distribution grid reconfiguration and the integration of renewable energy resources, electric vehicles (EVs), and demand-side management (DSM), several critical gaps remain in current research:
Comprehensive optimization models
-
Gap: Existing studies often focus on optimizing specific aspects such as loss reduction and voltage stability but lack comprehensive models that simultaneously minimize power procurement from the transmission network. This aspect is crucial for enhancing the self-sufficiency and economic efficiency of distribution networks.
-
Solution: This study introduces a comprehensive two-level optimization model that integrates various energy resources and strategies to optimize a multi-objective function. The model addresses both operational costs and the strategic reconfiguration of the grid, ensuring a holistic approach to grid management.
Integration of diverse energy resources
-
Gap: Most models do not adequately handle the complexities introduced by the combination of renewable energy resources, energy storage systems, EVs, and conventional distributed generation (DG) resources such as gas and diesel generators. These complexities include the dynamic nature and variability of these resources, which pose unique challenges for grid stability and efficiency.
-
-Solution: The proposed model robustly integrates renewable energy sources, energy storage systems, EVs, and demand-side management strategies. It employs advanced optimization techniques to manage these resources dynamically and in real-time, enhancing grid stability and efficiency.
Flexibility and agility in grid reconfiguration
-
Gap: The rapid integration of DSM initiatives and the decentralization of energy generation require flexible and dynamic grid reconfiguration models. Existing models often lack the agility to adapt to fast-evolving scenarios, limiting their practical applicability.
-
Solution: The model uses a dynamic reconfiguration approach that adapts to changing grid conditions and integrates DSM initiatives. This flexibility ensures the model’s practical applicability in real-world settings, making it suitable for modern, evolving energy systems.
Advanced optimization techniques
-
Gap: There is a gap in employing two-stage second-order cone optimization strategies in smart grid management. These techniques are crucial for addressing non-linear and multi-dimensional challenges in modern smart grid systems.
-
Solution: The study employs a two-stage second-order cone optimization model, providing accurate and efficient solutions for complex, multi-objective problems. This advanced technique enhances the model’s ability to manage the non-linear dynamics of smart grids.
Efficient computational algorithms
-
Gap: Many studies do not utilize advanced computational algorithms like the column-and-constraint generation (C&CG) algorithm, which are essential for solving large-scale optimization problems efficiently.
-
Solution: The model incorporates the C&CG algorithm for efficient problem-solving, allowing it to handle the increasing scale and complexity of modern electrical distribution networks effectively.
Practical validation
-
Gap: There is a significant gap in the practical validation and implementation of theoretical models. Empirical studies demonstrating these models’ effectiveness and feasibility in real-world scenarios are needed.
-
Solution: This study validates the proposed model through simulations on the IEEE 33-bus network, demonstrating its effectiveness in day-ahead scheduling and real-time operations. The practical implementation and validation highlight the model’s applicability and feasibility in addressing current and future challenges of smart distribution grid management.
By addressing these gaps, the study bridges the existing research gaps and advances the field of smart distribution grid reconfiguration, providing a robust, flexible, and practically validated model for modern energy systems.
Contribution
The research presented in this paper makes significant contributions to the field of smart distribution grid reconfiguration, introducing several innovative aspects that enhance the efficiency and stability of these systems. The key contributions and innovations of this study are outlined as follows:
Comprehensive two-level optimization model
Enhanced Novelty: The integration of renewable energy sources, energy storage systems, electric vehicles, demand-side management, and conventional distributed generation within a single model is a pioneering approach. This model not only addresses the inherent variability and complexity of modern grids but also provides a unified framework for managing diverse energy resources, which is a significant advancement over existing methods.
Advanced two-stage second-order cone optimization
Detailed Novelty: The adoption of a two-stage second-order cone optimization technique is innovative as it extends traditional convex optimization methods to address the non-linear and complex constraints typical of smart grids. This approach improves solution accuracy and computational efficiency, offering a more robust solution to multi-dimensional grid management problems.
Multi-objective function optimization
Clarified Novelty: The development of a multi-objective function that concurrently reduces power losses, minimizes procurement costs, and curtails renewable energy waste represents a novel approach to balancing multiple grid management goals. This integrated optimization framework offers a more comprehensive solution to the multifaceted challenges of smart grid operations.
Column-and-constraint generation (C&CG) algorithm
Detailed Novelty: Utilizing the C&CG algorithm is innovative in the context of large-scale optimization for smart grids. This algorithm is particularly effective in managing the high dimensionality and complexity of the problem, offering a scalable solution that traditional methods may struggle to handle.
Practical implementation and validation
Expanded Novelty: Implementing the model with the Gurobi solver and Julia programming language, and validating it through simulations on the IEEE 33 and 69-bus networks demonstrate a robust practical application. The use of these advanced tools ensures that the model is not only theoretically sound but also applicable in real-world scenarios, bridging the gap between theoretical advancements and practical utility.
Enhanced grid stability and cost-effectiveness
Clarified Novelty: By optimizing multiple objectives and integrating a wide range of energy resources, the model addresses both stability and economic efficiency. This approach provides a more resilient and cost-effective solution, which is a notable advancement over existing methods that may not fully integrate or optimize such diverse elements.
In summary, this paper’s contributions lie in its innovative approach to integrating diverse energy resources, employing advanced optimization techniques, utilizing efficient computational algorithms, and validating the model in practical scenarios. These contributions advance the state-of-the-art in smart distribution grid management, offering robust solutions for current and future energy systems.
Figure 1 provides a graphical abstract that encapsulates the core elements of this study on smart distribution grid reconfiguration. The figure is divided into four main sections, each represented by distinct geometric shapes and colors for clarity and emphasis. The Problem section, outlines the primary challenges addressed in this research, including issues related to grid efficiency, reliability, and sustainability arising from the integration of diverse energy resources. The Objectives section, enumerates the study’s goals: reducing power losses, decreasing dependency on power purchases, and minimizing renewable energy curtailment costs. The Approach section, describes the methodological framework employed in this research. This includes the implementation of a two-stage second-order cone optimization model, the integration of renewable energy sources, energy storage systems, electric vehicles, and demand-side management, as well as the utilization of a robust dynamic reconfiguration model. Finally, the Results section, highlights the outcomes of the study, which demonstrate enhanced operational efficiency, improved voltage stability, and optimized energy procurement in the smart distribution grid.
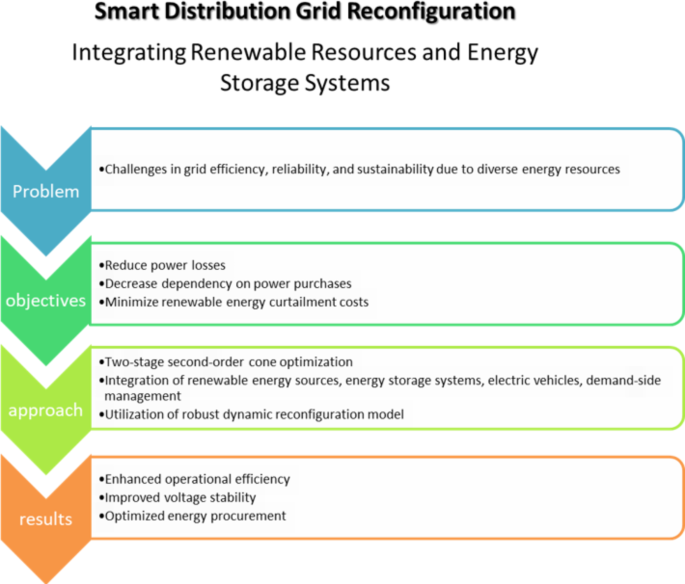
Smart distribution grid reconfiguration – integrating renewable resources and energy storage systems.
In the subsequent section of this paper, we will delve into a comprehensive presentation and detailed description of the proposed model. Following that, the third segment will introduce the proposed system, and the ensuing analysis will scrutinize the results obtained from the simulation. The fourth section will encapsulate the conclusion of the paper, and to further this study, several insightful suggestions will be presented.
Methods
The paper presents a dynamic smart grid reconfiguration problem, structured as a second-order cone optimization model, encompassing Eq. (1) to (29). The crux of this model, as outlined in Eq. (1), is a multi-faceted objective function with three key objectives: Firstly, it aims to diminish power loss in network lines, expressed as ({{c}^{l}r}_{b}left({p}_{b,h}^{2}+{p}_{b,h}^{2}right)). Secondly, it endeavors to curtail the costs incurred from electricity acquisition at distribution substations, symbolized by ({c}^{s}left({p}_{h}^{s}+{q}_{h}^{s}right)). Thirdly, minimizing the vulnerability of the system caused by the interruption of the real and reactive load shown by ({c}^{r}left({p}_{n,h}^{r}+{q}_{n,h}^{r}right)). The model delineates various sets within its scope: network buses ((N)), time periods ((H)), and grid lines ((B)), with respective indices (n), (h), (b).
The objective functions of the proposed model are designed to address key challenges in smart distribution grid management, ensuring a comprehensive and efficient optimization approach. Firstly, the model aims to minimize power losses within the distribution network. Power losses occur due to the inherent resistance of electrical components and conductors, which leads to energy dissipation as heat. Reducing these losses is critical for enhancing the overall efficiency of the grid, resulting in significant cost savings and reduced energy waste. By focusing on power loss minimization, the model contributes to a more efficient and sustainable grid operation. Secondly, the model seeks to minimize the power procurement costs from the transmission network at distribution substations. Procuring power from the transmission network can be expensive, especially during peak demand periods. This objective encourages the optimal use of local generation and storage resources, thereby reducing reliance on external power sources and lowering associated costs. This approach not only enhances economic efficiency but also promotes energy independence at the distribution level. Another key objective is to minimize the cost associated with curtailing renewable energy resources. Curtailment of renewable energy occurs when the generation from sources like wind and solar exceeds the grid’s capacity to absorb it. This leads to wasted resources and missed opportunities for utilizing clean energy. By minimizing curtailment costs, the model ensures that renewable energy is used more effectively, contributing to sustainability and reducing overall energy expenses. The model integrates these objectives into a multi-objective optimization framework, balancing the various goals to achieve an efficient and resilient grid operation. This comprehensive approach ensures that all critical aspects of grid management, including power loss reduction, cost minimization, and effective utilization of renewable energy, are addressed simultaneously. The advanced optimization techniques employed in the model, such as the two-stage second-order cone optimization and the column-and-constraint generation (C&CG) algorithm, enhance the accuracy and efficiency of the solutions, making the model well-suited for the complexities of modern smart grids. In summary, the objective functions of the proposed model are designed to optimize multiple facets of grid management, ensuring enhanced efficiency, economic viability, and sustainability. By addressing power losses, power procurement costs, and renewable energy curtailment, the model offers a robust solution to the challenges faced by contemporary smart distribution grids.
In Eq. (1), the variable ({r}_{b}) is defined as the resistance of line (b) in the network. The terms ({p}_{b}) and ({q}_{b}) are used to denote the active and reactive power flows along this line, respectively. The notation ({c}^{s}) represents the cost incurred for power purchased at the distribution substation from the upstream network. This cost is associated with the active and reactive power at the substation during time h, expressed as ({p}_{h}^{s}) and ({q}_{h}^{s}). Furthermore, ({c}^{r}) is indicative of the cost related to load curtailment, where ({p}_{n,h}^{r}) and ({q}_{n,h}^{r}) respectively symbolize the active and reactive power components of the load curtailment process.
Equation (2) through (29) define the constraints relevant to the proposed optimization model. Specifically, Eq. (2) details the constraint for balancing real power, whereas Eq. (3) addresses the equilibrium of reactive power within the network. The term ({p}_{n,h}^{ev}) represents the power output from electric vehicle charging stations at the nth bus during time (h). Similarly, ({p}_{n,h}^{pv}) denotes the power generated by solar resources at the nth bus at time (h), and ({p}_{n,h}^{wd}) corresponds to the power produced by wind resources at the same bus and time. Equation (2) represents the active power balance in the distribution network, ensuring that the total active power supplied to a node, including power from renewable sources, distributed generation, energy storage, and imports from the transmission network, equals the total active power consumed, such as by demand response programs and electric vehicle charging. Similarly, Eq. (3) ensures the reactive power balance, where the total reactive power supplied to a node, including from renewable sources and distributed generation, equals the total reactive power consumed by demand response programs. These equations are fundamental for maintaining the stability and efficiency of the power grid, ensuring that supply matches demand at each node within the network.
In Eq. (2), the terms ({p}_{n,h}^{dis}) and ({p}_{n,h}^{ch}) represent the battery’s discharge and charge power at the nth bus for time h, respectively. The notation nm signifies the power flow from bus (n) to bus (m), while (mn) indicates the power flow in the opposite direction, from bus m to bus n. The real power output of fossil fuel-based distributed generation (DG) resources at the nth bus during time (h) is denoted by ({p}_{n,h}^{dg}). Additionally, ({p}_{n,h}^{dr}) specifies the active load shifted at the nth bus at time (h) within the demand side management program. Similarly, in Eq. (3), ({q}_{n,h}^{dg}) represents the reactive power of fossil DG resources at the nth bus for time (h), and ({q}_{n,h}^{dr}) denotes the reactive load shifted at the nth bus at time (h) as part of the demand side management program.
Equations (4) and (5) define the hourly operational limits for active and reactive power at the distribution substation. Here, ({bar{p}}^{s}) represents the substation’s maximum real power capacity, and ({bar{q}}^{s}) denotes its maximum reactive power capacity.
Equations (6) and (7) describe the demand side management program’s handling of active and reactive power within the network. These equations guarantee that the program does not involve load removal; instead, it permits load shifting at any bus. In these formulations, ({p}_{n,h}^{d}) and (:{q}_{n,h}^{d}) correspond to the active and reactive loads at bus n at time h, respectively.
Equations (8) and (9) establish the permissible percentage of active load shifting at each bus, which must align with the allowable threshold. In these equations, (:epsilon:) represents the allowable percentage variation in load.
Equations (10) and (11) similarly define the allowable percentage of reactive load shift, setting limits on the extent to which reactive loads can be adjusted.
Reactive Demand Response (RDR) refers to the ability of a power system to adjust the consumption patterns of end-users in real-time, based on the instantaneous demand and supply conditions. Unlike traditional demand response, which is often pre-planned and scheduled, RDR is dynamic and can react to fluctuations in energy generation and consumption as they occur. This real-time adjustment helps in balancing the grid, especially with the increasing penetration of renewable energy sources, which are inherently variable and less predictable.
In households equipped with smart meters and smart appliances, RDR can automatically adjust the operation of devices such as air conditioners, washing machines, and refrigerators based on real-time signals from the utility company. For instance, during periods of high electricity demand or low renewable generation, these appliances can be temporarily powered down or operate at lower capacities to reduce the overall load on the grid.
Industrial facilities often have significant and flexible loads that can be modulated in response to grid conditions. For example, an aluminum smelting plant can adjust its electricity consumption based on real-time pricing signals or frequency deviations. During peak demand periods, the plant can reduce its operations, and during periods of excess supply, it can increase consumption to stabilize the grid.
The charging of electric vehicles can be managed through RDR to avoid grid congestion and take advantage of renewable energy availability. EV charging stations can adjust the charging rates based on real-time grid conditions. For instance, during times of high solar or wind generation, EVs can be charged at higher rates, whereas during peak demand times, charging can be slowed down or paused.
California Independent System Operator (CAISO) has implemented demand response programs that include elements of RDR. Through automated demand response (Auto-DR) systems, CAISO can send signals to participating consumers to adjust their loads in real-time based on grid needs. This has proven effective in managing peak loads and integrating renewable energy sources.
The UK’s National Grid has adopted dynamic demand response mechanisms to help balance supply and demand. One example is the “Power Responsive” program, which encourages businesses to adjust their electricity usage in response to real-time grid signals, helping to stabilize the grid and integrate more renewable energy.
New York Independent System Operator (NYISO) has developed programs that leverage RDR to enhance grid reliability. For example, their demand response initiatives include real-time price-based programs that incentivize consumers to reduce their load during periods of high wholesale electricity prices, which are indicative of tight supply conditions.
By dynamically adjusting demand to match supply, RDR helps in maintaining grid frequency and voltage stability. RDR enables higher penetration of renewable energy sources by mitigating the variability and unpredictability of solar and wind power. Both utilities and consumers can benefit from reduced electricity costs. Utilities avoid expensive peak generation, and consumers can take advantage of lower electricity prices during off-peak times. By optimizing the use of renewable energy and reducing reliance on fossil-fuel-based peaking power plants, RDR contributes to lower greenhouse gas emissions.
Equations (12) and (13) illustrate the upper and lower limits of active and reactive power flow in network branches. In these equations, the binary variable (:{x}_{b}) determines the operational status of the grid lines: a value of 1 signifies a connected line, whereas 0 indicates a disconnected one. The terms (:{bar{p}}_{b}) and (:{bar{q}}_{b}) correspond to the maximal active and reactive power flow capacities of line (:b) in the network, respectively.
Equation (14) defines the voltage level at the network bus at a specific time, (:h), whereas Eq. (15) sets the acceptable voltage boundaries for the bus at any given time. In these formulations, (:{v}_{n,h}) denotes the voltage squared at the nth bus at the time (:h), and (:{x}_{b}) is the reactance of the (:b)-th line associated with the nth bus. Regarding Eq. (15), (:{underline{v}}_{n}) and (:{bar{v}}_{n}) represent the minimum and maximum voltage thresholds, respectively, for the nth bus.
Equations (16) and (17) specify the permissible levels of active and reactive power for fossil fuel-based distributed generation resources. Within these parameters, (:{bar{p}}_{n}^{dg}) and (:{bar{q}}_{n}^{dg}) represent the maximum allowable active and reactive power outputs, respectively, for these resources located at the nth bus.
Relations (18) to (21) outline the energy storage system’s role within the smart grid framework. Equations (18) and (19) detail the discharge and charge power of the storage system, with (:{p}_{n}^{cap}) representing the storage capacity at the nth bus. Additionally, (:{z}_{n,h}) serves as a binary variable indicating the battery’s charge or discharge status at time (:h) at bus n. Equation (20) defines the energy status within the storage at the nth bus at time h, represented by (:{e}_{n,h}^{bat}). The terms (:{eta:}_{ch}) and (:{eta:}_{dis}) correspond to the charge and discharge efficiencies of the storage system, respectively. Finally, Eq. (21) sets out the constraints on the energy capacity of the storage system at the nth bus and at time (:h).
Equation (22) to (24) outline the constraints imposed on solar and wind resources, as well as electric vehicle charging stations. These equations are designed to guarantee the proper functioning of wind and solar resources and the appropriate utilization of electric vehicle charging stations under various conditions, on any bus, and at any given time.
Equations (25) and (26) establish the connection between the flow of active and reactive power and the corresponding active and reactive power of the distribution substation.
Ultimately, Equations (27) to (29) define the radial constraints of the distribution network post-reconfiguration, utilizing the spanning tree method to ensure these constraints are met. In these equations, (:{{Omega:}}_{s}) represents the set of distribution substations, while (:{Omega:}) denotes the set of load buses. The binary variable (:{y}_{mn}) indicates the parent-child relationship between nodes: it is assigned the value of 1 if node (:n) is the parent of node (:m).
Our model integrates renewable energy sources, energy storage systems, electric vehicles, demand-side management, and fossil-fuel-based distributed generation. The following section introduces the proposed robust approach.
Proposed approach
In real-world scenarios, the operational scheduling challenge of the distribution system is tackled a day in advance, incorporating uncertainties tied to load and renewable generation. To effectively handle these uncertainties, this section presents a two-stage robust optimization model.
Uncertainty modeling
Within the framework of robust optimization, uncertainties are characterized by appropriate uncertainty sets. For the load in the distribution system, this set, denoted as ((:{U}_{D}^{p},:{U}_{D}^{q})), can be defined as follows:
Based on Eqs. (30, 31), the uncertain load fluctuates within the range (:left[{p}_{n,h}^{d}-{p}_{n,h}^{d}times:gamma:,{p}_{n,h}^{d}+{p}_{n,h}^{d}times:gamma:right]). To alter the conservativeness of the optimal solution, the parameters (:{{Gamma:}}_{text{t}}^{text{p},text{D}}) and (:{{Gamma:}}_{text{t}}^{text{q},text{D}}), known as the uncertainty budget, can be adjusted. As these values range from 0 to 24, the conservativeness of the optimal solution correspondingly increases. This also extends the duration in which the load at bus n may reach its lower or upper limits. A similar uncertainty set is applicable to renewable power generation, denoted as (({U}_{RE})):
where (:{{Gamma:}}_{text{t}}^{text{r}text{e}}) signifies the uncertainty budget allocated for renewable power generation.
Proposed two-stage robust model
Considering the defined uncertainty sets, the formulation of the two-stage robust optimization model is presented as follows:
In this model, (:x) and y are the decision variables related to operation modes. Auxiliary coefficients (:C), (:E), (:G), (:H,)(:K), (:L), (:M), and (:N), along with parameters (:a), (:b), (:c), (:h), and (:w), are integral to the robust model’s structure. The variables (:i), (:d), and (:g) capture the uncertainty in load demand and renewable generation. The proposed two-stage robust model begins with a first-stage problem that involves optimizing the energy management of Distributed Generators (DGs), Energy Storage Systems (ESS), Electric Vehicles (EV), as well as the power management of capacitors and reactors, and the tap positions of Step Voltage Regulators (SVR) and On-Load Tap Changers (OLTC). The objective is to minimize the total cost of the distribution system (DS), taking into account the worst-case scenarios. After finalizing the first-stage decisions, the model confronts the worst-case scenario for the DS under uncertainties using an inner max-min approach. This effectively tackles a resilience-focused problem, ensuring robustness against the fluctuations and uncertainties inherent in the system.
Equation (34) defines the feasible range for operational decision variables, encompassing constraints (2) through (29). The first inequality presented in (35) focuses exclusively on constraints pertinent to operational decision variables, specifically (22) and (23). The following inequality in (35) is carefully selected to express constraints (2) and (3). Finally, the last inequality in (35) succinctly represents constraints (6) and (7).
C&CG algorithm for solving two-stage RO model
The min-max-min optimization problem outlined in Eqs. (33)-(35) presents a significant challenge to commercial software packages, often proving too complex for them to solve effectively. As a result, this study employs a column-and-constraint generation (C&CG) algorithm, elaborately explained in32, to adeptly tackle the robust model proposed. The C&CG algorithm stands out for its efficiency, especially when compared to alternative methods like the Bender Decomposition (BD) algorithm33. It demonstrates enhanced capability in solving master problems that involve a larger set of variables and constraints, and it typically requires fewer iterations to do so34. A notable advantage of the C&CG algorithm is its flexibility; unlike the BD algorithm, which requires the subproblem to be linear33, the C&CG algorithm does not have this limitation32.
-
1)
Master problem (MP)
In this context, (:phi:) is utilized as an auxiliary variable, while (:vartheta:) denotes the iteration index. The main goal of the master problem is to determine the optimal first-stage decision, taking into account the worst-case scenarios identified in the sub-problem. As a result, the master problem sets a lower bound for the two-stage robust optimization model outlined in Eqs. (33)-(35).
-
2)
Sub-problem (SP)
The sub-problem is structured to identify the worst-case scenario within the defined uncertainty sets. In particular, for the optimal robust decisions from the first stage, represented as (:{x}_{t}^{*}), the formulation of the sub-problem is as follows:
In this setup, (:eta:) is used as an auxiliary variable, and (:pi:), (:gamma:), and (:omega:) function as dual variables corresponding to constraints (43)-(45), respectively. This max-min problem sets an upper bound for the two-stage robust optimization model detailed in Eqs. (33)-(35). Direct optimization of this problem is impractical due to its complexity. However, the linearity of the sub-problem enables the application of duality theory, which allows for its reformulation as follows:
Upon resolving the equivalent formulation of the sub-problem, the worst-case scenario is identified across the uncertainty sets in each iteration. Subsequently, the relevant constraints (38)-(41) are incorporated into the master problem. This iterative process continues until the gap between the upper and lower bounds reduces to an established threshold. For a visual representation of the proposed solution algorithm, please refer to Fig. 2, which contains a detailed flowchart. Figure 3 shows a flowchart of the proposed model overview.
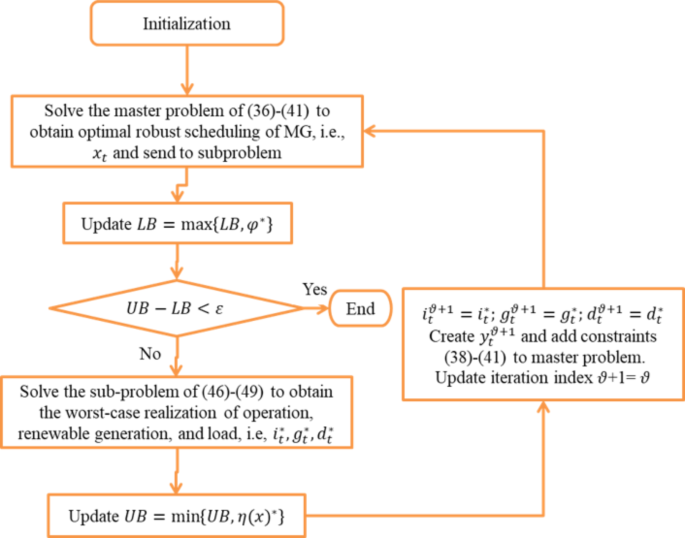
Flowchart illustrating the proposed two-stage solution algorithm.
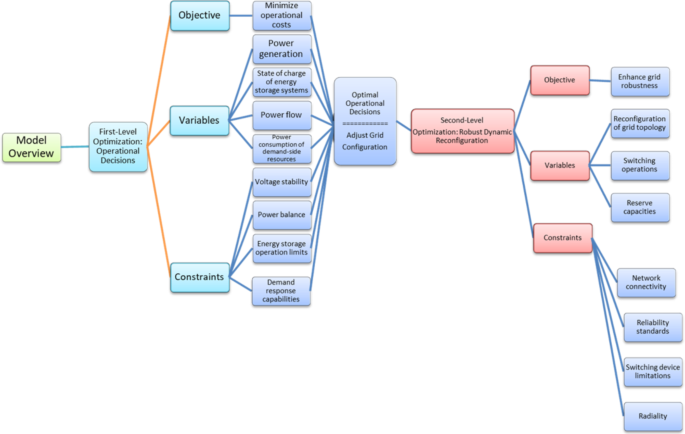
Flowchart of the proposed model overview.
The metaheuristic approach, specifically the column-and-constraint generation (C&CG) algorithm, was selected due to the complex nature of the optimization problem, which involves robust optimization and dynamic reconfiguration. Despite the time demands of metaheuristic algorithms, they are particularly effective for large-scale and intricate problems. The C&CG algorithm adeptly manages the complex constraints and objectives of our model, while the Gurobi solver and Julia programming language contribute to efficient problem-solving. This combination ensures a balance between accuracy and computational efficiency, validating our methodological choice.
Results
The performance evaluation of the proposed model was conducted using a 33 and 69-bus distribution networks. The implementation was carried out in the Julia programming language, employing the Gurobi Solver. The computational analysis was performed on a system equipped with a 1.8 GHz processor and 6 GB of RAM. This section presents the results pertaining to the 33-bus network.
The 33-bus system
The input data for the simulation includes the following specifications: As depicted in Fig. 4, lines 33 to 37, represented by dotted lines, are identified as tie lines. The network includes fossil fuel-based distributed generation (DG) units situated at buses 6, 14, and 32, each with a 2 MW capacity. Specifically, gas-fired DG units are located at buses 6 and 14, while a diesel-powered unit is placed at bus 32. Energy Storage Systems (ESS) are installed at buses 6, 14, and 32, each with a capacity of 1.5 MWh. Solar photovoltaic (PV) resources are positioned on buses 10, 20, and 28, and wind turbines (WD) are situated at buses 11, 19, and 26. Electric Vehicle (EV) charging stations are available at buses 6, 12, 17, 24, and 33. The distribution substation is located at bus 1, with a voltage level of 1 per unit (p.u.). This comprehensive definition of the input data ensures clarity and facilitates the reproducibility of our simulation results.
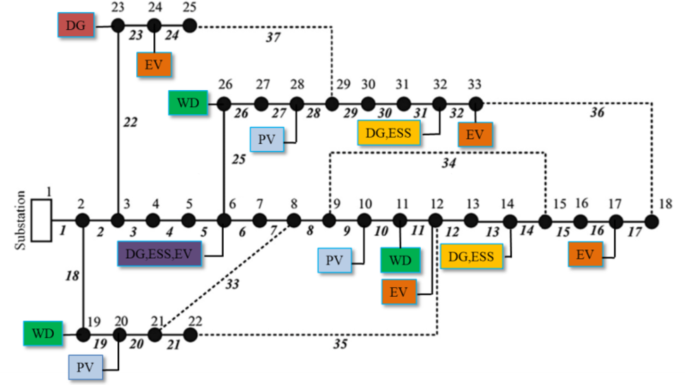
The proposed 33 bus distribution network.
The simulation outcomes are detailed in Table 1. This analysis considers various scenarios to evaluate the influence of the demand response program on the network reconfiguration issue. The cases are:
-
Case a: Operations without the demand response program.
-
Case b: Integration of the demand response program, with load variations set at 10%.
-
Case c: Application of the demand response program, featuring load changes of 15%.
-
Case d: Implementation of the demand response program, with a 20% adjustment in load levels.
Table 2 illustrates that in the first scenario, where demand side management is not implemented, the objective function values are the highest in comparison to the other scenarios. Specifically, in this case, the 24-hour power loss is 640 KW, with the minimum bus voltage being 0.97 p.u, and the maximum reaching 1.022 p.u. The lines 10, 12, 20, 24, and 25 remain open in this scenario. Notably, this case experienced no load shedding, and the total energy acquisition was 1.35 MWh. To demonstrate the impact of demand-side management on the network reconfiguration and its interaction with other network elements like batteries and fossil distributed generation resources, the second scenario incorporates a demand-side management program with a load change of 10%. The objective is to redistribute up to 10% of the load from one bus to another, enhancing the overall performance. In this scenario, the implementation of this strategy resulted in a reduction of power loss to 610 KW, indicating a 30 KW decrease in network losses due to the 10% load shift per bus. The voltage levels improved to 0.975 p.u, with lines 10, 13, 20, 24, and 32 remaining open. Significantly, this scenario also avoided load shedding, and the total energy procured was 1.3 MWh. In the third scenario, the demand-side management strategy involves shifting the load by a maximum of 15% at each bus. This increased load shifting significantly influences the reconfiguration outcomes. As a result, the network’s power loss decreased to 570 KW over a 24-hour period, and the minimum network voltage improved to 0.979 p.u. The open lines in this configuration were 10, 20, 24, 25, and 34. Importantly, similar to the previous cases, there was no occurrence of load shedding, and the total energy procurement for this scenario amounted to 1.11 MWh. In case d, each bus is capable of shifting up to 20% of its load. This scenario showcases the most efficient outcome in terms of minimizing apparent power losses when compared with other cases. Specifically, the power loss here is reduced to 520 KW, and there’s a notable improvement in voltage levels, reaching 0.98 p.u. Additionally, this scenario manages to maintain lines 10, 13, 20, 24, and 25 in an open state. A key advantage of this setup is the complete avoidance of load shedding, coupled with a total energy procurement of 1.05 MWh.
Table 2 presents the outcomes, illustrating the positive impact of both the proposed model and method on enhancing the distribution network and optimizing its performance accuracy. Moreover, the results indicate that integrating the demand-side management program with reconfiguration, energy storage systems, and distributed fossil generation resources can yield favorable outcomes.
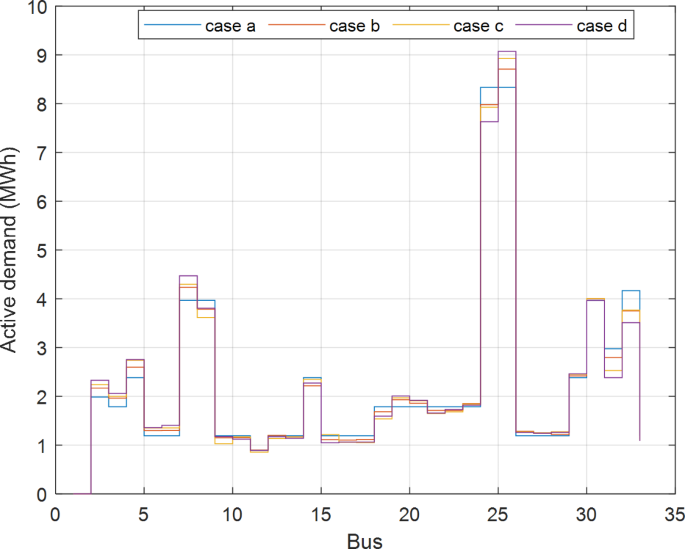
Comparison of real demand in different cases.
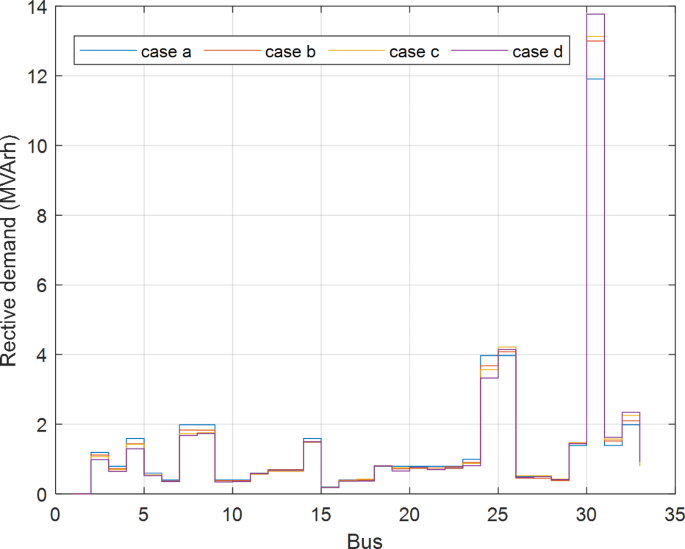
Comparison of reactive demand in different cases.
Figures 5 and 6 provide detailed visualizations of the active and reactive load dynamics across multiple scenarios, offering a clear insight into how loads are redistributed among buses. These graphical representations not only demonstrate the ongoing transfer of both active and reactive power but also underscore the reliability and stability enhancements achieved through the proposed model. In particular, ‘case d,’ highlighted distinctly in purple, exhibits the most significant load shift, illustrating the model’s ability to manage and optimize load distribution effectively. These figures serve as compelling evidence of the robustness of the integrated demand-side management approach within the overall framework, showcasing its pivotal role in improving grid flexibility and operational efficiency.
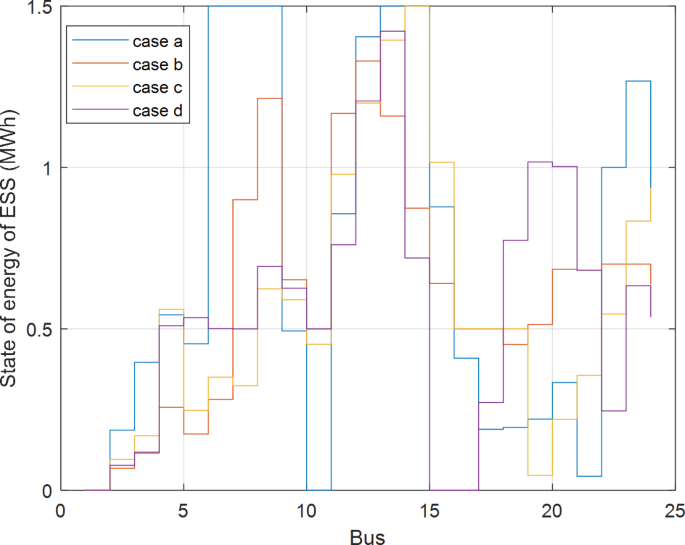
Comparison of the ESS capacity in different cases.
Figure 7 visually represents the energy levels within energy storage systems across various scenarios, emphasizing the direct correlation between load shifts and the stored energy in batteries. Additionally, this figure provides a detailed depiction of the optimal charging and discharging patterns of these storage systems. Here, negative values on the y-axis indicate charging activities, whereas positive values denote discharging operations. Furthermore, Fig. 8 complements these insights by illustrating additional aspects of the storage systems’ performance metrics. Together, Figs. 7 and 8 serve to validate the efficient functionality of energy storage systems within our model framework. These visuals not only highlight their crucial role in managing fluctuating energy demands but also underscore their contribution to enhancing grid stability and overall system resilience.
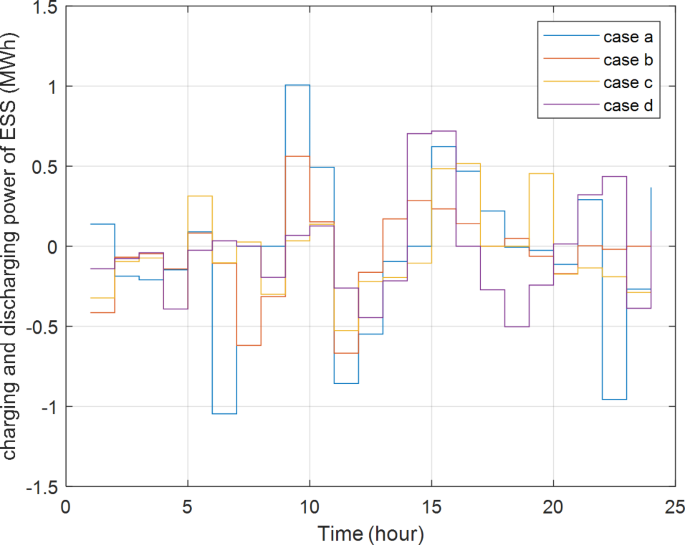
Comparison of status of charge of storage in different cases.
Figure 9 offers a comprehensive 24-hour overview of bus voltage levels, presenting the hourly voltage magnitudes at each bus across different scenarios. Each scenario, such as case ‘a’, is represented by distinct colored lines that illustrate the fluctuating voltage magnitudes at individual buses. This visualization provides a detailed snapshot of how voltage levels vary over time, offering valuable insights into the dynamic behavior of the electrical distribution system under various operational conditions.
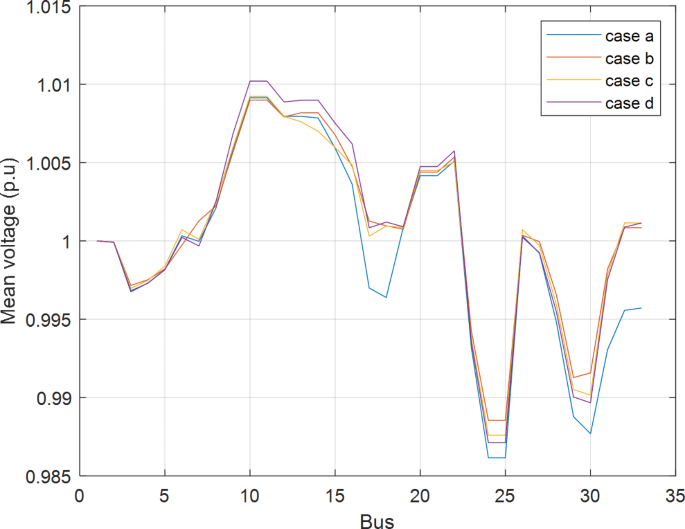
Comparison of the average voltage of the 33-bus network in different cases and at different hours.
Figures 10 and 11 present detailed graphs showing the variations in active and reactive power procurement over a full 24-hour cycle for each scenario. These visualizations offer a comprehensive view of how both active and reactive power demands fluctuate throughout the day. A significant finding from these figures is the recurring peak in energy procurement observed consistently around 20:00 h. This peak signifies a period of heightened demand or operational activity within the network, influencing both active and reactive power requirements. By highlighting these temporal patterns, Figs. 10 and 11 provide valuable insights into the system’s operational dynamics and its capacity to meet fluctuating energy demands effectively across different scenarios.
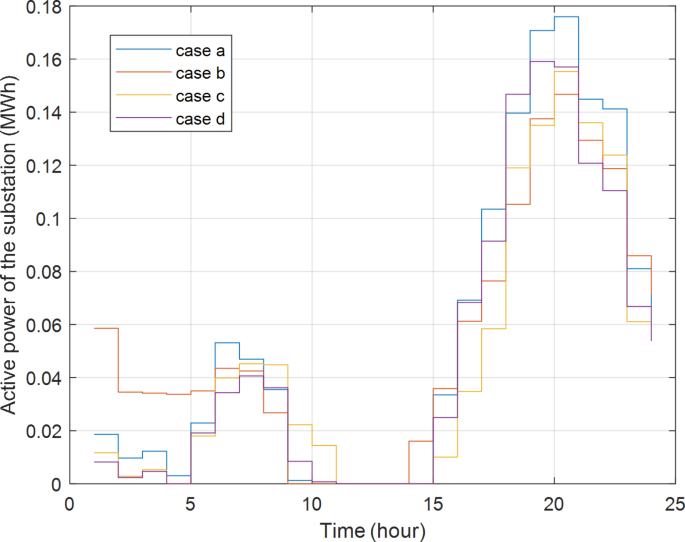
Comparative analysis of active power at the distribution substation across various scenarios.
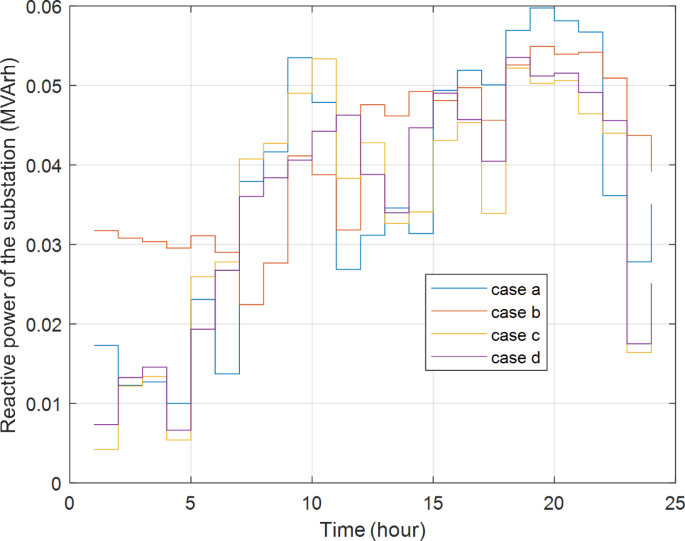
Comparative analysis of reactive power at the distribution substation across various scenarios.
Meanwhile, Fig. 12 zooms in on the output from fossil fuel-based distributed generation resources within the network, showcasing their power production over the same 24-hour period. This figure provides a detailed depiction of how hourly power generation varies across different scenarios, highlighting the unique contributions and impacts of each case. By visually representing the fluctuations in power output from these distributed generation sources, Fig. 12 underscores their role in meeting varying energy demands and maintaining grid stability throughout the day.
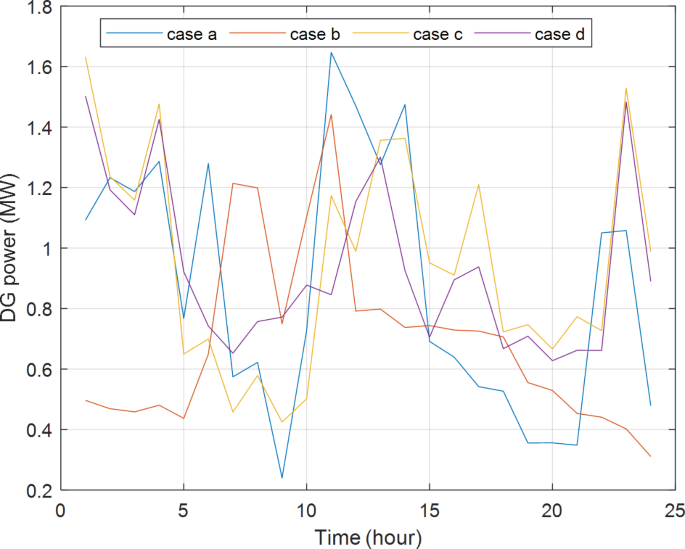
Comparative assessment of real power from fossil distributed generation resources in various scenarios.
Ultimately, Figs. 13, 14 and 15, and 16 provide visual insights into the reconfigured topology of the distribution network for each corresponding scenario. These graphical representations highlight the pivotal role of demand-side management in the context of distribution system reconfiguration. Each figure showcases a unique network topology, emphasizing the distinctiveness of every scenario’s configuration. These visuals not only illustrate the structural changes made to optimize network performance but also underscore how demand-side management influences these configurations. Moreover, the variations depicted in optimal battery charging and discharging patterns, output from fossil fuel-based distributed generation (DG) resources, and energy procurement from the substation across different scenarios further emphasize the significance of each model. These variations demonstrate the tailored approaches taken to address the challenges of optimal network reconfiguration, highlighting the diverse strategies employed to enhance system efficiency and resilience.
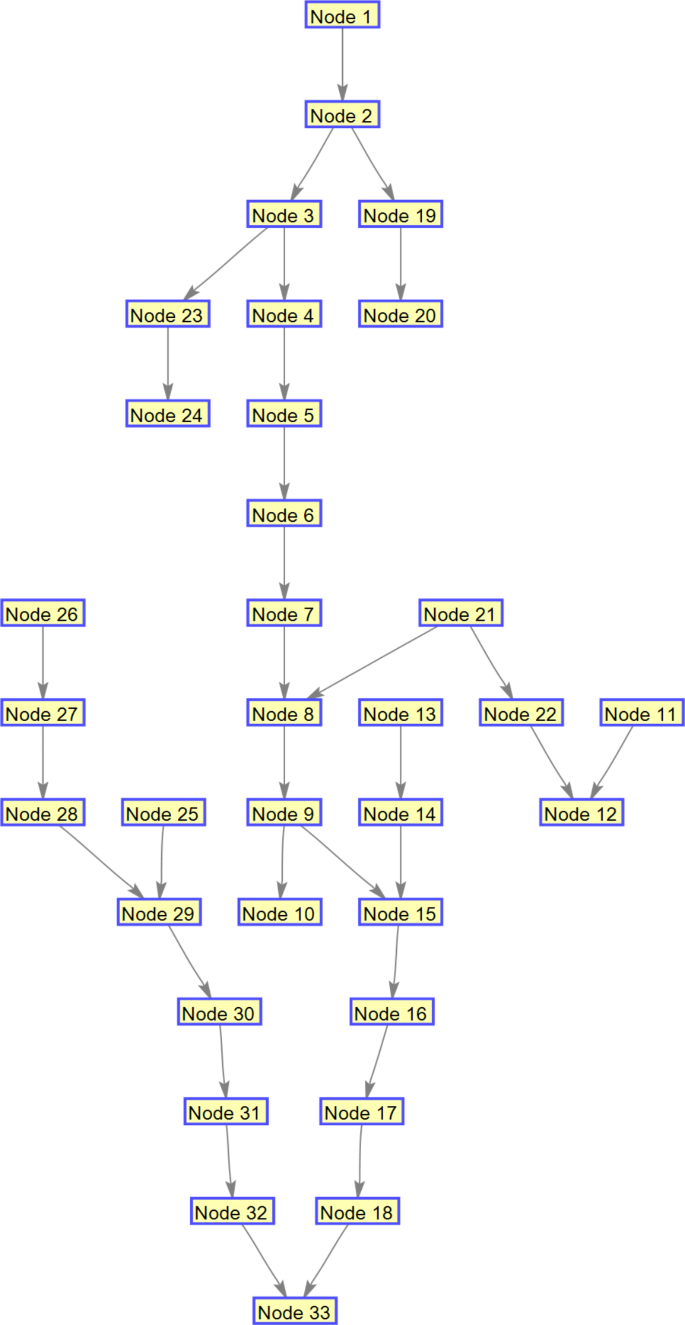
Topology of the 33-bus network in case a.
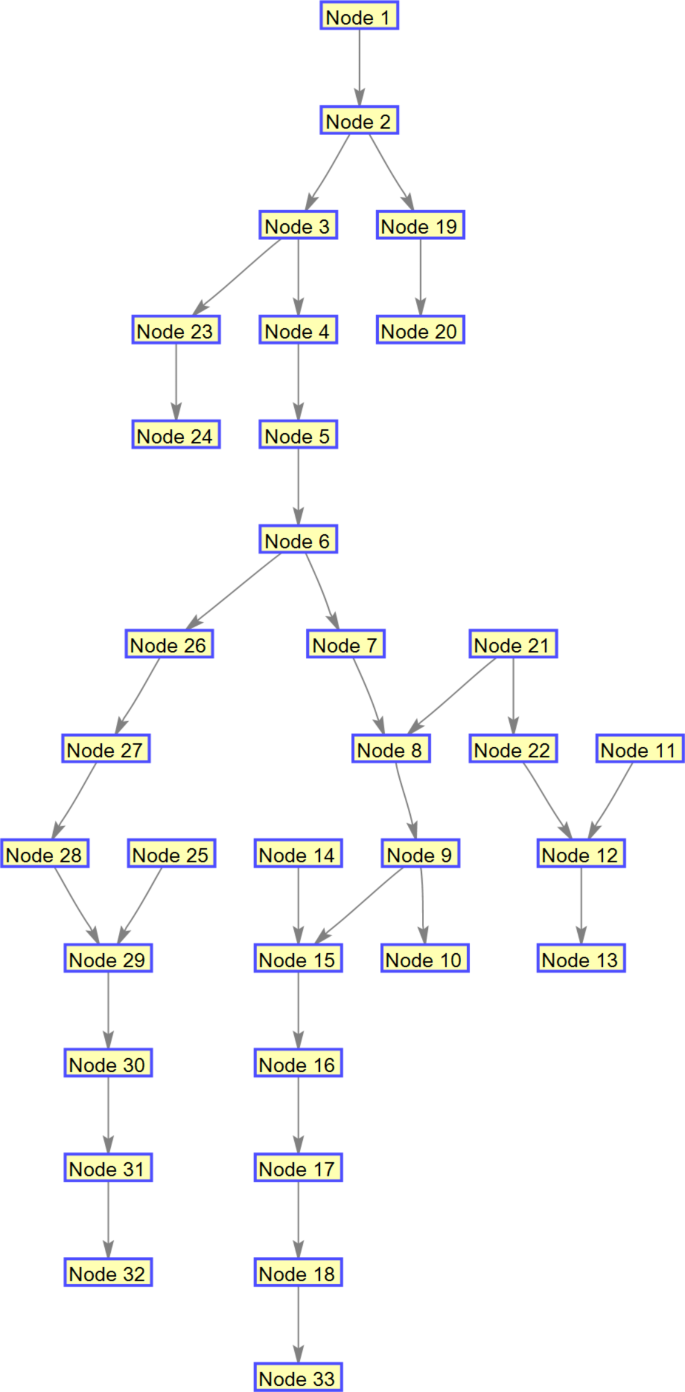
Topology of the 33-bus network in case b.
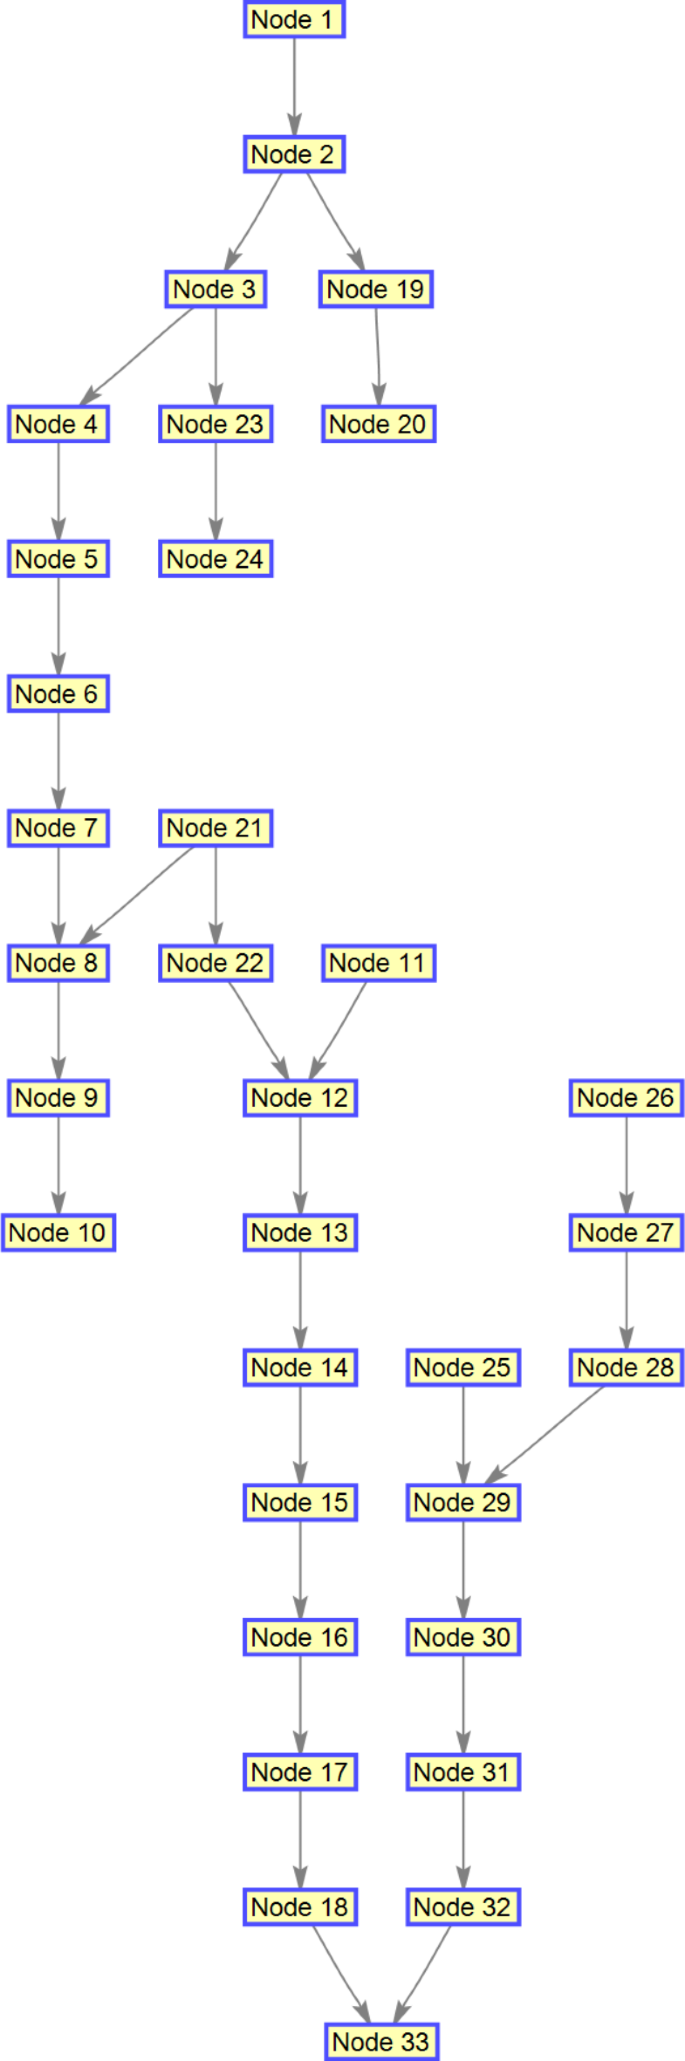
Topology of the 33-bus network in case c.
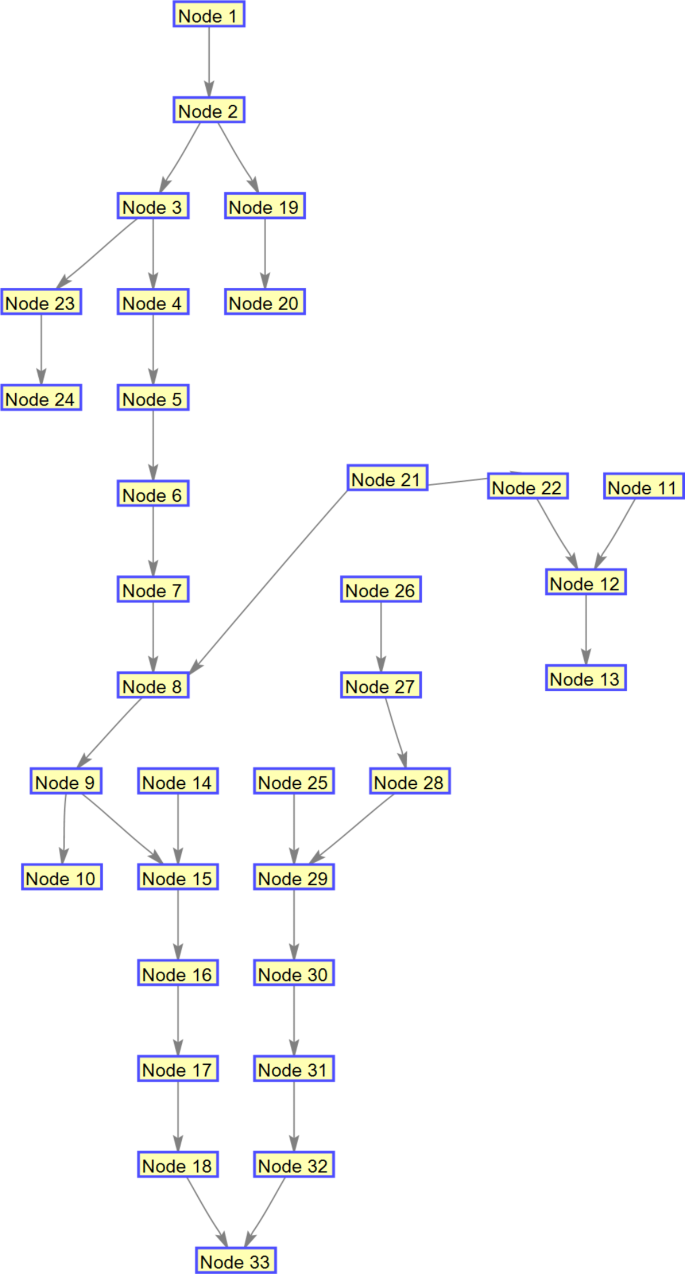
Topology of the 33-bus network in case d.
Table 3 presents a comparison between the results of robust and deterministic optimization regarding case a. In this instance, the electrical network faces uncertainty in the power production of generation sources and load. Robust optimization, considering this uncertainty, strives to find an optimal solution that is resilient against a wide range of possible conditions. In contrast, deterministic optimization assumes that all parameters are known with complete accuracy. Based on the results in the table, the following points can be noted:
Power losses in the robust case (0.64 megawatts) are slightly higher than in the deterministic case (0.58 megawatts). This is because robust optimization, to ensure electricity supply in all potential conditions, has to keep some transmission lines open. In both scenarios, there is no load shedding. This indicates that the electrical network has sufficient capacity to supply all the load under conditions of uncertainty. The minimum voltage in the robust case (0.970) is slightly lower than in the deterministic case (0.978). This is because robust optimization, to ensure electricity supply in all potential conditions, has to keep some transmission lines open. The maximum voltage is the same in both cases (1.022). n the robust case, five transmission lines are open (10, 12, 20, 24, 25). In contrast, in the deterministic case, four transmission lines are open (7, 13, 20, 24, 32). This indicates that robust optimization, to ensure electricity supply in all potential conditions, has to keep more lines open. The energy purchased from the main grid in the robust case (1.35 megawatt-hours) is slightly more than in the deterministic case (1.21 megawatt-hours). This is because robust optimization, to ensure electricity supply in all potential conditions, has to purchase a greater amount of energy from the main grid.
Overall, the results indicate that robust optimization can lead to outcomes that are resilient across a wide range of potential conditions. However, this may come with increased performance parameters, such as power losses, load shedding, or voltage. In the specific case of a, it can be said that robust optimization has led to increased power losses and purchased energy from the main grid. However, this is justifiable due to ensuring electricity supply in all potential conditions, a crucial objective in electric network management.
The 69-bus system
The simulation input data is detailed as follows (lines 69 to 73). The network features fossil fuel-based distributed generation (DG) units with a 1.5 MW capacity each, located at buses 29, 49, 57, and 61. Specifically, gas-fired DG units are installed at buses 15, 32, and 38, while a diesel-powered unit is positioned at bus 59. Energy Storage Systems (ESS) are placed at buses 3, 9, 21, 46, and 67, with each unit having a 1 MWh capacity. Solar photovoltaic (PV) panels are set up at buses 15, 16, 18, and 19, and wind turbines (WD) are located at buses 7 and 11. Electric Vehicle (EV) charging stations are available at buses 9, 15, 21, 32, and 38. The distribution substation is situated at bus 1, operating at a voltage level of 1 per unit (p.u.). This detailed specification of the input data ensures both clarity and the reproducibility of our simulation results.
The simulation outcomes are detailed in Table 4. This analysis considers various scenarios to evaluate the influence of the demand response program on the network reconfiguration issue. The cases are:
-
Case a: Operations without the demand response program.
-
Case b: Integration of the demand response program, with load variations set at 10%.
-
Case c: Application of the demand response program, featuring load changes of 15%.
-
Case d: Implementation of the demand response program, with a 20% adjustment in load levels.
The simulation results for the 69-bus system, as shown in Table 4, reveal the following insights:
In Case a, without the demand response program, power losses amount to 0.85 MW, with no load shedding occurring. The minimum voltage is 0.962 per unit (p.u.) and the maximum voltage is 1.01 p.u. The lines that are opened are 14, 56, 63, 69, and 70. The energy purchased is 0.987 MWh. In Case b, where the demand response program is integrated with a 10% load variation, power losses decrease slightly to 0.83 MW, with no load shedding still. The minimum voltage improves to 0.965 p.u. and the maximum voltage rises to 1.012 p.u. The lines opened in this scenario are 13, 58, 61, 69, and 70. The amount of energy purchased is reduced to 0.966 MWh. In Case c, with a 15% load change under the demand response program, power losses further decrease to 0.81 MW, maintaining zero load shedding. The minimum voltage increases to 0.969 p.u. and the maximum voltage reaches 1.013 p.u. The opened lines in this case are 13, 18, 56, 61, and 69. The energy purchased decreases to 0.952 MWh. In Case d, with a 20% load adjustment and the demand response program, power losses are the lowest at 0.79 MW, with no load shedding. The minimum voltage improves to 0.972 p.u. and the maximum voltage is 1.014 p.u. The lines opened are 14, 58, 61, 69, and 70. The energy purchased is the lowest at 0.947 MWh. Overall, the results indicate that the incorporation of the demand response program progressively enhances the system’s performance with reduced power losses, improved voltage stability, and decreased energy purchases as the load variations increase.
Conclusion
The study underscores the critical role of advanced smart distribution grid reconfiguration in enhancing loss reduction and voltage stability amid the complexities introduced by integrating energy storage systems, electric vehicles, demand-side management, and both renewable and traditional distributed generation resources. The proposed two-stage second-order cone optimization model has shown significant improvements. For instance, in the IEEE 33-bus system, power losses decreased from 0.64 MW to 0.52 MW, while in the IEEE 69-bus system, they fell from 0.85 MW to 0.79 MW. Voltage stability also improved notably, with the minimum voltage in the IEEE 33-bus system rising from 0.970 to 0.980 p.u., and in the IEEE 69-bus system, it increased from 0.962 to 0.972 p.u. Energy procurement from the transmission network was reduced as well, with purchases decreasing from 1.35 MWh to 1.05 MWh in the IEEE 33-bus system and from 0.987 MWh to 0.947 MWh in the IEEE 69-bus system. The integration of a column-and-constraint generation algorithm, coupled with the Gurobi solver and Julia programming language, has enhanced the model’s efficiency in solving complex grid problems. Overall, the research validates that this model provides a robust and practical solution for optimizing modern power systems, offering significant improvements in efficiency, stability, and cost-effectiveness. These results highlight the importance of continuous innovation in smart grid technologies to address the evolving challenges of contemporary energy systems. The following recommendations are proposed for future research endeavors:
-
1.
Develop a comprehensive multi-level model for modeling the natural gas distribution network to explore its influence on fossil gas-fired distributed generation (DG) resources.
-
2.
Investigate the ramifications of integrating new power-to-gas (P2G) systems, facilitating increased synergy between the electricity and gas networks. This includes exploring the potential for converting surplus electricity into gas and selling it to the natural gas network.
Data availability
Yes, I have research data to declare.“Data Availability on Request”If anyone wants to request the data of this study, they should contact the corresponding author, Dr. Mahmoud Samiei Moghaddam, by email at samiei352@yahoo.com.
Abbreviations
- SAMCSA:
-
Self-adaptive modified crow search algorithm
- MISOCP:
-
Mixed-integer second-order cone programming
- MINLP:
-
Mixed integer nonlinear programming
- LDBAS:
-
Lévy flight and chaos disturbed beetle antennae search
- SBSO:
-
Social beetle swarm optimization
- HA:
-
Heuristic algorithm
- LP:
-
Linear programming
- DBRL:
-
Data-driven batch-constrained reinforcement learning
- MICP:
-
Mixed-integer conic programming
- MIQP:
-
Mixed-integer quadratic programming
- MILP:
-
Mixed-integer linear programming
- SBB:
-
Standard branch and bound
- SAPSO:
-
Self-adaptive particle swarm optimization
- CCGP:
-
Chance-constrained goal programming
- NSGA-II:
-
Non-dominated sorting genetic algorithm
- EA:
-
Evolutionary algorithm
- STGA:
-
Spanning tree algorithm
- HHA:
-
Hybrid heuristic methods
- GA-PSO:
-
Genetic algorithm-particle swarm optimization
- SMILP:
-
Stochastic mixed-integer linear programming
- DIGWO:
-
Discrete improved grey wolf optimization
- DSM:
-
Demand-side management
- EV:
-
Electric vehicle
References
-
Prasad, P. S. & Sushama, M. Distribution network reconfiguration and capacitor allocation in distribution system using discrete improved Grey Wolf optimization. In: (eds Mekhilef, S., Shaw, R. N. & Siano, P.) Innovations in Electrical and Electronic Engineering. ICEEE 2022. Lecture Notes in Electrical Engineering, vol 894. Springer, Singapore. https://doi.org/10.1007/978-981-19-1677-9_54. (2022).
-
Hemmati, M., Mohammadi-Ivatloo, B., Abapour, M. & Anvari-Moghaddam, A. Optimal chance-constrained scheduling of reconfigurable microgrids considering islanding operation constraints, IEEE Syst. J., vol. 14, no. 4, pp. 5340–5349, Dec. doi: (2020). https://doi.org/10.1109/JSYST.2020.2964637
-
Jyoti Shukla, B. K., Panigrahi, P. K. & Ray Stochastic reconfiguration of distribution system considering stability, correlated loads and renewable energy based DGs with varying penetration. Sustainable Energy Grids Networks. 23, 100366 (2020).
-
Gao, Y., Wang, W., Shi, J. & Yu, N. Batch-constrained reinforcement learning for dynamic distribution network reconfiguration, IEEE Trans. Smart Grid, vol. 11, no. 6, pp. 5357–5369, Nov. doi: (2020). https://doi.org/10.1109/TSG.2020.3005270
-
Ehsan Kazemi-Robati. Mohammad Sadegh Sepasian, fast heuristic methods for harmonic minimization using distribution system reconfiguration. Electr. Power Syst. Res.181, 106185 (2020).
-
Chen, S., Yang, Y., Qin, M. & Xu, Q. Coordinated multiobjective optimization of the integrated energy distribution system considering network reconfiguration and the impact of price fluctuation in the gas market. Int. J. Electr. Power Energy Syst.138, 107776 (2022).
-
Yousri, D., Thanikanti, S. B., Balasubramanian, K., Osama, A. & Fathy, A. Multi-objective Grey Wolf optimizer for optimal design of switching matrix for shaded PV array dynamic reconfiguration. IEEE Access.8, 159931–159946. https://doi.org/10.1109/ACCESS.2020.3018722 (2020).
-
Yinpeng Qu, C. C. et al. A global optimum flow pattern for feeder reconfiguration to minimize power losses of unbalanced distribution systems. Int. J. Electr. Power Energy Syst.131, 107071 (2021).
-
Mahdavi, M., Alhelou, H. H. & Hesamzadeh, M. R. An efficient stochastic reconfiguration model for distribution systems with uncertain loads. IEEE Access.10, 10640–10652. https://doi.org/10.1109/ACCESS.2022.3144665 (2022).
-
Karimianfard, H. & Haghighat, H. An initial-point strategy for optimizing distribution system reconfiguration. Electr. Power Syst. Res.176, 105943 (2019).
-
Qingxin Shi, F. et al. Co-optimization of repairs and dynamic network reconfiguration for improved distribution system resilience. Appl. Energy, 318, (2022).
-
Razavi, S. M., Momeni, H. R., Haghifam, M. R. & Bolouki, S. Multi-objective optimization of distribution networks via daily reconfiguration. IEEE Trans. Power Delivery. 37(2), 775–785. https://doi.org/10.1109/TPWRD.2021.3070796 (April 2022).
-
Xu, J. et al. Islanding and dynamic reconfiguration for resilience enhancement of active distribution systems. Electr. Power Syst. Res.189, 106749 (2020).
-
Wang, J., Wang, W., Wang, H. & Zuo, H. Dynamic reconfiguration of multiobjective distribution networks considering DG and EVs based on a novel LDBAS algorithm. IEEE Access.8, 216873–216893. https://doi.org/10.1109/ACCESS.2020.3041398 (2020).
-
Song, Y., Zheng, Y., Liu, T., Lei, S. & Hill, D. J. A new formulation of distribution network reconfiguration for reducing the voltage volatility induced by distributed generation, IEEE Trans. Power Syst.35(1), 496–507. https://doi.org/10.1109/TPWRS.2019.2926317 (2020).
-
Sekhavatmanesh, H., Cherkaoui, R. & Multi-Step, A. Reconfiguration model for active distribution network restoration integrating DG start-up sequences, IEEE Trans. Sustain. Energy11(4), 2879–2888. https://doi.org/10.1109/TSTE.2020.2980890 (2020).
-
Azizivahed et al. Energy management strategy in dynamic distribution network reconfiguration considering renewable energy resources and storage. IEEE Trans. Sustain. Energy. 11(2), 662–673. https://doi.org/10.1109/TSTE.2019.2901429 (2020).
-
Yin, S., Wang, J. & Gangammanavar, H. Stochastic market operation for coordinated transmission and distribution systems. IEEE Trans. Sustain. Energy. 12(4), 1996–2007. https://doi.org/10.1109/TSTE.2021.3076037 (2021).
-
Chen, Q. et al. A social beetle swarm algorithm based on grey target decision-making for a multiobjective distribution network reconfiguration considering partition of time intervals. IEEE Access.8, 204987–205013. https://doi.org/10.1109/ACCESS.2020.3036898 (2020).
-
Li, Z., Wu, W., Zhang, B. & Tai, X. Analytical reliability assessment method for complex distribution networks considering post-fault network reconfiguration. IEEE Trans. Power Syst.35(2), 1457–1467. https://doi.org/10.1109/TPWRS.2019.2936543 (2020).
-
Huang, W., Zheng, W. & Hill, D. J. Distribution Network reconfiguration for short-term voltage stability enhancement: An efficient deep learning approach. IEEE Transactions on Smart Grid, 12(6), 5385–5395. https://doi.org/10.1109/TSG.2021.3097330 (2021).
-
Wu, H., Dong, P. & Liu, M. Optimization of network-load Interaction with multi-time period flexible random fuzzy uncertain demand response. IEEE Access.7, 161630–161640. https://doi.org/10.1109/ACCESS.2019.2940721 (2019).
-
Sepasian, E. K. R. M. S., Hafezi, H. & Arasteh, H. PV-hosting-capacity enhancement and power-quality improvement through multiobjective reconfiguration of harmonic-polluted distribution systems. Int. J. Electr. Power Energy Syst.140, 107972 (2022).
-
Wang, C. et al. MDP-Based distribution network reconfiguration with renewable distributed generation: approximate dynamic Programming Approach. IEEE Trans. Smart Grid. 11(4), 3620–3631. https://doi.org/10.1109/TSG.2019.2963696 (July 2020).
-
Santos, S. F. et al. Dynamic distribution system reconfiguration considering distributed renewable energy sources and energy storage systems. IEEE Syst. J.https://doi.org/10.1109/JSYST.2021.3135716
-
Harsh, P. & Das, D. Optimal coordination strategy of demand response and electric vehicle aggregators for the energy management of reconfigured grid-connected microgrid. Renew. Sustain. Energy Rev.160, 112251 (2022).
-
Zhou, H., Zhai, M., Yang & Lin, Y. Three-phase unbalanced distribution network dynamic reconfiguration: A distributionally robust approach. IEEE Trans. Smart Grid. 13(3), 2063–2074. https://doi.org/10.1109/TSG.2021.3139763 (2022).
-
Kianmehr, E., Nikkhah, S., Vahidinasab, V., Giaouris, D. & Taylor, P. C. A resilience-based architecture for joint distributed energy resources allocation and hourly network reconfiguration. IEEE Trans. Ind. Inform.15(10), 5444–5455. https://doi.org/10.1109/TII.2019.2901538 (2019).
-
Gao, H. et al. Multi-objective dynamic reconfiguration for urban distribution network considering multi-level switching modes. J. Modern Power Syst. Clean Energy, 10(5), 1241–1255. https://doi.org/10.35833/MPCE.2020.000870 (2022).
-
Karimianfard, H., Salehizadeh, M. R. & Siano, P. Economic profit enhancement of a demand response aggregator through investment of large-scale energy storage systems. CSEE J. Power Energy Syst., 8(5), 1468–1476. https://doi.org/10.17775/CSEEJPES.2021.02650 (2022).
-
Karimianfard, H. & Haghighat, H. Generic resource allocation in distribution Grid. IEEE Trans. Power Syst.34(1), 810–813. https://doi.org/10.1109/TPWRS.2018.2867170 (Jan. 2019).
-
Zeng, B. & Zhao, L. Solving two-stage robust optimization problems using a column-and-constraint generation method. Oper. Res. Lett.41, 457–461 (2013).
-
Dehghan, S., Amjady, N. & Kazemi, A. Two-stage robust generation expansion planning: A mixed integer linear programming model. IEEE Trans. Power Syst.29, 584–597 (2014).
-
Guo, Y. & Zhao, C. Islanding-aware robust energy management for microgrids. IEEE Trans. Smart Grid. 9, 1301–1309 (2016).
-
Li, Z., Xu, Y., Wang, P. & Xiao, G. Restoration of a multi-energy distribution system with joint district network reconfiguration via distributed stochastic programming. IEEE Trans. Smart Grid. 15(3), 2667–2680. https://doi.org/10.1109/TSG.2023.3317780 (May 2024).
-
Lei, C., Bu, S., Wang, Q. & Liang, L. Observability defense-constrained distribution network reconfiguration for cyber-physical security enhancement. IEEE Trans. Smart Grid. 15(2), 2379–2382. https://doi.org/10.1109/TSG.2023.3334078 (March 2024).
-
Gao, H. et al. A cloud-edge collaboration solution for distribution network reconfiguration using multi-agent deep reinforcement learning. IEEE Trans. Power Syst.39(2), 3867–3879. https://doi.org/10.1109/TPWRS.2023.3296463 (2024).
-
Jabr, R. A. Perspective reformulations of the two-level service restoration problem. IEEE Trans. Power Syst., 39(2), 4714–4722. https://doi.org/10.1109/TPWRS.2023.3317287 (2024).
-
de Souza, V. C., Vieira, J. P. A. & Batista, V. S. Bi-directional inhibition of step-voltage regulator runaway in reconfigurable active distribution networks from one tap change. IEEE Trans. Power Deliv., 39(3), 1674–1686. https://doi.org/10.1109/TPWRD.2024.3375116 (2024).
-
Noradin Ghadimi, M., Ghiasi, M. & Dehghani, G. Editorial special issue on cyber–physical security. Energy Rep., 9, 969–970 (2023).
-
Yang, Z., Ghadamyari, M., Khorramdel, H., Alizadeh, S. M. S., Pirouzi, S., Milani, M. & Ghadimi, N. Robust multi-objective optimal design of islanded hybrid system with renewable and diesel sources/stationary and mobile energy storage systems. Renew. Sustain. Energy Rev.148, 111295 (2021).
-
Jun Liu, C., Chen, Z., Liu, K., Jermsittiparsert, N. & Ghadimi An IGDT-based risk-involved optimal bidding strategy for hydrogen storage-based intelligent parking lot of electric vehicles. J. Energy Storage Volume. 27, 101057 (2020).
-
Lu, M. et al. Smart load scheduling strategy utilising optimal charging of electric vehicles in power grids based on an optimisation algorithm. IET Smart Grid. 3, 914–923. https://doi.org/10.1049/iet-stg.2019.0334 (2020).
-
Parsibenehkohal, R., Jamil, M. & Khan, A. A. A multi-stage framework for coordinated scheduling of networked microgrids in active distribution systems with hydrogen refueling and charging stations. Int. J. Hydrog. Energy. 71, 1442–1455 (2024).
-
Niaki, A. A. & Jamil, M. An efficient hydrogen-based water-power strategy to alleviate the number of transmission switching within smart grid. Int. J. Hydrog. Energy. 70, 347–356 (2024).
-
Tostado-Véliz, M., Mansouri, S. A., Rezaee-Jordehi, A., Icaza-Alvarez, D. & Jurado, F. (2023). Information gap decision theory-based day-ahead scheduling of energy communities with collective hydrogen chain. Int. J. Hydrog. Energy, 48(20), 7154–7169 (2023).
-
Mansouri, S. A. et al. A coordinated energy management framework for industrial, residential and commercial energy hubs considering demand response programs. Sustain. Energy Technol. Assess.47, 101376 (2021).
-
Xiaopei Nie, S. A., Mansouri, A. R., Jordehi, M., Tostado-Véliz, Y. Z. & Alharthi Emerging renewable-based electricity grids under high penetration of cleaner prosumers: Unraveling the flexibility issues using a four-layer decentralized mechanism. J. Clean. Prod.443, 141107 (2024).
-
Mansouri, S. A. et al. An IoT-enabled hierarchical decentralized framework for multi-energy microgrids market management in the presence of smart prosumers using a deep learning-based forecaster. Appl. Energy. 333, 120560 (2023).
-
Jordehi, A. R. et al. Industrial energy hubs with electric, thermal and hydrogen demands for resilience enhancement of mobile storage-integrated power systems. Int. J. Hydrog. Energy, 50(Part B), 77–91 (2024).
-
Tostado-Véliz, M., et al. A fully robust home energy management model considering real time price and on-board vehicle batteries. J. Energy Storage, 72(Part B), 108531 (2023).
-
Mansouri, S. A. et al. A hierarchical scheduling framework for resilience enhancement of decentralized renewable-based microgrids considering proactive actions and mobile units. Renew. Sustain. Energy Rev., 168, 112854 (2022).
-
Marcos Tostado-Véliz, Liang, Y., Jordehi, A. R., Mansouri, S. A. & Jurado, F. An interval-based bi-level day-ahead Scheduling Strategy for Active Distribution Networks in the Presence of Energy Communities, 35101088 (Sustainable Energy, Grids and Networks, 2023).
-
Ahmarinejad, S. A. M. A. et al. Chap. 9 – Demand Response role for Enhancing the Flexibility of Local Energy Systems, Editor(s): Giorgio Graditi, Marialaura Di Somma, Distributed Energy Resources in Local Integrated Energy Systems, 279–313 (Elsevier, 2021).
-
Xiaohui Zhou, S. A., Mansouri, A. R., Jordehi, M., Tostado-Véliz, F. & Jurado A three-stage mechanism for flexibility-oriented energy management of renewable-based community microgrids with high penetration of smart homes and electric vehicles. Sustainable Cities Soc.99, 104946 (2023).
-
Karimianfard, H., Haghighat, H. & Zeng, B. Co-optimization of battery storage investment and grid expansion in integrated energy systems. IEEE Syst. J.16(4), 5928–5938. https://doi.org/10.1109/JSYST.2021.3130057 (2022).
-
Mansouri, S. A., Maroufi, S. & Ahmarinejad, A. A tri-layer stochastic framework to manage electricity market within a smart community in the presence of energy storage systems. J. Energy Storage. 71, 108130 (2023).
-
XiaoPei Nie, S. A., Mansouri, A. R., Jordehi, M. & Tostado-Véliz A two-stage optimal mechanism for managing energy and ancillary services markets in renewable-based transmission and distribution networks by participating electric vehicle and demand response aggregators. Int. J. Electr. Power Energy Syst.158, 109917 (2024).
-
Haghighat, H., Karimianfard, H. & Zeng, B. Integrating energy management of autonomous smart grids in electricity market operation. IEEE Trans. Smart Grid, 11(5), 4044–4055. https://doi.org/10.1109/TSG.2020.2992570 (2020).
-
Mansouri, S. A., Nematbakhsh, E., Jordehi, A. R., Marzband, M., Tostado-Véliz, M., & Jurado, F. An interval-based nested optimization framework for deriving flexibility from smart buildings and electric vehicle fleets in the TSO-DSO coordination.Appl. Energy, 341, 121062 (2023).
-
Aguado, S. A. M. A three-layer game theoretic-based strategy for optimal scheduling of microgrids by leveraging a dynamic demand response program designer to unlock the potential of smart buildings and electric vehicle fleets. Appli. Energy, 347, 121440 (2023).
-
Mansouri, S. A. et al. Bi-level mechanism for decentralized coordination of internet data centers and energy communities in local congestion management markets. In 2023 IEEE International Conference on Energy Technologies for Future Grids (ETFG), Wollongong, Australia, 2023, 1–6. https://doi.org/10.1109/ETFG55873.2023.10407758
-
Zhang, P., Mansouri, S. A., Jordehi, A. R., Tostado-Véliz, M. & Alharthi, Y. Z. Murodbek Safaraliev, an ADMM-enabled robust optimization framework for self-healing scheduling of smart grids integrated with smart prosumers. Appl. Energy. 363, 123067 (2024).
-
Meng, Y., Mansouri, S. A., Jordehi, A. R., & Tostado-Véliz, M. Eco-environmental scheduling of multi-energy communities in local electricity and natural gas markets considering carbon taxes: A decentralized bi-level strategy. J. Clean. Prod.440, 140902 (2024).
Funding
The authors declare that they have received no funding.
Author information
Authors and Affiliations
Contributions
“1- Mahsa Choobdari 2- Mahmoud Samiei Moghaddam 3- Reza Davarzani wrote the main manuscript text and 4- Azita Azarfar and 5- Hesamodin Hoseinpour prepared all figures. All authors reviewed the manuscript.”
Corresponding author
Ethics declarations
Competing interests
The authors declare no competing interests.
Additional information
Publisher’s note
Springer Nature remains neutral with regard to jurisdictional claims in published maps and institutional affiliations.
Rights and permissions
Open Access This article is licensed under a Creative Commons Attribution-NonCommercial-NoDerivatives 4.0 International License, which permits any non-commercial use, sharing, distribution and reproduction in any medium or format, as long as you give appropriate credit to the original author(s) and the source, provide a link to the Creative Commons licence, and indicate if you modified the licensed material. You do not have permission under this licence to share adapted material derived from this article or parts of it. The images or other third party material in this article are included in the article’s Creative Commons licence, unless indicated otherwise in a credit line to the material. If material is not included in the article’s Creative Commons licence and your intended use is not permitted by statutory regulation or exceeds the permitted use, you will need to obtain permission directly from the copyright holder. To view a copy of this licence, visit http://creativecommons.org/licenses/by-nc-nd/4.0/.
About this article
Cite this article
Choobdari, M., Samiei Moghaddam, M., Davarzani, R. et al. Robust distribution networks reconfiguration considering the improvement of network resilience considering renewable energy resources.
Sci Rep 14, 23041 (2024). https://doi.org/10.1038/s41598-024-73928-1
-
Received: 01 February 2024
-
Accepted: 23 September 2024
-
Published: 04 October 2024
-
DOI: https://doi.org/10.1038/s41598-024-73928-1
Keywords
Comments
By submitting a comment you agree to abide by our Terms and Community Guidelines. If you find something abusive or that does not comply with our terms or guidelines please flag it as inappropriate.
Search
RECENT PRESS RELEASES
Related Post

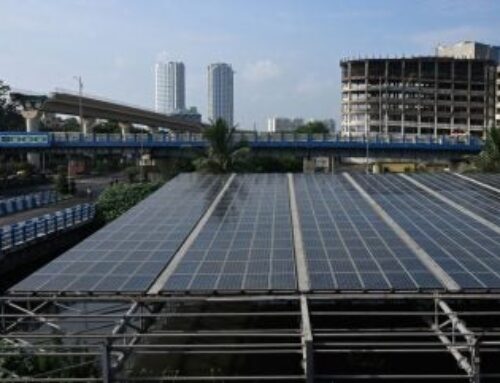

