This Chart Shows How California Is Massively Extending Solar Use Into The Evening
September 24, 2024
Sign up for daily news updates from CleanTechnica on email. Or follow us on Google News!
As solar energy became a larger and larger portion of California electricity generation, there were rising concerns about the infamous “duck curve.” Solar energy was starting to dominate midday electricity generation, forcing curtailments even, while peak electricity demand in the evening was a tad too late for solar to be helpful.
The core solution, of course, was for batteries to come in and soak up extra midday electricity generation and then disperse it in the evening. Thus, California has installed a lot of battery storage on the grid in the past few years.
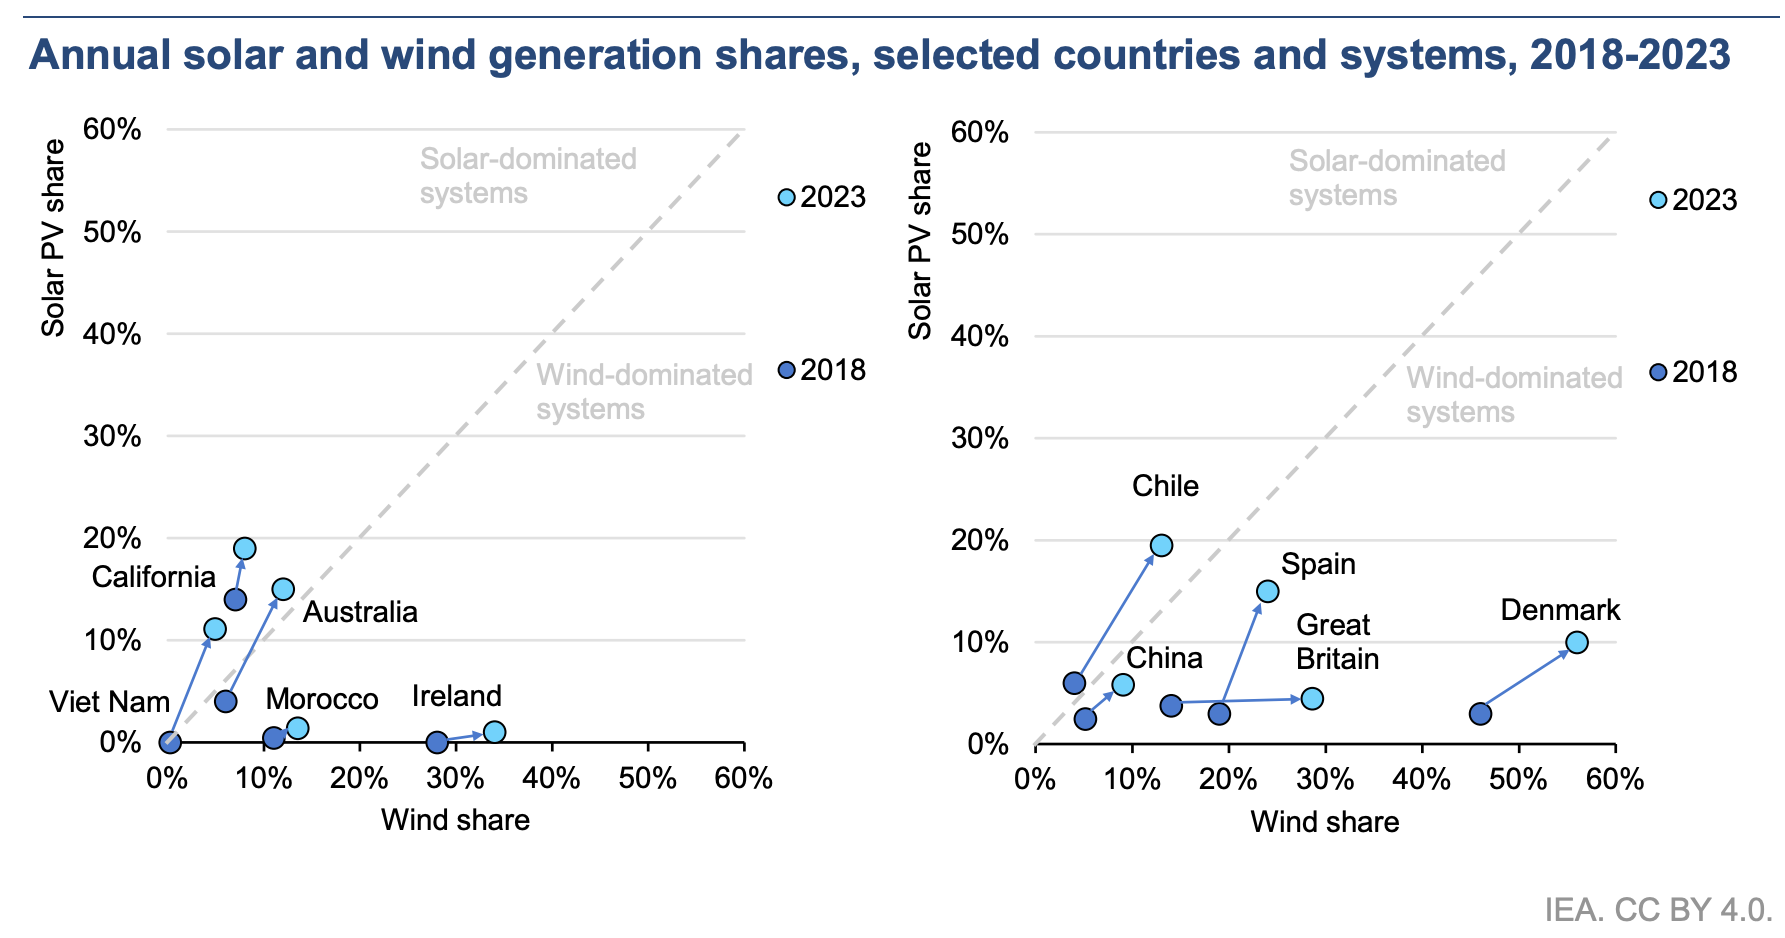
Looking through the new International Energy Agency (IEA) report I wrote about the other day (see: “Interesting Chart: How Much Solar or Wind Dominate Renewable Energy in Different Countries“), I ran across a chart demonstrating how well this is now working in California. Here’s the chart:
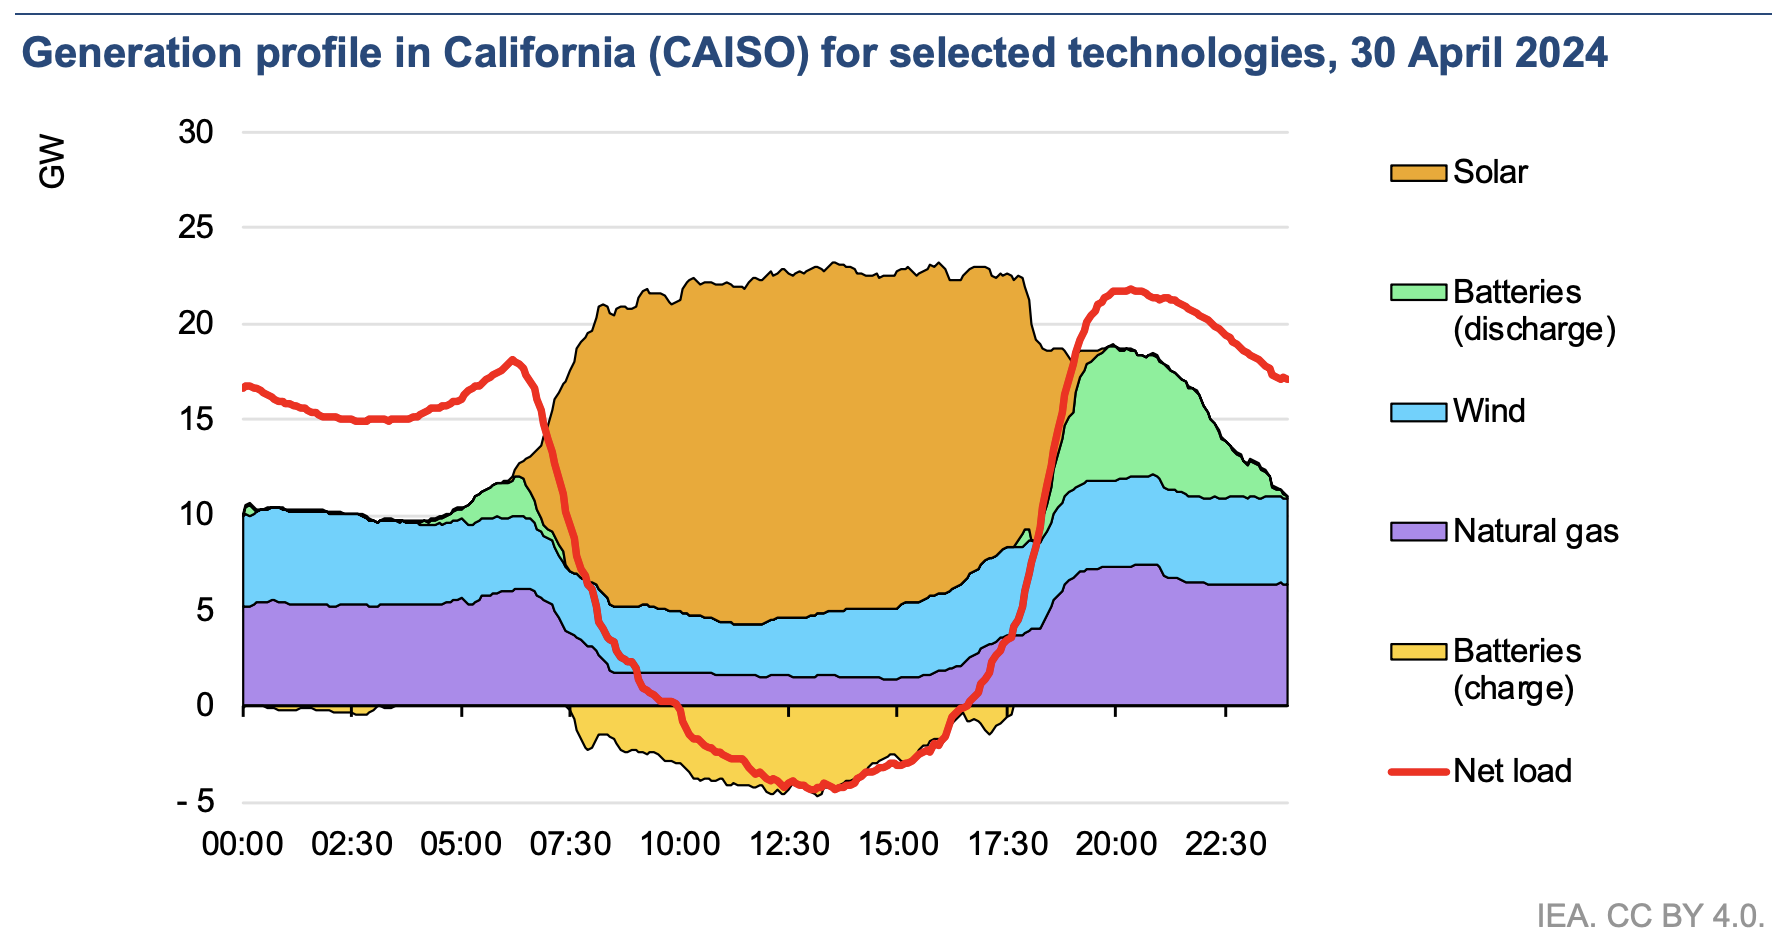
“Several countries already have battery storage or plan to have in the coming years. In California, batteries reached a record power discharge of 7 GW on 30 April 2024, meeting about 33% of net load peak, contributing significantly on top of imports and natural gas. In Italy, the National Climate and Energy Plan relies on batteries to meet decarbonisation targets for 2030. While batteries accounted for 2.3 GW in 2023, these were spread across 300 000 installations. Italy aims for 15 GW of battery capacity by 2030, with 11 GW of utility-scale installations,” the IEA writes.
“EVs are increasingly contributing to flexibility as well, relying on smart charging technologies that are currently being deployed at scale. VRE generators themselves can also contribute to balancing services. For example, in Spain, more than 60% of installed wind capacity and about a quarter of installed PV capacity participate in frequency regulation services in the minutes timeframe, accounting for more than 35% of the energy allocated in these balancing markets.”
We’ll come to some of those other topics later, but it’s truly stunning to see how much battery storage is already helping to integrate more solar power in The Golden State. If you recall from that other article a couple of days ago, solar PV has reached 20% of California’s electricity supply. It has the potential to reach a. much higher percentage, and if you think about doubling it to 40%, you can imagine doubling (or, actually, more than doubling) battery storage and spreading that electricity out across more hours of the day and night to nearly wipe natural gas off the chart. Wouldn’t that be nice!
As noted above, there are also other solutions to help use and integrate more renewable energy while avoiding curtailment at times of high production. Here’s a table of options from the IEA report:
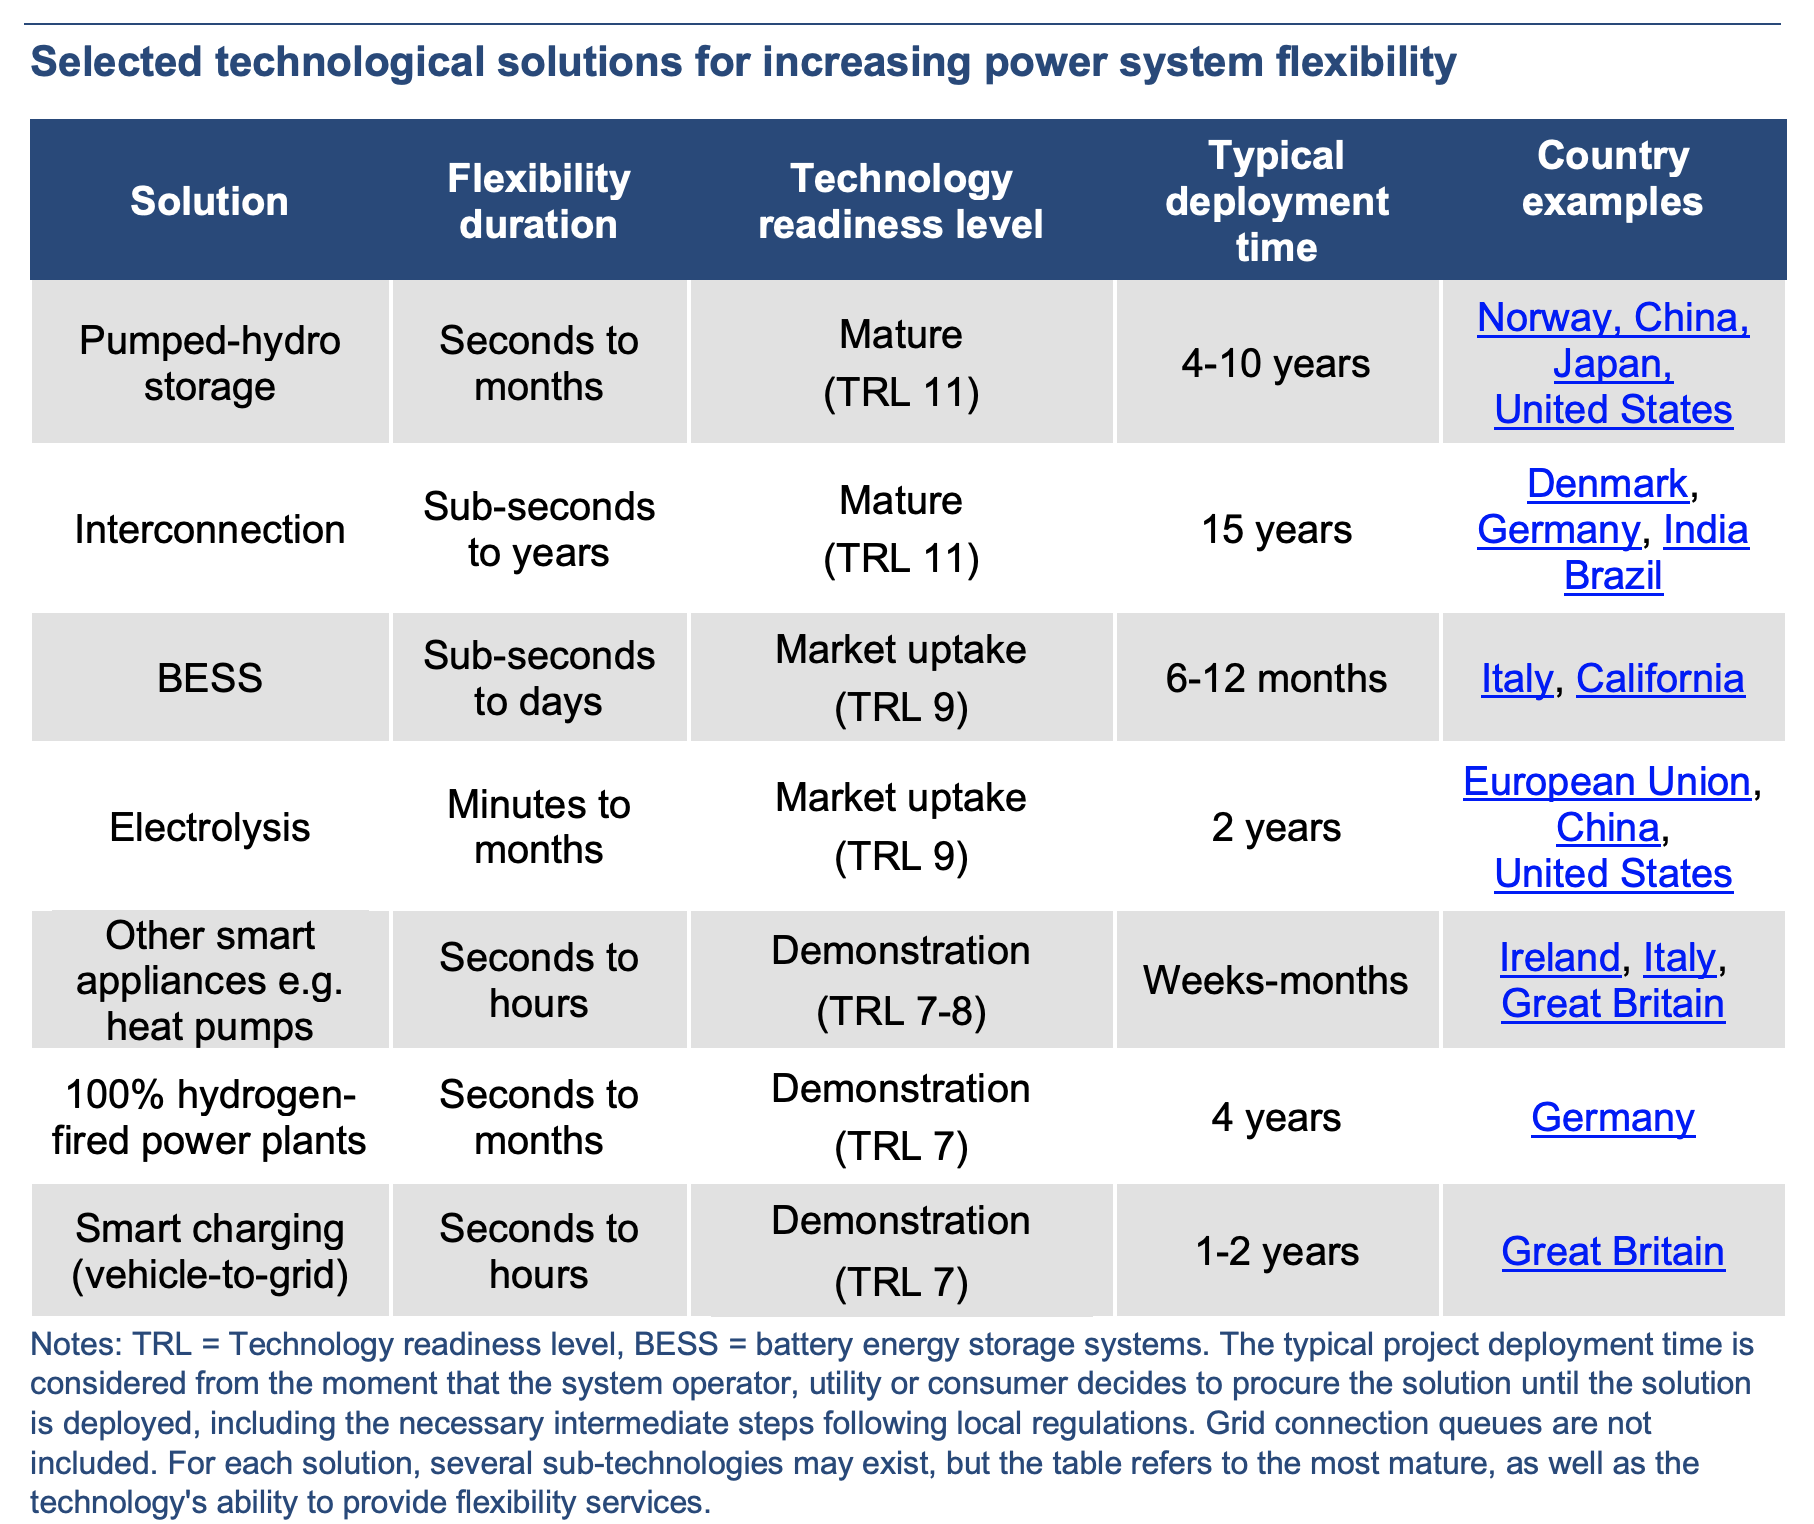
Perhaps we’ll dive into some of those other options and the cases studies highlighted in the IEA report.

Have a tip for CleanTechnica? Want to advertise? Want to suggest a guest for our CleanTech Talk podcast? Contact us here.
Latest CleanTechnica.TV Videos

Advertisement
CleanTechnica uses affiliate links. See our policy here.
CleanTechnica’s Comment Policy
Search
RECENT PRESS RELEASES
Related Post
