US Solar Imports Surge 286% as Domestic Manufacturing Expand, S&P Global Data Says
November 27, 2024
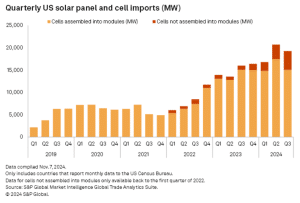
US imports of crystalline-silicon solar cells saw a dramatic increase in the third quarter of 2024, rising more than fourfold compared to the same period in 2023, according to S&P Global Commodity Insights. This surge reflects the growing demand from rapidly expanding domestic solar panel factories, fueled by policy shifts and significant investments in US solar manufacturing.
Solar Power Driving Up the Clean Energy Revolution
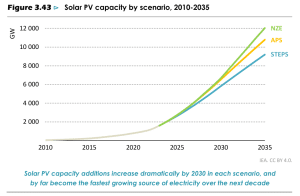
Solar energy is accelerating global energy transitions, driven by affordability and technological advancements. According to the IEA’s World Energy Outlook 2024, solar photovoltaic (PV) systems are a leading force in clean energy deployment.
- By 2030, solar could account for over 40% of new power capacity, emphasizing its pivotal role in global decarbonization efforts.
Moreover, renewables’ electricity generation share will climb from 22% to 58% by 2035, driven primarily by solar PV. This growth is supported by record investment and strong policy support in renewables, helping to address energy security concerns and reduce emissions.

The 2022 Inflation Reduction Act (IRA), central to Biden’s clean energy policy, provides up to $1.2 trillion in tax incentives over a decade to drive clean energy growth. Its advanced manufacturing tax credit has spurred over $34 billion in solar investments. This resulted in numerous new or expanded solar module factories across the U.S.
Solar module production capacity in the country has skyrocketed, exceeding 45 GW as of October. At peak production, these solar manufacturing facilities could fulfill most of the U.S. solar demand projected for 2025.
Solar Import Surge Powers Domestic Factories
Imports of photovoltaic (PV) cells not yet assembled into panels reached 4,230 MW in Q3. That is a sharp increase from 903 MW in the third quarter of 2023, according to S&P Global Market Intelligence’s Global Trade Analytics Suite.
- Over the first nine months of 2024, unassembled PV cell imports totaled 9,454 MW, up nearly 286% from 2,448 MW during the same period in 2023.

This increase follows President Joe Biden’s August decision to raise the annual cap on tariff-free PV cell imports from 5 GW to 12.5 GW. Biden highlighted the solar industry’s “positive adjustment to import competition” and the growth in module production capacity as key reasons for the policy change.
The IRA has played a pivotal role in incentivizing domestic solar panel production through lucrative tax credits. However, despite these gains, a lack of crystalline cell, wafer, and ingot manufacturing capacity in the US leaves panel manufacturers heavily reliant on imported components.
With President-elect Donald Trump promising to introduce new tariffs on foreign-made goods to support US manufacturing, the solar industry is preparing for potential shifts in trade policy that could impact supply chains.
Robust Module Imports
While domestic module production ramps up, imports of fully assembled solar panels remain strong. The US imported 15 GW of modules in Q3 2024, slightly lower than the record 17.4 GW in Q2 but consistent with Q3 2023 levels, per S&P Global report.

For the first nine months of 2024, total panel imports reached 47.3 GW, up from 41 GW in the same period last year. Combined cell and module imports for January–September exceeded 56.7 GW, representing a 31% increase from the 43.4 GW imported during the same period in 2023.
With this robust supply chain, the US solar market could install over 46 GWdc of solar panels in 2024. Plus, an additional 43.3 GWdc in 2025, according to S&P Global Commodity Insights.
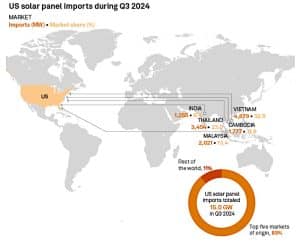
The majority of crystalline solar cell imports in Q3 came from factories in Southeast Asia as shown above. Malaysia led the pack, accounting for 37.3% of U.S. imports, followed by Thailand (27.6%) and South Korea (20%). Vietnam and Laos contributed smaller shares, at 4% and 3.7%, respectively.
Panel imports, including both crystalline and thin-film technologies, were also primarily sourced from Southeast Asia. Vietnam supplied 32.5%, Thailand contributed 23%, and Malaysia accounted for 13.4%. Other key contributors included Cambodia (11.8%) and India (8.4%).
Leading the Solar Revolution: Top Companies Driving Innovation
As solar energy is gaining momentum globally, key players are also making significant strides.
For one, Toronto-based SolarBank Corporation, focusing on utility-scale and community solar projects across North America, just delivered 600 MW of clean energy in the U.S. and Canada. Expanding into new markets like New York, its initiatives offset significant carbon emissions, accelerating the energy transition.
Another solar company is NextEra Energy, a clean energy powerhouse headquartered in Florida. With over 72,000 MW of generating capacity, it leads in wind and solar power production. NextEra is reducing carbon emissions through renewable energy and innovative technologies.
Similarly, Arizona-based First Solar specializes in thin-film PV panels, boasting a lower carbon footprint and superior durability. With 25 GW of installed capacity and a target to reach 16 GW annual production by 2025, its innovations power major solar farms worldwide.
These companies showcase the transformative potential of solar energy in achieving a sustainable future.
As the country prepares for potential changes in trade policy under Trump’s administration, companies must adapt to evolving regulations. For now, the combination of robust imports and growing domestic production capacity positions the U.S. solar market for sustained growth, supporting the transition to clean energy.
Search
RECENT PRESS RELEASES
Related Post


