5 Bear Market Signals Are Flashing for Bitcoin This January
January 19, 2026
January has been volatile so far for Bitcoin (BTC), with the asset facing renewed headwinds amid escalating geopolitical tensions between the US and the EU following President Trump’s latest tariff announcements.
Over the past 24 hours, the largest cryptocurrency has fallen nearly 2.5% to $92,663. Meanwhile, analysts are pointing to key bear market signals emerging in 2026.
SponsoredSponsored
In a recent X (formerly Twitter) post, analyst Titan of Crypto pointed to a “Kumo twist,” appearing in Bitcoin’s weekly chart. For context, a Kumo twist is a formation that occurs when the two leading spans of the Ichimoku Cloud (Senkou Span A and Senkou Span B) cross, causing the future cloud to flip direction.
Depending on the direction of the crossover, it can signal a potential transition from bullish to bearish conditions or from bearish to bullish. In Bitcoin’s case, the current twist is bearish.
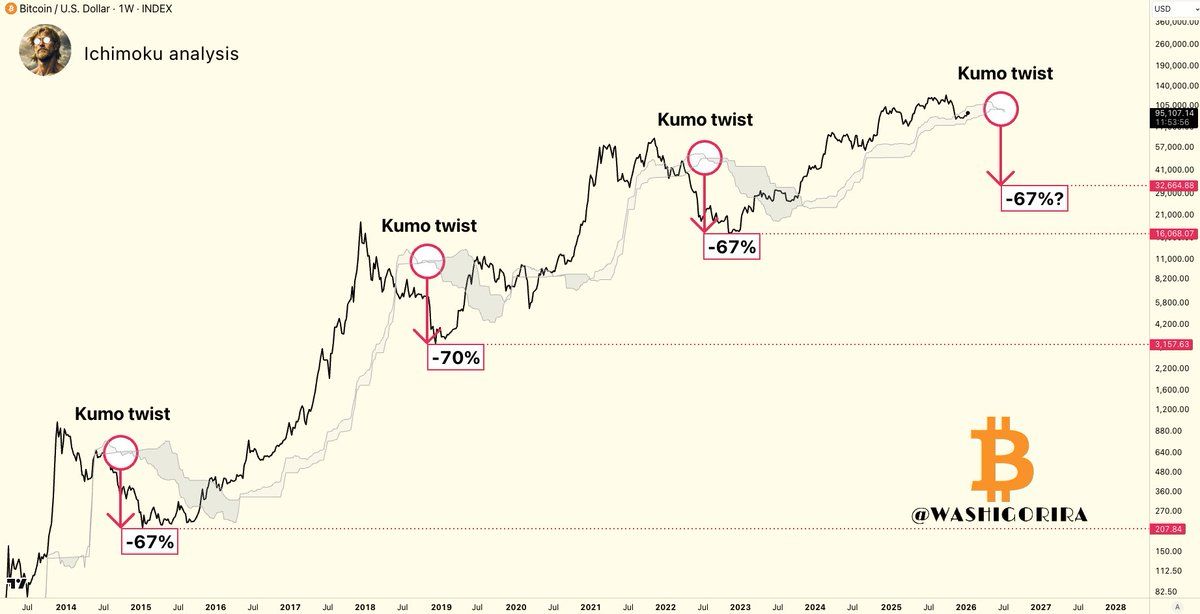
Looking at previous market cycles, Titan of Crypto noted that similar weekly Kumo shifts preceded notable corrective phases, during which Bitcoin eventually recorded drawdowns of around 67% to 70%.
“Historically, when the weekly Kumo turned bearish, BTC entered a bear market phase. That doesn’t imply an immediate drop. It simply means the overall market structure and trend dynamics have shifted. This is context, not a prediction. Based on the last three cycles,” the post read.
In addition, Bitcoin currently trades below its 365-day moving average, which sits near $101,000. This barrier was key during the 2022 bear market, when it halted recovery rallies.
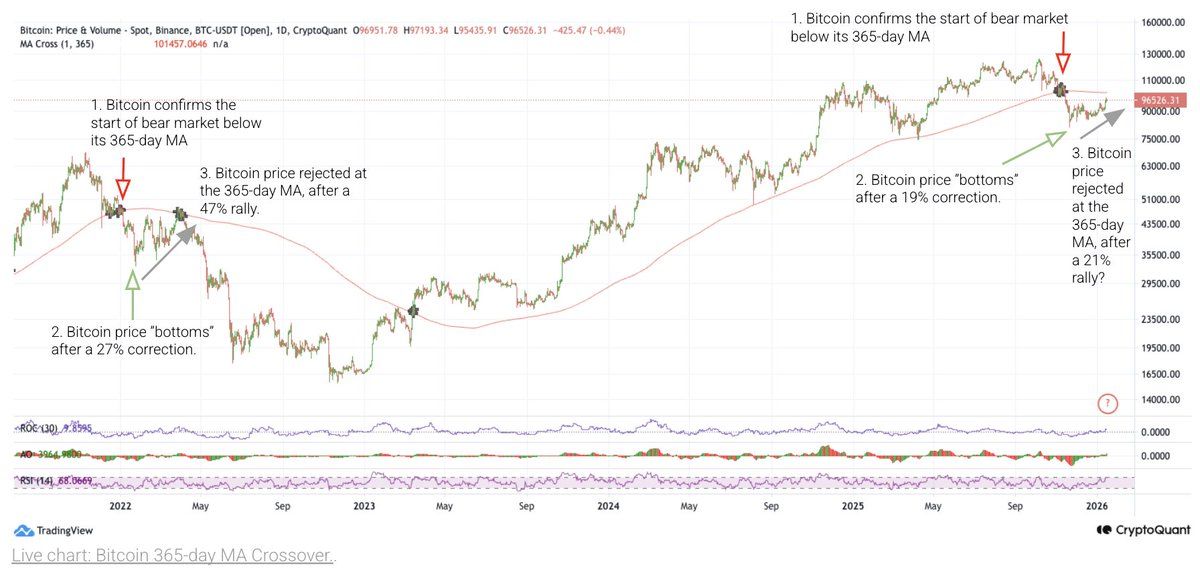
SponsoredSponsored
Analysis from Coin Bureau explains that, at present, Bitcoin’s position below this MA signals that the market is still in bearish conditions.
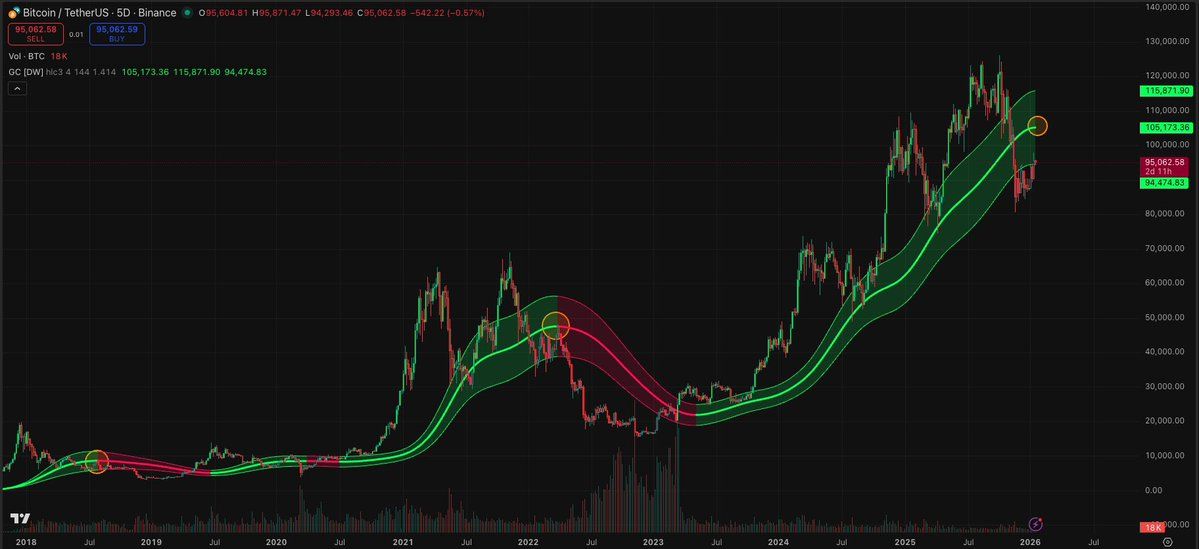
Further technical analysis using the Gaussian Channel on a five-day chart supports these worries. Crypto analyst Raven observed that Bitcoin has lost the channel’s median level.
The post added that losing and failing to retest this level successfully have historically marked the start of a more aggressive phase of bear markets.
“I believe we’re definitely heading toward the $103k zone for a retest, or possibly slightly higher for a liquidity hunt. If we manage to establish and hold support above the median, I’ll let you know. Until then, everything should be considered just a dead cat bounce,” the analyst added.
SponsoredSponsored
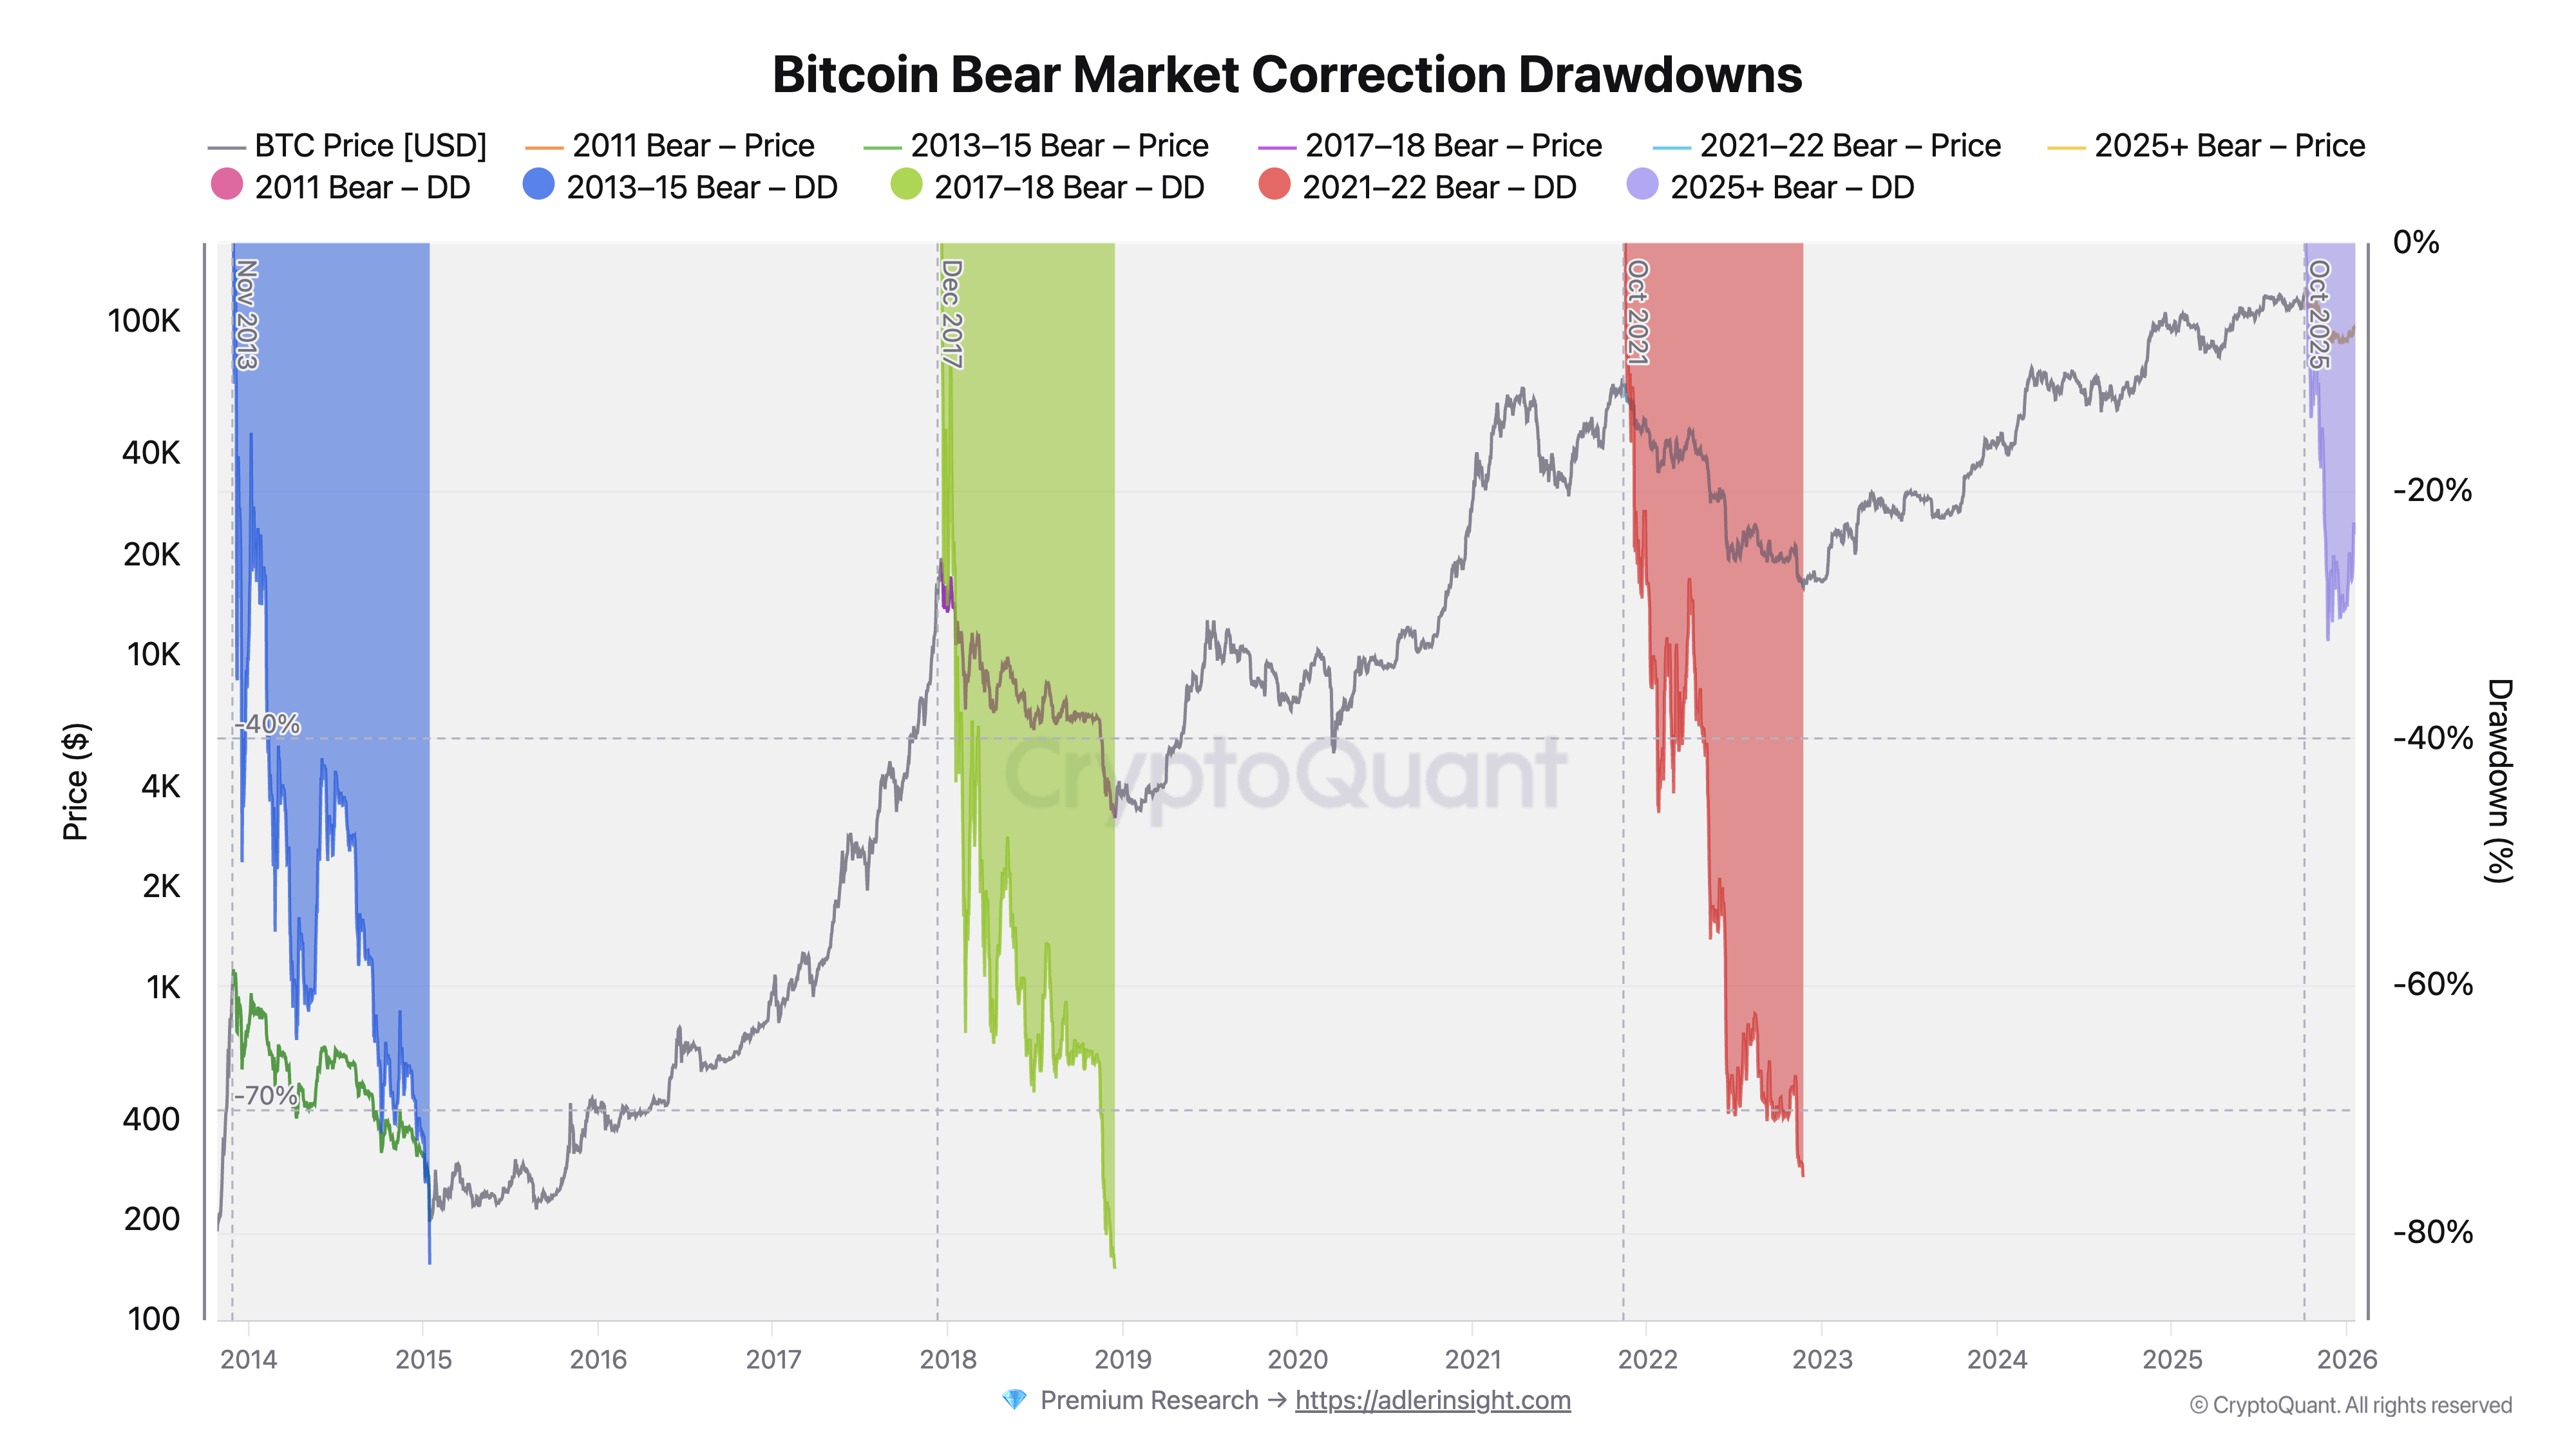
Bitcoin’s price history shows a recurring pattern of sharp declines following cycle peaks. After topping in 2013, Bitcoin fell by about 75.9%, followed by an 81.2% drawdown after the 2017 high and roughly a 74% decline after the 2021 peak.
In the current cycle, however, the pullback has been far more modest, with losses just above 30%, a comparatively small correction by historical standards. This suggests the downturn may be in its early stages, with further drops still possible as the cycle progresses.
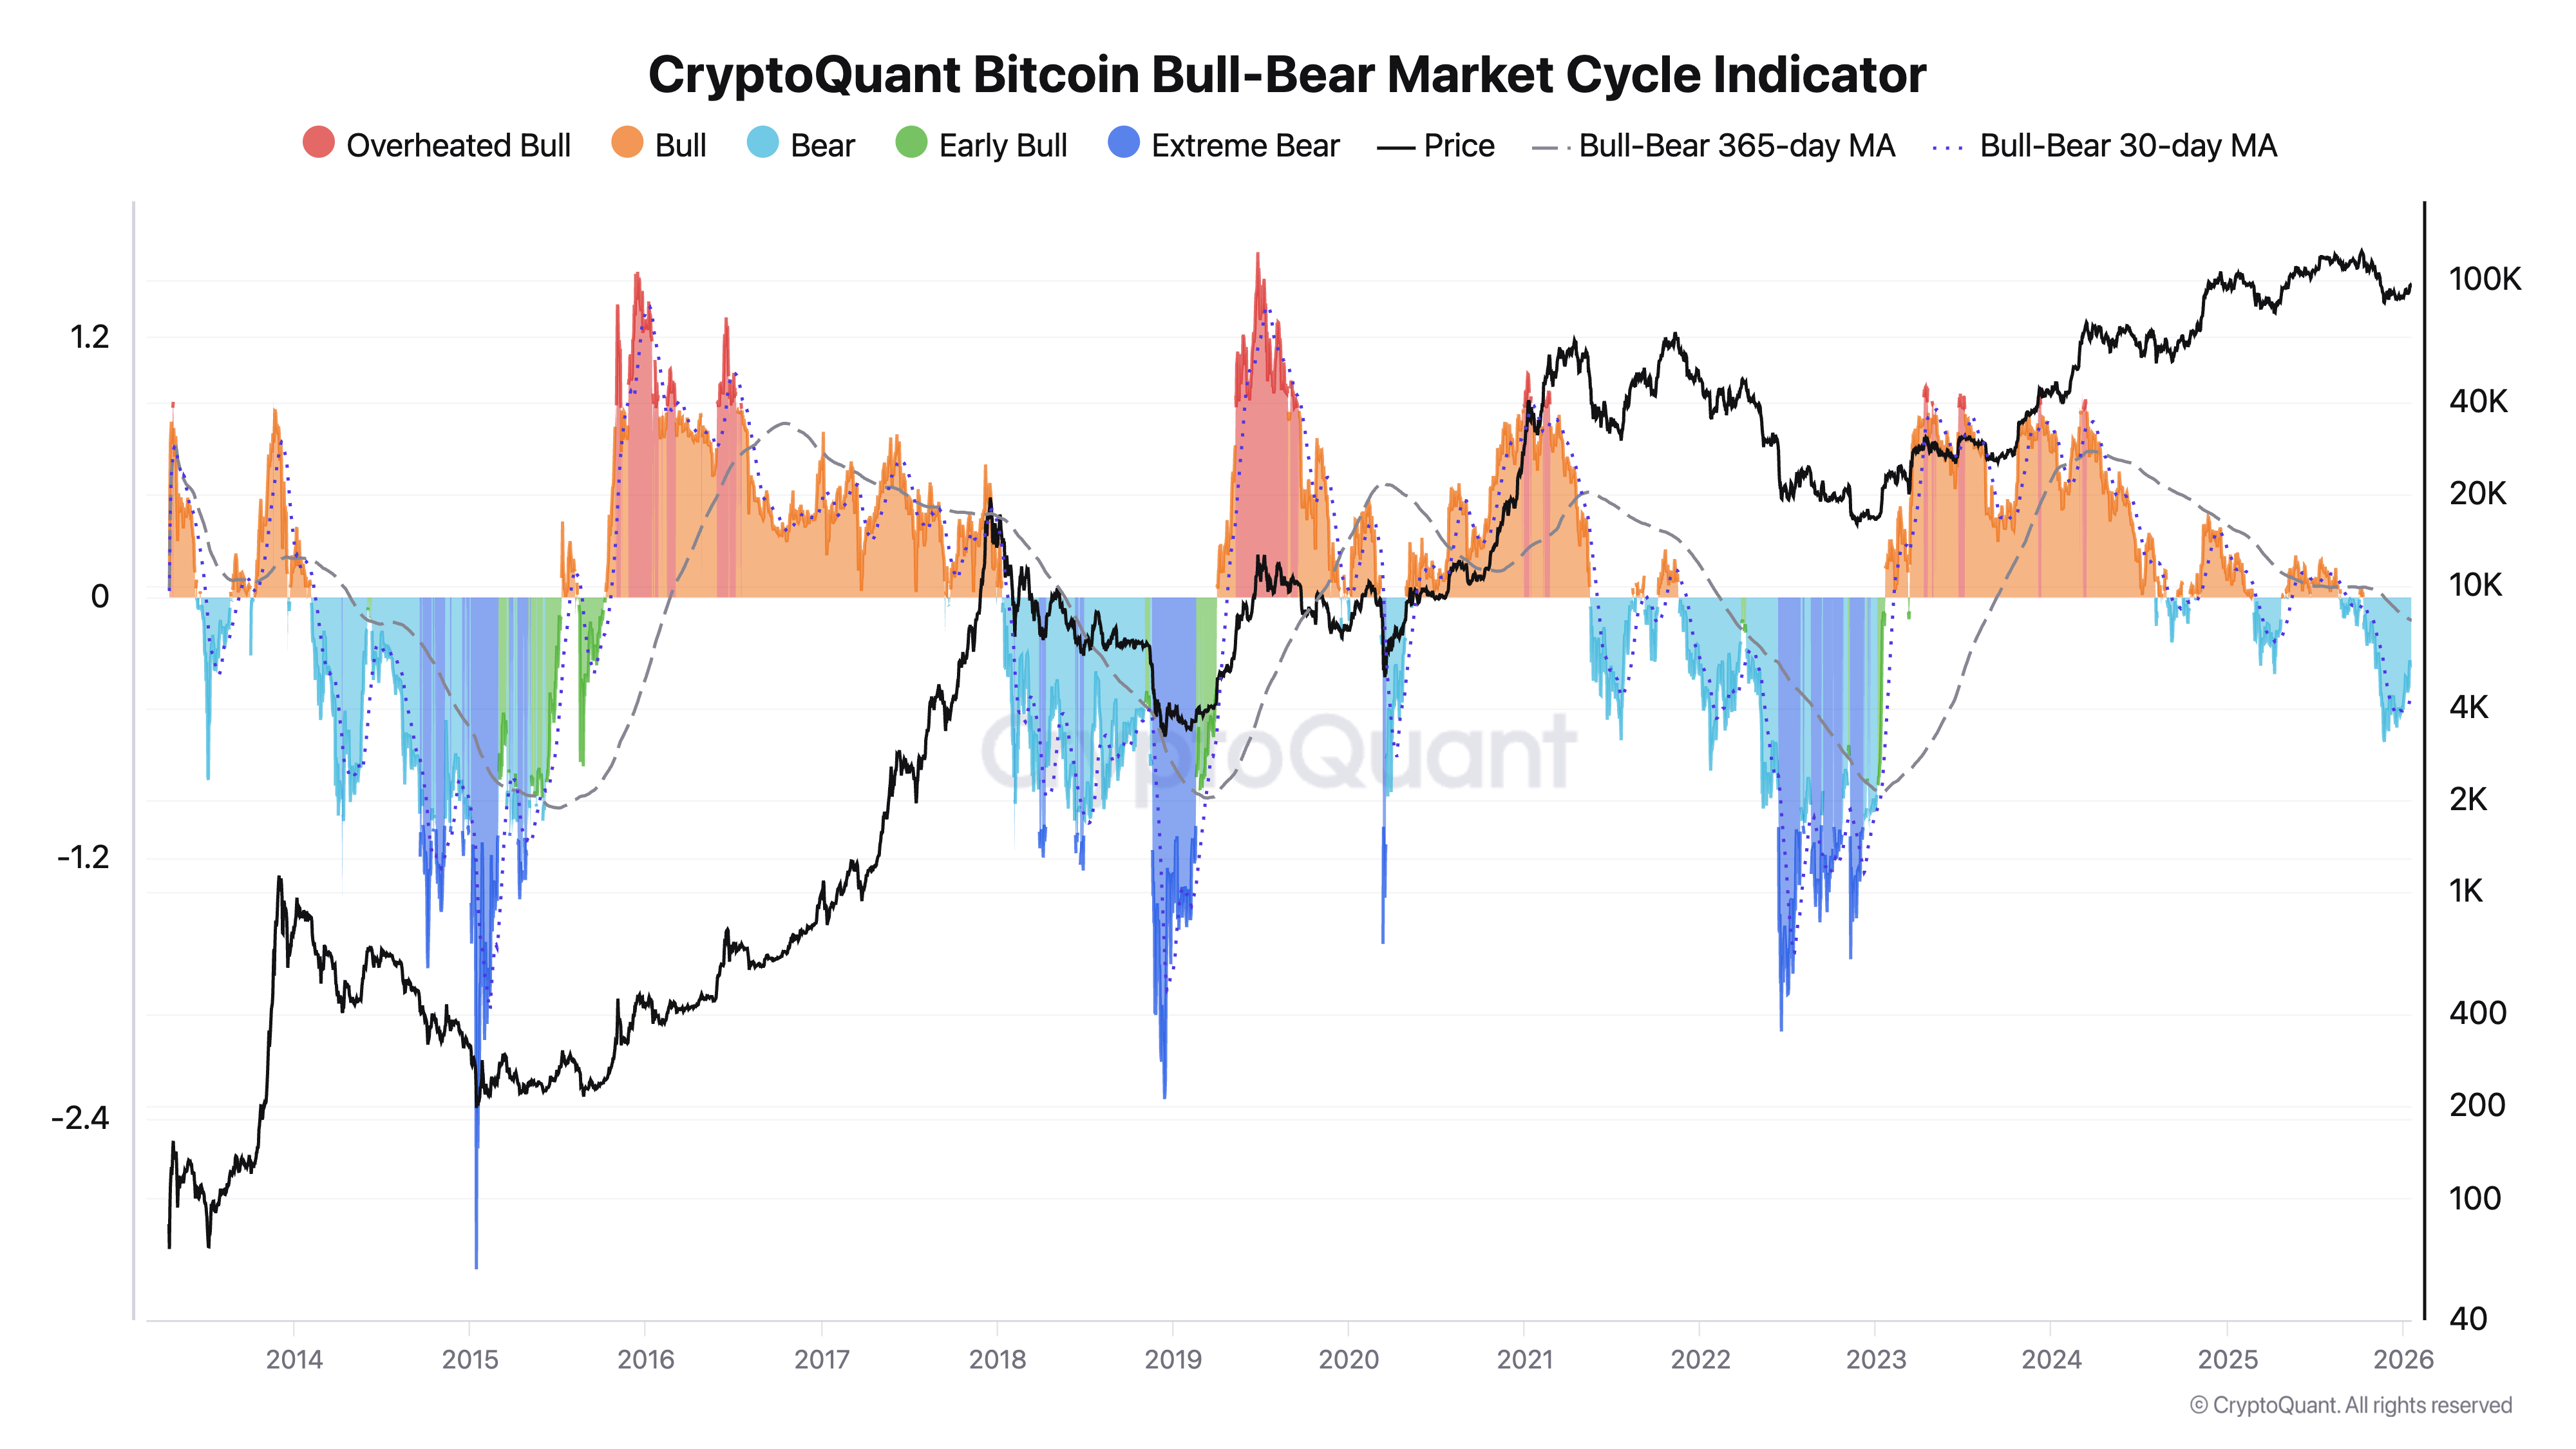
While historical drawdowns focus on price behavior after market tops, broader cycle indicators help assess what the current conditions align with.
The Bull-Bear Market Cycle Indicator, which tracks broader market phases, shows bearish conditions began in October 2025. However, it has not yet moved into an extreme bear phase.
SponsoredSponsored
“By this metric, BTC is in bear market territory, and in every past cycle we’ve extended into the dark-blue zone, which suggests lower levels are still likely. But yeah, be my guest, call for higher! Someone needs to be exit liquidity in the end,” an analyst remarked.
Lastly, on-chain data shows a rise in Bitcoin inflows to exchanges. These inflows are dominated by mid- to large-sized holders, particularly in the 10–100 BTC and 100–1,000 BTC bands.
Increased Bitcoin transfers to exchanges tend to signal growing distribution activity rather than long-term accumulation, as market participants move assets in preparation for potential selling.
“Their activity tends to be more informationally significant than fragmented retail flows, as it reflects strategic decisions rather than noise. From a macro on-chain perspective, the combination of elevated exchange inflows and distribution from larger cohorts suggests that the market is entering a more fragile phase,” an analyst highlighted.
Overall, Bitcoin is showing multiple bear market signals across technical, historical, and on-chain indicators. Still, whether it ultimately follows historical downside patterns or surprises the market with renewed strength remains uncertain.
Search
RECENT PRESS RELEASES
Related Post


