5 Debt and Housing Metrics Investors Should Consider Before Buying S&P 500 Stocks at All-T
October 5, 2025
Lower interest rates will help ease consumer pressures, but a recovery in the housing market could take time.
Investors often view the stock market as a representation of the broader economy. But that’s not entirely true.
Consumer spending is under considerable pressure, as evidenced by underperformance in the consumer discretionary and consumer staples sectors. Restaurant and retail stocks are getting hammered. Earnings at home improvement giants like Home Depot have been ticking down in recent years.
The Federal Reserve’s decision to lower interest rates could be a boon for consumer spending. But don’t expect a recovery overnight. Here are five debt and housing metrics investors may want to pay close attention to, given that the S&P 500 (^GSPC 0.01%) is at an all-time high.

Image source: Getty Images.
Credit card debt and mortgage interest rates are straining consumers
The following chart shows U.S. credit card debt and the 30-year mortgage rate over the last 20 years.
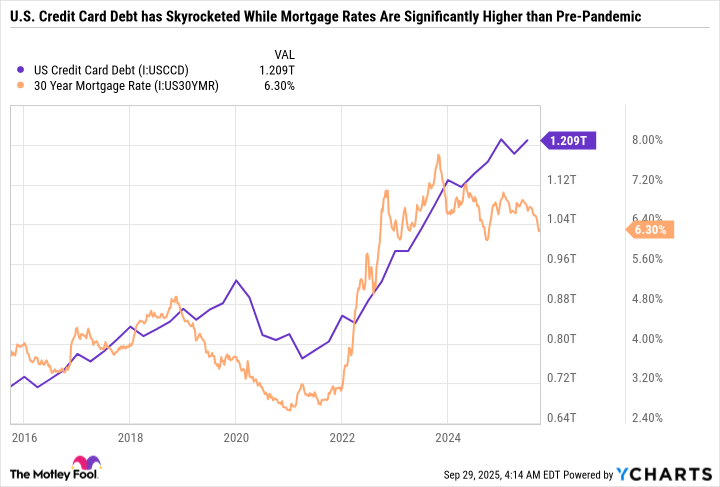
US Credit Card Debt data by YCharts.
Credit card debt was steadily rising leading up to the 2008 financial crisis. But then, mortgage rates and debt fell. Credit card debt rose again during the pandemic, but mortgage rates remained relatively low. Then, they plummeted to multi-decade lows. And those low borrowing costs, paired with government stimulus checks and increased savings rates, led to a sharp decline in consumer spending. The last few years have seen a concerning increase in credit card debt and much higher mortgage interest rates.
Investors can think of a U.S. household’s financial health as similar to assessing a company. A leveraged balance sheet, or in this case, debt, leaves less room to spend. And higher mortgage interest rates make houses less affordable. In fact, there are numerous metrics that suggest the housing market is anticipating a prolonged period of unaffordability.
Housing has become unaffordable for many Americans
Take a look at the 10-year change in three of the most useful metrics for analyzing the housing market.
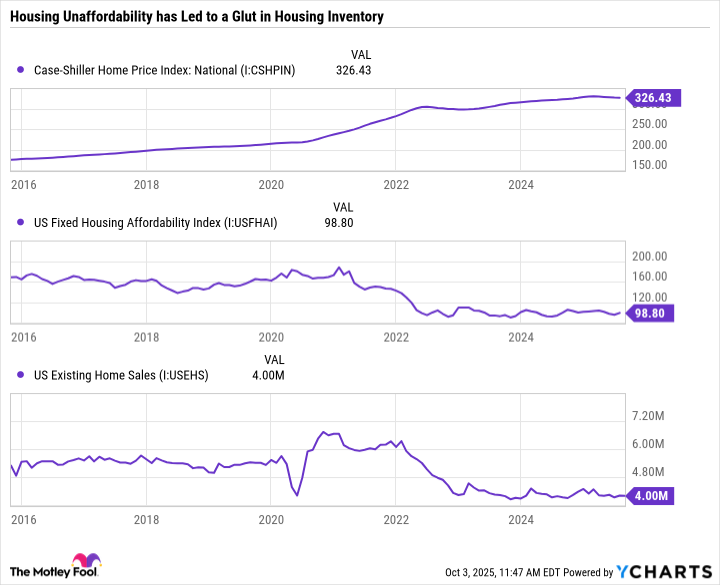
Case-Shiller Home Price Index: National data by YCharts.
The Case-Shiller Housing Index is like the S&P 500 of housing. But instead of tracking the prominence of the largest U.S. companies by market cap, it measures the change in value of single-family homes in the U.S. The index’s elevated level shows that houses are expensive. But it tells only part of the story.
Arguably, what’s more important than housing prices is housing affordability, which is a combination of mortgage rates and home prices. Here’s where the U.S. fixed housing affordability index comes into play. According to the Federal Reserve Bank of St. Louis:
[A] value of 100 means that a family with the median income has exactly enough income to qualify for a mortgage on a median-priced home. An index above 100 signifies that a family earning the median income has more than enough income to qualify for a mortgage loan on a median-priced home, assuming a 20 percent down payment. This index is calculated for fixed mortgages.
The index is currently sitting at 98 and change. Meaning that, on average, a family earning a median income can’t qualify for a home (assuming a 20% down payment) due to a combination of high housing prices and mortgage rates.
As a result, U.S. existing home sales have plummeted, meaning folks are struggling to sell houses at market value.
The stock market is roaring despite consumer weakness
The key takeaway from the discussed debt and housing metrics is that many consumers are carrying higher balances on their credit cards and can’t afford homes. Even if the Fed continues to lower interest rates, it won’t solve these problems overnight. Some consumers may still put off buying homes — and discretionary spending in general — to try to reduce debt and boost savings.
So far, the saving grace has been a strong job market, as evidenced by low unemployment of just 4.3%. Or, put another way, a lot of people have jobs, but aren’t making enough money to afford homes or discretionary goods. So they are taking on debt and delaying homeownership.
These metrics are worth noting because they affect consumer-facing stocks. So, while many restaurant and retail stocks look cheap, these industries are beaten down for good reasons.
Now is a great opportunity to pick up shares in ultra-high-quality consumer discretionary stocks that are built to last. But debt and housing metrics also reinforce why there are two sides of the stock market, and why business-to-business companies are doing so well. Or more specifically, there’s a growing divide between the strength of corporate balance sheets and consumers. Artificial intelligence spending should continue to increase, which could lead to earnings growth and stock market gains, but it may not benefit Americans who aren’t meaningfully participating in the market.
Overall, these debt and housing indicators deserve attention and warrant some concern, given their significant influence on the consumer economy, even if their impact on the stock market is somewhat limited.
Search
RECENT PRESS RELEASES
Related Post


