Impact of environmental factors on atmospheric radon variations at China Jinping Underground Laboratory
December 28, 2024
Abstract
In this study, long-term and continuous monitoring of atmospheric radon concentration, temperature, air pressure, and humidity was conducted at China Jinping Underground Laboratory. The impacts of temperature, humidity, and air pressure on radon concentration in the experimental environment were specifically examined, along with the potential interactions among these factors. Moreover, Radon data were denoised using Singular Spectrum Analysis (SSA) to reveal factors that might influence changes in radon concentration. The possible mechanisms by which these environmental factors influence radon migration have also been explored. This research not only provides new insights into the behavior of radon in underground environments but also offers important references for formulating effective radon management and protective actions.
Introduction
Radon (222Radon) is a colorless, odorless, and tasteless radioactive gas with a half-life of 3.82 days, produced by the decay of uranium in soil, rocks, and water. As a widely present natural radioactive element in the environment, radon and its progeny pose significant health threats to humans. The World Health Organization (WHO) has identified radon as the second leading cause of lung cancer after smoking1,2. It is estimated that 20% of lung cancer deaths worldwide are likely due to radon exposure3, especially in indoor environments where radon concentration can accumulate, thereby increasing health risks4.
The concentration of radon and its variation are mainly influenced by environmental factors, including temperature, humidity, and air pressure. Higher temperatures typically promote the release of radon from the soil, while changes in humidity affect the soil’s water retention capacity, thereby altering radon migration pathways. Jilani and team conducted an analysis involving radon, atmospheric pressure, temperature, and humidity, finding a positive correlation between radon, air pressure, and humidity, and a negative correlation with temperature. Their findings indicated that only a subset of the observed radon anomalies were earthquake-related, with others stemming from different geological and environmental factors5. Spectral decomposition was employed on sequences of radon concentration signals to characterize the diverse processes influencing changes in radon levels6.Additionally, changes in air pressure significantly impact the release rate and migration process of radon by affecting the pressure difference between the underground and the surface. Besides environmental factors, seismic activity can also cause anomalies in radon concentration. Before an earthquake, changes in stress and strain within the Earth’s crust can increase the number of fractures in rock layers, making it easier for radon to escape to the surface. A sinusoidal model was applied to accurately identify the regular seasonal variations in atmospheric radon concentration, aiding in the detection of radon anomalies before earthquakes7. Hwa Oh and Kim investigated the concentrations of 222Rn, precipitation, and temperature in caves, suggesting that radon anomalies might signal large earthquakes8.
Studying radon concentration and its variation patterns is crucial not only for environmental monitoring but also for public health. Systematic analysis of radon concentration data can lead to a better understanding of its variation mechanisms, thereby providing a scientific basis for formulating effective radon exposure control strategies. Moreover, research on radon concentration changes in conjunction with seismic activity can provide auxiliary data for earthquake prediction, enhancing the accuracy of disaster warnings.
In this study, we use singular spectrum analysis (SSA) to systematically analyze the measured radon concentration data, aiming to identify the main influencing factors of radon concentration changes and explore the impact of environmental conditions and seismic activity on radon concentration. This helps to delve deeper into the mechanisms and patterns of radon concentration changes and provides a scientific basis for environmental monitoring and earthquake prediction.
Geological setting
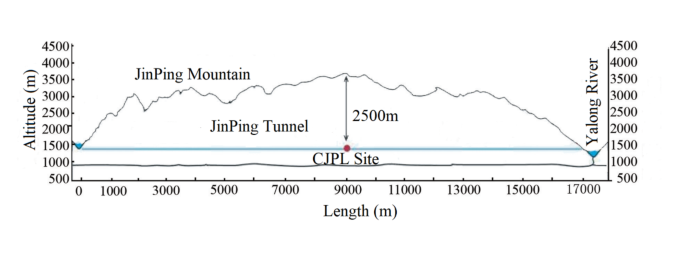
China Jinping Underground Laboratory (CJPL) is located approximately 500 km southwest of Chengdu in Sichuan Province (Fig. 1). As China’s pioneering ultra-deep underground laboratory, CJPL is surrounded by marble, which significantly lowers the levels of primary rock radioactive nuclides compared to normal surface environments in Beijing. This results in exceptionally low cosmic ray intensity and minimal radiation background, making CJPL an ideal platform for fundamental and applied scientific research. Additionally, nestled in the seismically active Qinghai-Tibet Plateau, CJPL is strategically chosen for this study to monitor variations in air radon concentration and environmental parameters.
Materials and methods
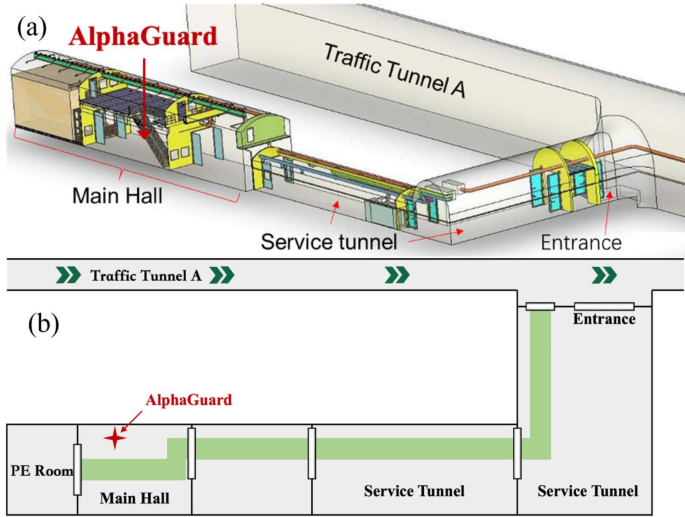
The experimental data were collected by AlphaGUARD PQ2000, which was purchased in 2010 and calibrated by the National Institute of Metrology, China. The measurements were conducted in diffusion mode with a measurement period of 1 h. The instrument was positioned at the center of the Phase I experimental hall of CJPL, 75 cm above the ground, as shown in Fig. 2.
Results and discussion
Environmental effects on radon
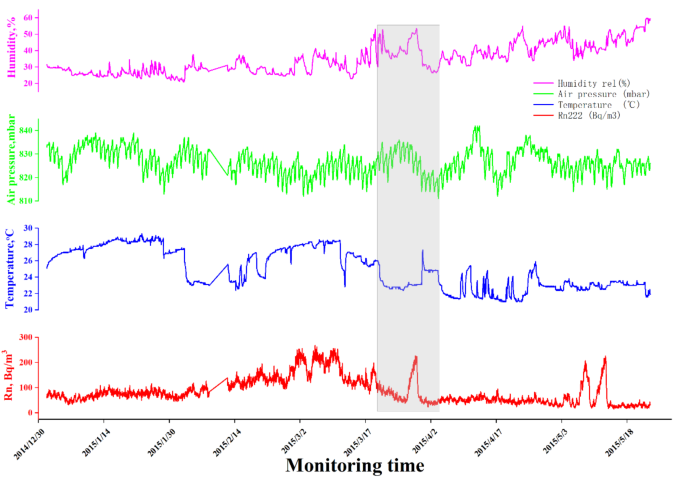
Radon concentration fluctuations owe their variability to a range of factors, encompassing environmental influences such as temperature, pressure, and humidity, including earthquakes volcanic eruptions and other tectonic activities. Accurately identifying radon anomalies as earthquake precursors hinges on differentiating those induced by environmental factors, tectonic activities, or their combined effects. Tareen et al. highlighted the pronounced correlation between radon levels and variables like temperature, pressure, and relative humidity9. Consequently, simultaneous monitoring of radon concentration changes and environmental parameter variations is essential. Figure 3 illustrates the variations in radon concentration, temperature, air pressure, and humidity observed at the CJPL from January 1st to May 24th, 2015. The figure clearly demonstrates the fluctuations in these parameters and the immediate clarity of their interconnections remains absent.
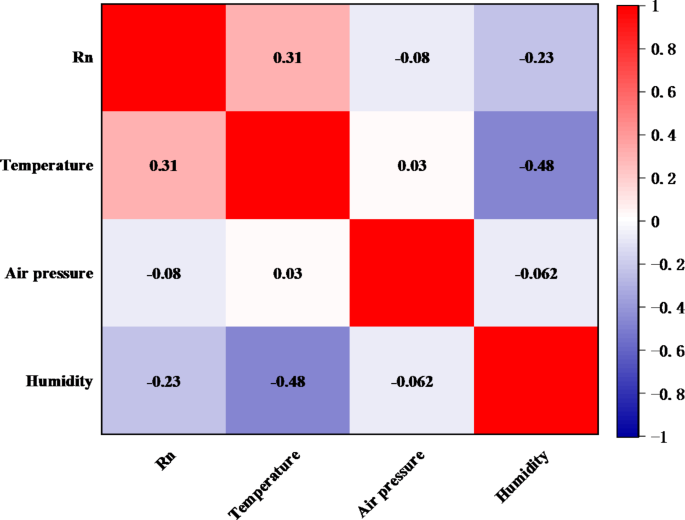
To elucidate the correlations between radon concentrations and each environmental parameter, as well as their autocorrelations, this study conducts comparative analyses of radon concentration variations against temperature, air pressure, and humidity (as shown in Figs. 4, 5 and 6, and Fig. 7). Additionally, the correlation coefficients between these variables are analyzed (presented in Fig. 8), offering a more intuitive depiction of the potential influences of environmental parameters on the variability of radon concentrations.
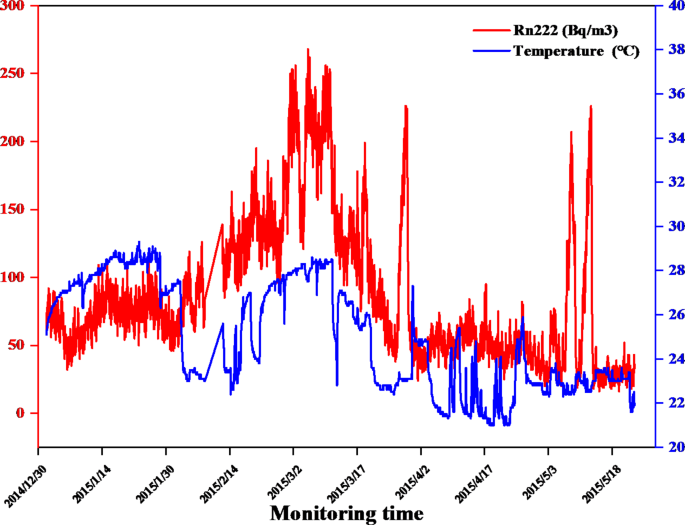
Figure 4 obviously illustrates the correlation between radon concentration and temperature fluctuations. Throughout this timeframe, radon concentration and temperature exhibited a pronounced synchronous positive correlation, with this trend being particularly distinct from January 1st to April 2nd. The parallel trends observed in radon concentration and temperature changes strongly indicate a potential significant positive correlation between these two variables. This finding underscores a critical insight: variations in temperature may exert a considerable influence on the fluctuations observed in radon concentrations. It is generally accepted that temperature significantly affects radon levels10,11. In our study, the correlation analysis between temperature and radon concentration revealed a correlation coefficient of 0.31, as shown in Fig. 8. This is consistent with the findings of Iakovleva et al., who also observed a positive correlation between temperature and radon concentrations12. However, there are studies presenting contrasting views. For instance, Barkat et al. found a negative correlation between radon and temperature13, a conclusion also supported by Singh et al.14.
The relationship between temperature and radon concentration has been extensively explored, yet there remains a divergence of opinions regarding the mechanism by which temperature influences radon concentration. This paper posits that within the marble environment of CJPL, which effectively shields external environmental disturbances, an increase in temperature facilitates the migration of radon from rocks and soil into the air. Therefore, in our experimental setting, a positive correlation between temperature and radon concentration is observed.
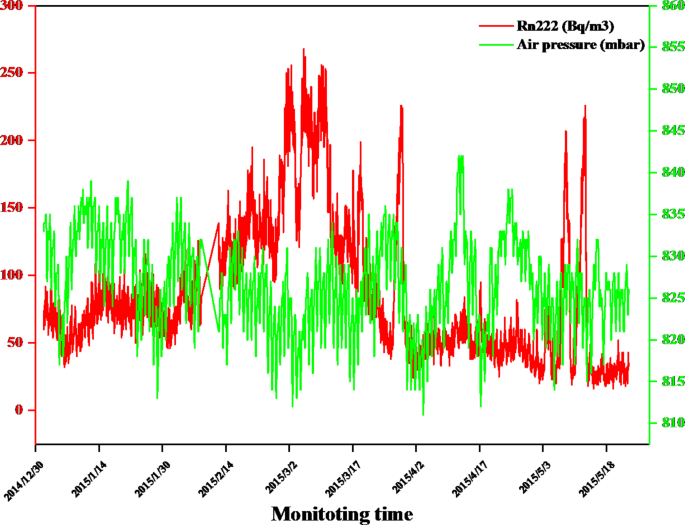
Current discussions on the correlation between radon concentration and atmospheric pressure are diverse. Unlike the significant impact of temperature on radon concentration, the influence of atmospheric pressure appears to be more limited. As depicted in Fig. 5, where the changes in atmospheric pressure occur within a very small range (810–840 mbar), a weak negative correlation seems to exist between atmospheric pressure and radon concentration. In our study, the correlation coefficient between atmospheric pressure and radon concentration is -0.08, as shown in Fig. 8, indicating that under our experimental conditions, the effect of atmospheric pressure on radon concentration is minimal. This finding aligns with Kamra’s measurements in deep boreholes15, suggesting that the apparent impact of atmospheric pressure on radon is actually a pseudo-effect caused by the negative correlation between temperature and pressure. In our experiment, the negative correlation between radon concentration and atmospheric pressure could be attributed to the increased pressure inhibiting the escape of radon from rocks. While some studies argue that pressure does not alter the variations in radon16,17,18, more extensive observations indicate that the influence of atmospheric pressure on radon concentration, though not dominant, should not be overlooked15. Additionally, other research posits that both atmospheric pressure and temperature play significant roles in the variation of radon concentration19,20.
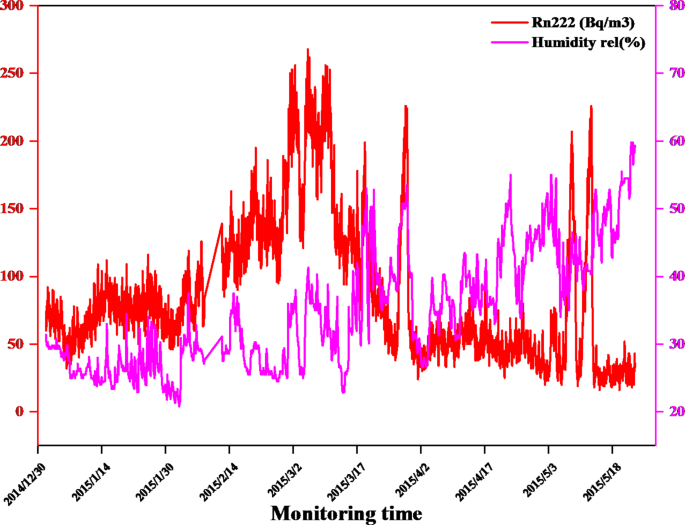
Compared to the weak negative correlation between atmospheric pressure and radon concentration, Fig. 6 demonstrates a more pronounced negative correlation between humidity and radon concentration. However, discussions on the correlation between radon concentration and humidity still present diverse viewpoints. For instance, the study given by21 indicates a negative correlation between soil moisture and radon’s gamma count. They suggest that the saturation of soil or rocks due to rainwater penetration impedes the transport of radon from the soil or rocks to the surface, affecting its movement and distribution. Contrarily14, , observed a significant increase in radon concentration during rainfall, but they did not elaborate on how humidity specifically affects radon concentration. Our measurements suggest that an increase in humidity may inhibit the migration of radon from rocks to air. As shown in Fig. 8, the correlation coefficient between humidity and radon concentration is -0.23, indicating a negative correlation and thereby substantiating that humidity indeed influences radon concentration to a certain extent. Nonetheless, the precise mechanisms by which humidity affects radon concentration require further investigation.
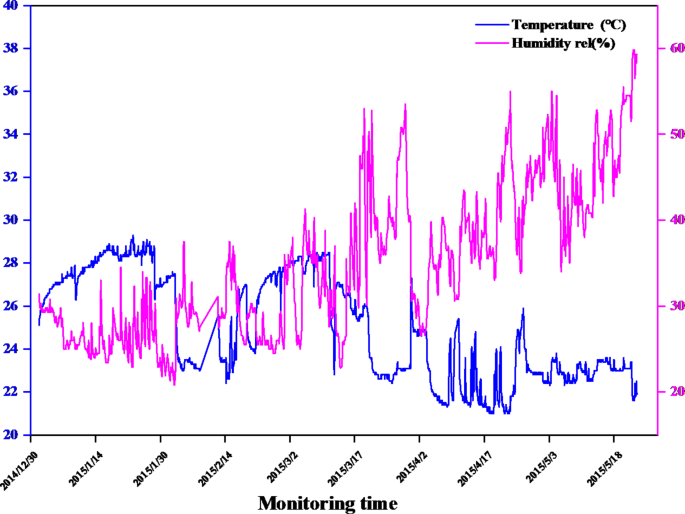
Another crucial aspect to consider is the relationship between temperature and humidity. As illustrated in Fig. 7, a significant negative correlation exists between temperature and humidity, with a correlation coefficient of -0.48, as shown in Fig. 8. An increase in humidity may inhibit the migration of radon from rocks or soil to the air, potentially explaining the observed decrease in radon concentration, a phenomenon known as the capping effect. Conversely, an increase in temperature might lead to evaporation of moisture, facilitating the escape of radon from rocks or soil to the air, a process termed as the rinsing effect22. As indicated in the grey box in Fig. 3, a rise in temperature accompanied by a significant decrease in humidity leads to a sharp increase in radon concentration. The research on the impact of meteorological factors on soil radon concentration also found that an increase in temperature typically results in a rise in radon levels, while an increase in humidity may lead to a decrease in radon concentration23. On the other hand, a decrease in temperature could lead to a reduction in humidity and consequently a decrease in radon concentration. However, it should be noted that sudden changes in radon concentration are not only related to variations in environmental parameters but also be associated with subsurface activities, such as earthquakes.
It is important to highlight that the factors influencing radon concentration changes are numerous and complex in their mechanisms. This study primarily focused on analyzing the instantaneous relationships between temperature, humidity, pressure, and radon concentration changes. To gain a more comprehensive understanding of how these factors affect radon levels, it is essential to consider analyses involving time-lagged variables. Furthermore, examining the indoor-outdoor temperature gradient could provide insights into how environmental conditions impact radon accumulation and release. Additionally, future research will focus on investigating the effects of geological structures and laboratory materials on heat conduction.
Analysis and discussion of SSA results
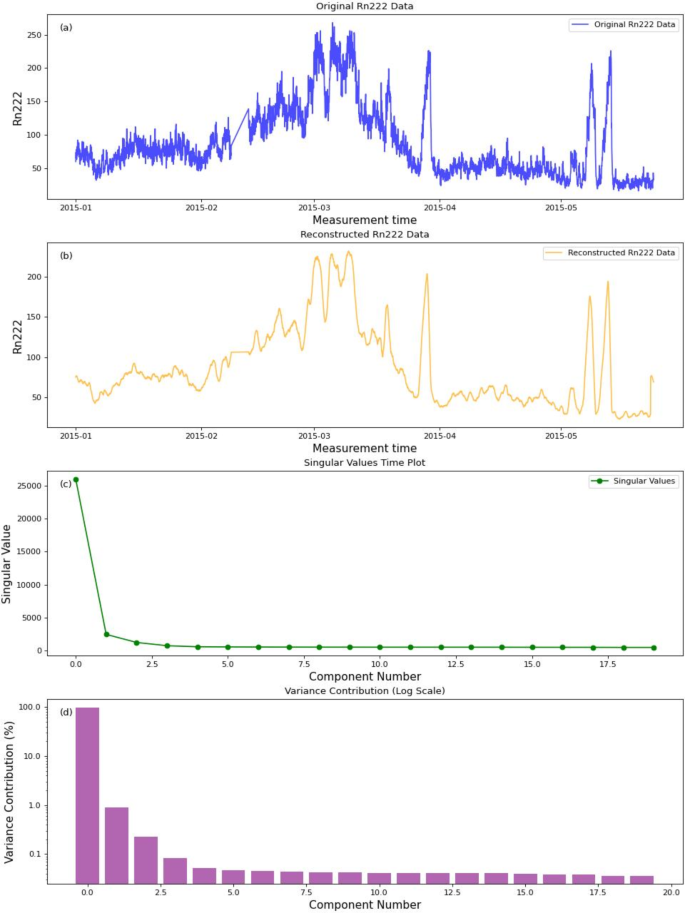
To further investigate the impact of other factors on radon concentration anomalies, this study also applied Singular Spectrum Analysis (SSA) to the measured radon data. The results are presented in Fig. 9.
Figure 9(a) shows the measured radon concentrations from January to May 2015. Significant fluctuations in radon concentration can be observed during the measurement period. These fluctuations may be related to changes in the laboratory environmental conditions, such as daily and seasonal variations in temperature, humidity, and air pressure.
Figure 9(b) shows the radon concentration data reconstructed using SSA. The reconstructed data mainly retains the primary trends and periodic variations from the original data, effectively removing random noise. Compared to the original data, the reconstructed data is smoother and shows more distinct long-term trends and periodic variations. This indicates that the SSA method is effective in extracting the main components and denoising time series data24.
Figure 9(c) presents the singular value distribution of the radon concentration data. Singular values are critical parameters used in SSA to decompose time series data, reflecting the contribution of each component to the original data. From the figure, it can be seen that the first few singular values are significantly larger, indicating that these components dominate the radon concentration data. These main components correspond to the long-term trends and primary periodic variations in radon concentration. As the singular values increase, the contribution rates gradually decrease, corresponding mainly to high-frequency noise in the data.
Figure 9(d) displays the variance contribution rates of each component. The first few components have higher variance contribution rates, further proving their significant impact on the radon concentration data. Specifically, the variance contribution rate of the first component exceeds 90%, indicating that it can explain most of the variations in the original data. The remaining components have relatively low contribution rates, mainly reflecting noise and minor fluctuations in the data.
From the analysis of SSA results, it can be seen that the main factors affecting radon concentration are likely long-term trends and periodic variations, which are effectively captured in the first few components. These variations may include environmental factors such as fluctuations in temperature, humidity, and air pressure. Additionally, seismic activity may also cause anomalies in radon concentration25,26,27. However, due to the limited time span of the monitoring data, further long-term monitoring and data collection are needed to definitively identify the main factors influencing radon concentration.
Through SSA analysis of the radon concentration data, we can effectively extract the primary trends and periodic components in the data while removing random noise. The reconstructed data reveals a clearer pattern of radon concentration changes, and the analysis of singular values and variance contribution rates highlights the impact of the main components on the data. These results demonstrate the strong utility of the SSA method in analyzing and understanding complex time series data. Future research can further combine environmental factors (such as temperature, humidity, and air pressure) and seismic activity to explore the mechanisms and patterns of radon concentration changes, providing a scientific basis for environmental monitoring and earthquake prediction.
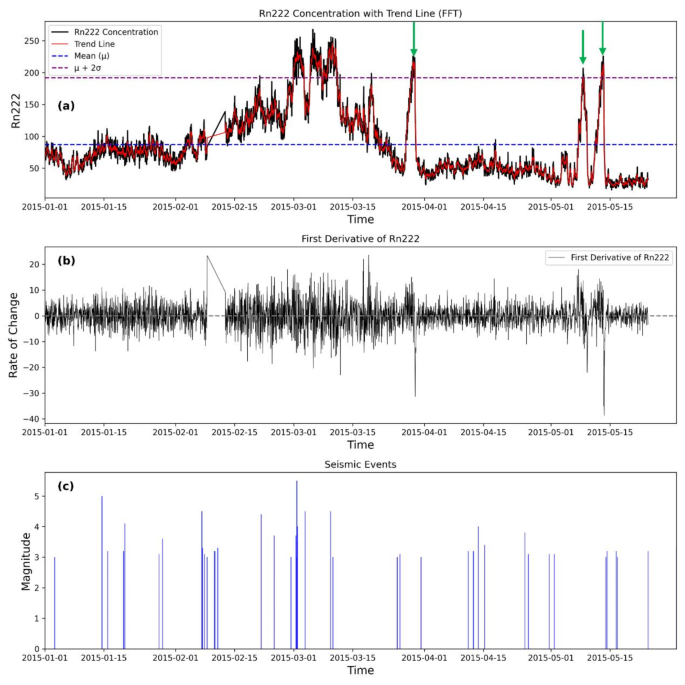
Additionally, the sharp variations in radon concentration may also be influenced by seismic activity. Figure 10(a) illustrates the variation in radon concentration in CJPL. The data proceeded for noise reduction and enhanced using a Fast Fourier Transform (FFT) to present the trend of radon concentration changes more clearly. A statistical standard of µ + 2σ has been used as the threshold for anomalies adopted in this study to identify the reliable radon anomalies. Figure 10(b) presents the first derivative of radon concentration, a key indicator for identifying earthquake precursors. Figure 10(c) and Table 1 (These data are sourced from National Earthquake Data Center.) depicts the recorded seismic events in the Sichuan-Yunnan region. It is evident that at the time points marked by the three green arrows, significant peaks in radon concentration occur, the first derivative exhibits sharp changes, and corresponding seismic events are recorded. The strong correlation among these factors suggests that the dramatic fluctuations in radon concentration may be influenced by seismic activity, which is consistent with findings from other studies that observed increased radon levels before and after earthquakes25,27,28,29.
Conclusion
Our study conducted at CJPL, we successfully shielded external environmental disturbances using the rock mass and conducted long-term continuous monitoring of radon concentration, temperature, atmospheric pressure, and humidity. Our findings revealed several key insights. Firstly, temperature emerges as the primary factor influencing radon concentration, playing a decisive role among all environmental factors. This is likely due to the increase in temperature facilitating the release of radon from rocks and soil, thereby elevating its concentration in the air.
Secondly, although the direct impact of atmospheric pressure on radon concentration appears to be limited, it remains an important factor not to be overlooked. We hypothesize that this could be due to the interplay between temperature and pressure indirectly affecting radon concentration.
Additionally, a negative correlation of -0.23 was observed between humidity and radon concentration, which may be considered a weak factor. This could be attributed to increased moisture in rock and soil pores due to higher humidity levels, which in turn inhibits radon release. Moreover, the notable negative correlation between temperature and humidity adds complexity to the impact of these environmental factors on radon concentration. This relationship might reflect the decrease in humidity due to evaporation at higher temperatures, which in turn affects radon release.
In summary, our research emphasizes the significance of considering the interplay of various environmental factors when analyzing changes in radon concentration. Future studies will further investigate the contributions of environmental factors and seismic activities to radon anomalies at CJPL, aiming to enhance our understanding of radon’s distribution and variations. This could contribute to a deeper understanding of the mechanisms and patterns of radon concentration changes, thereby providing a scientific basis for environmental monitoring and earthquake prediction.
Data availability
The data that support the findings of this study are available from Tsinghua University, but restrictions apply to the availability of these data, which were used under license for the current study, and so are not publicly available. Data are however available from the corresponding authors upon reasonable request and with permission of Tsinghua University.
References
-
Yoon, J. Y., Lee, J. D., Joo, S. W. & Kang, D. R. Indoor radon exposure and lung cancer: a review of ecological studies. Ann. Occup. Environ. Med. 28, 15 (2016).
-
Sethi, T. K., El-Ghamry, M. N. & Kloecker, G. H. Radon and lung cancer. Clin. Adv. Hematol. Oncol. 10, 157–164 (2012).
-
Kim, S. H., Hwang, W. J., Cho, J. S. & Kang, D. R. Attributable risk of lung cancer deaths due to indoor radon exposure. Ann. Occup. Environ. Med. 28, 8 (2016).
-
Nunes, L. J. R., Curado, A. & Lopes, S. I. The relationship between Radon and Geology: sources, transport and indoor Accumulation. Appl. Sci. 13, 7460 (2023).
-
Jilani, Z., Mehmood, T., Alam, A., Awais, M. & Iqbal, T. Monitoring and descriptive analysis of radon in relation to seismic activity of Northern Pakistan. J. Environ. Radioact. 172, 43–51 (2017).
-
Przylibski, T. A., Wyłomańska, A. & Zimroz, R. Fijałkowska-Lichwa, L. Application of spectral decomposition of 222Rn activity concentration signal series measured in Niedźwiedzia Cave to identification of mechanisms responsible for different time-period variations. Appl. Radiat. Isot. 104, 74–86 (2015).
-
Hayashi, K. et al. Normal seasonal variations for atmospheric radon concentration: a sinusoidal model. J. Environ. Radioact. 139, 149–153 (2015).
-
Hwa Oh, Y. & Kim, G. A radon-thoron isotope pair as a reliable earthquake precursor. Sci. Rep. 5, 13084 (2015).
-
Tareen, A. D. K. et al. Descriptive analysis and earthquake prediction using boxplot interpretation of soil radon time series data. Appl. Radiat. Isot. 154, 108861 (2019).
-
Papachristodoulou, C., Stamoulis, K. & Ioannides, K. Temporal Variation of Soil Gas Radon Associated with seismic activity: a Case Study in NW Greece. Pure Appl. Geophys. 177, 821–836 (2020).
-
Richon, P., Perrier, F., Pili, E. & Sabroux, J. C. Detectability and significance of 12 hr barometric tide in radon-222 signal, dripwater flow rate, air temperature and carbon dioxide concentration in an underground tunnel. Geophys. J. Int. 176, 683–694 (2009).
-
Iakovleva, V. S. & Ryzhakova, N. K. Spatial and temporal variations of radon concentration in soil air. Radiat. Meas. 36, 385–388 (2003).
-
Barkat, A. et al. Time series analysis of soil radon in Northern Pakistan: implications for earthquake forecasting. Appl. Geochem. 97, 197–208 (2018).
-
Singh, S., Jaishi, H. P., Tiwari, R. P. & Tiwari, R. C. Time Series Analysis of Soil Radon Data using multiple Linear regression and Artificial neural network in Seismic Precursory studies. Pure Appl. Geophys. 174, 2793–2802 (2017).
-
Kamra, L. Seasonal emanation of radon at Ghuttu, northwest Himalaya: differentiation of atmospheric temperature and pressure influences. Appl. Radiat. Isot. 105, 170–175 (2015).
-
Richon, P. et al. Spatial and time variations of radon-222 concentration in the atmosphere of a dead-end horizontal tunnel. J. Environ. Radioact. 78, 179–198 (2005).
-
Steinitz, G., Piatibratova, O. & Barbosa, S. M. Radon daily signals in the Elat Granite, southern Arava, Israel. J. Geophys. Res. 112, B10211 (2007).
-
Weinlich, F. H. et al. Seismically induced variations in Mariánské Lázně fault gas composition in the NW Bohemian swarm quake region, Czech Republic — a continuous gas monitoring. Tectonophysics 421, 89–110 (2006).
-
Barbosa, S. M., Steinitz, G., Piatibratova, O., Silva, M. E. & Lago, P. Radon variability at the Elat granite, Israel: Heteroscedasticity and nonlinearity: RADON HETEROSCEDASTICITY AND NONLINEARITY. Geophys. Res. Lett. 34, (2007).
-
Perrier, F., Richon, P., Crouzeix, C., Morat, P. & Le Mouël, J. L. Radon-222 signatures of natural ventilation regimes in an underground quarry. J. Environ. Radioact. 71, 17–32 (2004).
-
Barbosa, S., Huisman, J. A. & Azevedo, E. B. Meteorological and soil surface effects in gamma radiation time series – implications for assessment of earthquake precursors. J. Environ. Radioact. 195, 72–78 (2018).
-
Arora, B. R. et al. Assesment of the response of the meteorological/hydrological parameters on the soil gas radon emission at Hsinchu, northern Taiwan: a prerequisite to identify earthquake precursors. J. Asian Earth Sci. 149, 49–63 (2017).
-
Fujiyoshi, R. et al. Meteorological parameters contributing to variability in 222Rn activity concentrations in soil gas at a site in Sapporo, Japan. Sci. Total Environ. 370, 224–234 (2006).
-
Itoh, N. & Marwan, N. An extended singular spectrum transformation (SST) for the investigation of Kenyan precipitation data. Nonlinear Process. Geophys. 20, 467–481 (2013).
-
Ghosh, D., Deb, A. & Sengupta, R. Anomalous radon emission as precursor of earthquake. J. Appl. Geophys. 69, 67–81 (2009).
-
Huang, P., Lv, W., Huang, R., Luo, Q. & Yang, Y. Earthquake precursors: a review of key factors influencing radon concentration. J. Environ. Radioact. 271, 107310 (2024).
-
Woith, H. Radon earthquake precursor: a short review. Eur. Phys. J. Spec. Top. 224, 611–627 (2015).
-
Deb, A., Gazi, M., Ghosh, J., Chowdhury, S. & Barman, C. Monitoring of soil radon by SSNTD in Eastern India in search of possible earthquake precursor. J. Environ. Radioact. 184–185, 63–70 (2018).
-
Sozbilir, H. Radon Monitoring as the Earthquake Precursor in Fault Line in Western Turkey. (2011).
Acknowledgements
This study was financially supported by the National Natural Science Foundation of China (42274235, 41774134), Doctor Start-up Fund of East China University of Technology (DNBK2019086) and Provincial-level College Students’ Innovation and Entrepreneurship Training Program Project at East China University of Technology (S202210405010). Additionally, special thanks are given to Professor Zhi Zeng from Tsinghua University for providing the radon measurement data.
Author information
Authors and Affiliations
Contributions
P.H. wrote the manuscript text. L.W. prepared Figs. 1, 8, 9 and 10. R.H. was responsible for data investigation and prepared Figs. 2, 3, 4, 5, 6 and 7. Y.F. provided data and analysis. Q.L. and C.Y. provided resources. Y.Y. reviewed the manuscript.
Corresponding author
Ethics declarations
Competing interests
The authors declare no competing interests.
Additional information
Publisher’s note
Springer Nature remains neutral with regard to jurisdictional claims in published maps and institutional affiliations.
Rights and permissions
Open Access This article is licensed under a Creative Commons Attribution-NonCommercial-NoDerivatives 4.0 International License, which permits any non-commercial use, sharing, distribution and reproduction in any medium or format, as long as you give appropriate credit to the original author(s) and the source, provide a link to the Creative Commons licence, and indicate if you modified the licensed material. You do not have permission under this licence to share adapted material derived from this article or parts of it. The images or other third party material in this article are included in the article’s Creative Commons licence, unless indicated otherwise in a credit line to the material. If material is not included in the article’s Creative Commons licence and your intended use is not permitted by statutory regulation or exceeds the permitted use, you will need to obtain permission directly from the copyright holder. To view a copy of this licence, visit http://creativecommons.org/licenses/by-nc-nd/4.0/.
About this article
Cite this article
Huang, P., Lv, W., Huang, R. et al. Impact of environmental factors on atmospheric radon variations at China Jinping Underground Laboratory.
Sci Rep 14, 31402 (2024). https://doi.org/10.1038/s41598-024-82936-0
-
Received: 19 August 2024
-
Accepted: 10 December 2024
-
Published: 28 December 2024
-
DOI: https://doi.org/10.1038/s41598-024-82936-0
Keywords
Search
RECENT PRESS RELEASES
Related Post
