Evolution of the Asian summer monsoon and regional karst ecological environment since the middle ages in Southwest China
March 8, 2025
Abstract
The frequent droughts and floods, closely associated with the Asian summer monsoon (ASM), has profoundly affected the ecological environment and economy in East Asia. While changes in the ASM are closely related to precipitation patterns, the specific mechanism still requires further investigation. This study utilized stalagmite records from the Feilong Cave in southwest China to reconstruct the evolution of the ASM since the Medieval Warm Period (MWP). The results indicated that the ASM strengthened during the MWP and weakened during the Little Ice Age (LIA), with changes in monsoon intensity primarily driven by solar activity and variations in tropical ocean-atmosphere circulation. Different phase combinations of the Atlantic Multidecadal Oscillation, and the Pacific Decadal Oscillation also influenced on the variations of the ASM. During the MWP, with warming of the northern hemisphere landmasses, the ASM intensified, enhancing the long-range transport of moisture from the southwest (Indian summer monsoon), leading to northward shifts of the rain belt in the eastern monsoon region in China and increased precipitation in northern China. Conversely, during the LIA, cooling of the northern hemisphere landmasses led to a weakening of the ASM and reduced southwest moisture transport, resulting in southward shifts of the rain belt in the eastern monsoon China and increased precipitation in southern China. Additionally, the abnormal southward shift of the Western Pacific Subtropical High led to prolonged retention of the rain belt in southern China, causing an increase in monsoonal rainfall in southern China. Comparison with monsoonal Chinese terrestrial proxy records reveals an antiphase relationship between northern and southern parts of the eastern China. During the MWP, the counterparts showed a “wet north-dry south� pattern, while during the LIA, a “wet south-dry north� pattern emerged. Furthermore, proxy records suggest that human activities exacerbated the deterioration of karst ecological environment in southwest China since the Middle Ages.
Introduction
Global warming significantly impacts human habitats and socio-economic advancements, with its underlying causes encompassing both natural phenomena and human endeavors1. To fully grasp these impacts, it is indispensable to explore the intricate patterns of climate under natural conditions. Climate research, particularly studies that focus on the Asian summer monsoon, furnishes indispensable scientific evidence to this end. More specifically, the monsoon China,—is indicated to the eastern China where was affected by the Asian summer monsoon, characterized by the seasonal reversal of winds and the corresponding precipitation patterns, which have a profound influence on China’s climate dynamics2. By meticulously studying the natural variability of the monsoon system and its potential responsiveness to global warming, we can formulate and implement countermeasures to mitigate the potential perils posed by global warming to human society and economic prosperity1.
During the period of 1000–1200 AD, there was a pronounced warm period in many parts of the world, known as the Medieval Warm Period (MWP)3. Subsequent research has found that the time span of the MWP can be extended to 800–1300 AD4. Some scholars also refer to the MWP as the Medieval Climate Anomaly (MCA)4. The Little Ice Age (LIA) was a typical cold climate period lasting several hundred years between the MWP and the modern warm period5, covering period from 1300 to 1900 AD6, although the start and end times of the LIA varied in different regions. The MWP and LIA, as the most recent global/hemispheric-scale warm and cold periods, have attracted great attention from the community of paleoclimate research7.
Studying the climatic characteristics and mechanisms of the MWP helps in understanding the natural background of contemporary climate warming, providing historical analogs for predicting future climate change8. The variation in the intensity of the Asian summer monsoon (ASM) is closely related to the spatial distribution pattern of precipitation in the eastern monsoon region of China9. Geological records indicated that during the MWP, there was relatively more precipitation in northern China and less in the Yangtze River basin10,11. Evidence from paleosols, pollen, and sediments in rivers and lakes revealed the widespread development of paleosols or river-lake sedimentations in the North China Sand Area from 600 to 1400 AD, indicating a warm and humid climate in northern China12. Reconstructions of precipitation in the Yangtze River basin based on diatom and pollen records showed that during most periods of the MWP (840–1000 AD and 1100–1300 AD), there were significant droughts13.
The reconstruction results based on tree rings, stalagmites, and lake sediments indicated a “wet south-dry north� precipitation pattern in the East Asian monsoon region during the LIA14. That is, south of the Huai River (34° N), the climate was generally wet, while north of it was dry14. However, stalagmite δ18O records show a “cold-dry� pattern in the middle reaches of the Yangtze River during the LIA15, which is inconsistent with the “wet south-dry north� pattern. This indicated that there were differences in climate change in southern China during the LIA, possibly exhibiting both “cold-dry� and “cold-wet� climate patterns, rather than a consistent “cold-wet� pattern. Therefore, due to the spatial and temporal differences induced by different proxy indicators in reconstructions, climate interpretations, and representative regional ranges, maybe result in discrepancy in the reconstructed climate (dry-wet conditions).
Furthermore, climate simulations indicated that the ASM strengthened during the MWP, with a significant increase summer precipitation in the north of the Yangtze River relative to the mean for the period of 1000–1100 AD compared to 800–1250 AD; while there was a significant decrease in the southern region16, showing a “south drought-north flood� pattern in China. During the LIA, the ASM weakened, and the hydroclimate change in the monsoon China exhibited an overall “south flood-north drought� pattern14.
The regional disparities in precipitation patterns and their interactions with ASM variations, topographical factors, and other climate systems remain important research topics. Although studies have shown the close relationship between the variation of the ASM and precipitation patterns, further investigation is needed into the specific mechanisms of this connection, such as the role of the Atlantic Multidecadal Oscillation (AMO), Pacific Decadal Oscillation (PDO), and internal climate variability17,18.
In this study, based on precise 230Th dating and high-resolution δ18O and δ13C records from Feilong Cave in southwestern China, combined with paleoclimate data, we discussed the climate changes in the monsoon region of China from 665 to 1815 AD, aiming to deeply investigate the hydroclimate modes and the mechanisms in the monsoon region of China during the MWP and the LIA. It mainly addressed the following specific scientific issues: (1) The evolution process and driving mechanisms of the ASM since the MWP; (2) The north-south precipitation patterns in the monsoon region of China on decadal to centennial scales since the MWP; (3) Using δ13C records of stalagmites to explore the impact of human activities and climate change on the karst ecological environment in southwest China.
Location and geography background
Feilong Cave (FL) is located in Guizhou Province, southwest China (24°58′13″ N, 104°52′54″ E, 1357 m above sea level) (Fig. 1A), which is developed in the Triassic dolomitic limestone. The vegetation over the cave is composed of small shrubs and herbaceous plants. The natural entrance of the cave is 8 m high and 28 m wide, and the entire length of the cave is approximately 1000 m. The cave temperature remains around 15 °C throughout the year19.
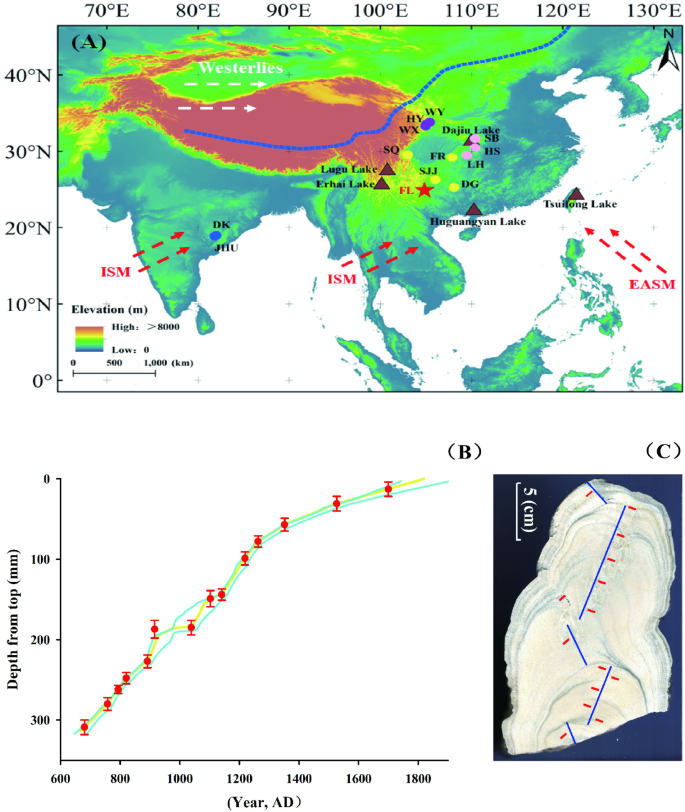
Feilong Cave and geographic location map of other records, as well as FL2102 stalagmite profile maps and Mod-Age dating models. (A) Geographical location maps of the Feilong Cave and other records. The red pentagram represents the Feilong Cave in this study, brown triangles represent lake records, and circles represent stalagmite records (purple circles in North China, yellow circles in South China, pink circles in the middle and lower reaches of the Yangtze River, and blue circles in the Indian monsoon regions). 1 Feilong Cave (FL; this study); 2 Shijiangjun Cave (SJJ)57; 3 Dongge Cave (DG)32; 4 Furong Cave (FR)49; 5 Shenqi Cave (SQ)30; 6 Huangye Cave (HY)54; 7 Wanxiang Cave (WX)55; 8 Wuya Cave (WY)56; 9 Sanbao Cave (SB)58; 10 Heshang Cave (HS)15; 11 Lianhua (LH)59; 12 Dandak Cave (DK)60; 13 Jhumar Cave (JHU)61; 14 Tsuifong Lake68; 15 Huguangyan Lake69; 16 Dajiu Lake70; 17 Lugu Lake71; 18 Erhai Lake72. The red dashed arrows represent the East Asian summer monsoon and the Indian summer monsoon, and the white dashed arrows represent the westerlies. The blue dashed line represents the boundary between the monsoon and non-monsoon regions in China2. (B) Stalagmite FL2102 age model diagram25. The yellow solid line represents the modeled age, the two light blue solid lines represent the 95% confidence interval, and the red dots and error bars represent the age and error (2σ) of each age sample, respectively. (C) Stalagmite FL2102 profile. The blue bands represent the sampling path of carbon and oxygen isotopes, and the red short bars indicated the locations for 230Th dating samples.
The region is influenced by the ASM, with precipitation mainly from the Indian Ocean and the Pacific Ocean, belonging to a subtropical monsoon humid climate. The annual average temperature and precipitation is 16.1 °C and 1532 mm, respectively. The precipitation from May to October, accounts for 80% of the annual precipitation19.
Sample and methods
FL2102 is a cylindrical stalagmite made of aragonite, featuring a diameter of 146 mm at the base and 85 mm at the top. The total length measured along its growth axis is 315 mm (Fig. 1C). Fourteen powder samples (50–100 mg) were drilled along the growth axis using a 1 mm diameter dental drill for 230Th dating, following the method outlined by Shen et al.20 and Cheng et al.21. Uranium and thorium were chemically separated according to the procedures described by Edwards et al.22 and Shen et al.20. 230Th dating was conducted at the Isotope Laboratory of the Institute of Global Environmental Change, Xi’an Jiaotong University, using a multi-collector inductively coupled plasma mass spectrometer (MC-ICP-MS). The decay constants used were 9.1705 × 10−6a−1 for 230Th, 2.82206 × 10−6a−1 for 234U21, and 1.55125 × 10−10a−1 for 238U23. The initial 230Th ages were corrected using a mean crustal 230Th/232Th ratio of (4.4 ± 2.2)×10−624. Uncertainties in the U-Th isotopic data and 230Th dates, relative to 1950 AD (yr BP), are given at the two-sigma (2σ) level or two standard deviations of the mean (2σm) unless otherwise noted.
After polishing of the sliced surface, 630 samples were drilled from the growth center axis of stalagmite FL2102 at intervals of 0.5 mm using a dental drill with a diameter of 0.5 mm. Their δ18O and δ13C analyses were performed by Tianjin Createch Testing Technology Co., Ltd. using Nu Instruments’ Nu Carb and Perspective instruments. Standard samples, GBW04405 and NBS-18, were bracketed every 15 samples, and parallel samples were inserted every 20 samples. The samples reacted with anhydrous phosphoric acid in vials to produce CO2 gas under 70 °C conditions, which was purified by the instrument’s purification system before analysis on a gas stable isotope mass spectrometer. The results were reported relative to the Vienna-Pee Dee Belemnite (V-PDB) standard, with errors of ± 0.08‰ for δ18O and ± 0.06‰ for δ13C.
This study selected 17 additional high-resolution paleoclimate records from the Asian monsoon area for comparison. The records included δ18O, δ13C from stalagmites, diatoms, total organic carbon (TOC) from lake sediments, and grain size-five key types of records that reflected the intensity of the ASM and its associated precipitation changes. Among these, 12 paleoclimate records, including the δ18O record from Huangye Cave, were downloaded from the National Oceanic and Atmospheric Administration (NOAA) (https://www.ncei.noaa.gov/access/paleo-search/), and all the δ18O records had undergone Z-scores analysis. When the δ¹�O value fell below zero, it signified a negative deviation, indicative of a strengthened Asian summer monsoon; when the δ¹�O value increased above zero, it implied a positive deviation, indicative of a weakened Asian summer monsoon. While the other five records were provided by the authors of the literatures. To better highlight the patterns of ASM changes since the Middle Ages, the selected records covered the period of the MWP (800–1300 AD) and the LIA (1300–1900 AD).
Results
The 238U concentration range of stalagmite FL2102 is 15.661–49.977 ppm, and the 232Th concentration range is 115–545 ppt (Table 1). The age error of the majority of sub-samples (11/14) is less than 10 years. All age data conform to the sedimentary sequence. Utilizing Mod-Age software25, a chronology model for stalagmite FL2102 was established (Fig. 1B), indicating the stalagmite growth occurred between 1285 - 135 yr BP (665–1815 AD).
The δ18O range of stalagmite FL2102 is −8.8‰ to −7.1‰, with an average of −8.0‰. During the period of 1285-135 yr BP (665–1815 AD), δ18O is generally positively biased. A total of 10 climatic events have been identified based on the principle that positive deviation of δ18O greater than 0.5‰ are arbitrarily defined as a climate event. The duration of these events is approximately 30–110 years. The δ13C range of stalagmite FL2102 is from − 6.6 to 0.2‰, with an average of −4.5‰. The overall trends of δ18O and δ13C are consistent, with a significant positive correlation (r = 0.630; p < 0.01; n = 630) (Fig. 2).
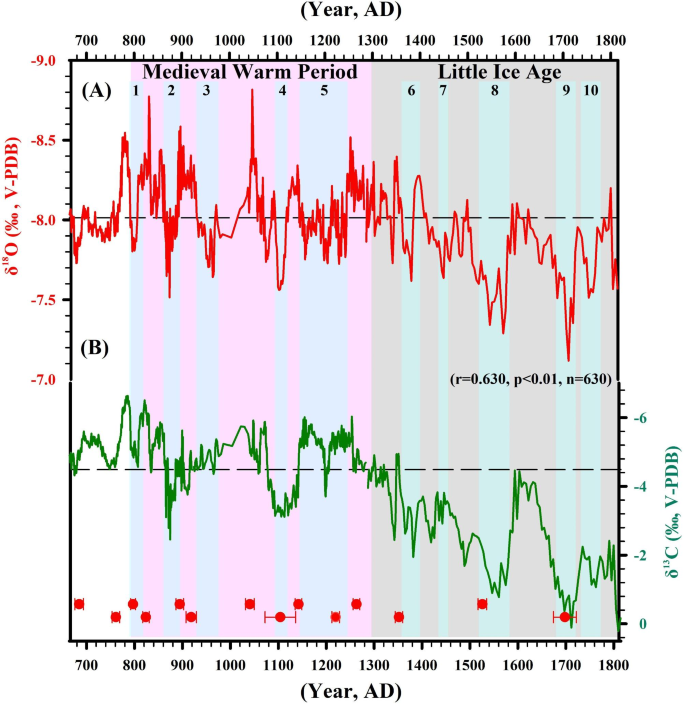
The oxygen and carbon isotope records of stalagmite FL2102. (A) The red solid line represents the δ18O record, while the black dashed line indicates the average of δ18O. (B) The green solid line represents the δ13C record, while the black dashed line indicates the average of δ13C. The red dots and error bars at the bottom represent the 230Th dating results and their errors. The cyan bands 1–10 represent 10 significant weak summer monsoon events in the δ18O record of stalagmite FL2102. The pink and gray bands respectively represent the Medieval Warm Period and the Little Ice Age. The δ18O and δ13C values are significantly positively correlated (r = 0.630; p < 0.01; n = 630).
Discussion
Significance of the stalagmite δ18O and δ13C
The δ18O of stalagmites in the Asian monsoon region are considered as indicators reflecting the strength of the ASM11,26,27,28,29,30,31. The stalagmite δ18O from Dongge Cave in Guizhou reflected the intensity of ASM variations on decadal to centennial scales under control of solar activity. It means that, the negative stalagmite δ18O values respond to stronger ASM, and vice versa11,31,32. Simulation results also indicated that the variation of stalagmite δ18O in the Asian monsoon region can reflect the intensity of ASM33. In addition, stalagmite δ18O is also influenced by various factors such as cave temperature, precipitation amount, winter/summer precipitation ratio, moisture source, moisture transport path, condensation and evaporation of moisture34,35,36. Stalagmite δ18O records accumulate the overall moisture changes from the moisture source to the cave, rather than indicating precipitation at a certain stage along the moisture transport path37,38. When the summer monsoon strengthens, whether it causes increasing in precipitation in upstream of moisture transport, i.e., strengthening of the “rain-out effect�, resulting in negative δ18O in downstream precipitation35; or directly enhances convective activity in downstream areas, leading to increased local precipitation. These scenarios can result in negative δ18O in precipitation, with consistent effects in both cases.
The δ18O precipitation values in Guiyang City, which is 327 km away from Feilong Cave, are influenced by the Asian monsoon. During summer (June–July–August: JJA), the δ18O values range from approximately − 10.5‰ to −16.8‰, while during winter (December-January-February: DJF), the range is about − 8.5‰ to −0.6‰ 18 (Supplementary Fig. 1) (https://websso.iaea.org/login/login.fcc). Summer precipitation accounts for over 80% of the total annual precipitation in this region. Therefore, stalagmite δ18O is mainly controlled by the δ18O of summer precipitation. The δ18O of stalagmites in this area reflects a comprehensive rainfall process between the summer monsoon water vapor source and the cave, rather than strictly corresponding to local precipitation amounts27,28. Whether the δ18O of stalagmites reflects changes in regional precipitation amounts needs to be comprehensively analyzed and cross-validated with other geochemical indicators, such as δ13C and trace elements39,40.
The δ13C of stalagmites is primarily influenced by both biotic and abiotic factors under climatic control41,42,43. Biotic factors include changes in vegetation type under temperature and precipitation control43,44, variations in overlying soil vegetation density or biomass, soil CO2 production rates, and microbial activity changes43,45, as well as changes in atmospheric CO2 concentration and sources46. Abiotic factors include hydrological conditions in karst systems, ventilation conditions, and kinetic fractionation during carbonate deposition processes47. The carbon in stalagmites mainly comes from atmospheric CO2, soil CO2, and the dissolution of surrounding carbonate rocks, with soil CO2 contributing the most (60–90%)43,48. The δ13C of stalagmites is mainly regulated by soil CO2. Soil CO2 dissolves in water to produce carbonic acid solution, which dissolves surrounding rocks along karst fissures, forming a mother solution rich in calcium carbonate. When the mother liquor enters the cave, CO2 degasses from dripping water (typically, pCO2 in dripping water is higher than in air), the solution becomes supersaturated, leading to calcium carbonate precipitation and stalagmite formation49,50.
Cave monitoring indicated that the δ13C of speleothems can reflect the vegetation and regional surface environmental conditions overlying cave. Therefore, stalagmite δ13C can indirectly reflect regional climatic conditions19,43,45,51. Additionally, enhanced human activities such as population migration, deforestation, and land reclamation can reduce the vegetation coverage above cave, weaken the respiration of plant roots and the decomposition of soil organic matter, lower soil microbial activity, decrease biological CO2 production, and cause stalagmite δ13C to shift positively19,39,40,43,52,53. In summary, there are uncertainties in using a single stalagmite proxy record to analyze past climate change. To accurately understand the climatic significance of stalagmite δ18O and δ13C records, comprehensive analysis combining other geochemical proxies and regional climate data is required for mutual verification39,40.
Variation of ASM during MWP and LIA
During the entire period from 770 to 1300 AD, the δ18O values of stalagmite FL2102 are lighter than the average of the entire stalagmite δ18O record (Fig. 2A), indicating an overall enhancement of the ASM during the MWP. However, after 1300 AD during the LIA, the δ18O values of stalagmite FL2102 are heavier than the average of the entire stalagmite δ18O record, indicating an overall weakening of the ASM (Fig. 2A).
During the MWP, comparing with stalagmite records from northern China, the record from Feilong Cave (this study) exhibits a certain similarity in trend with stalagmite δ18O records from Huangye Cave (105° 07′ E, 33° 35′ N)54, Wanxiang Cave (105° 00′ E, 33° 19′ N)55, and Wuya Cave (105° 25′ E, 33° 49′ N)56 (Fig. 3A–D). All four stalagmite δ18O records showed negative values compared to the baseline value of zero, indicating a strengthened ASM, along with a series of climate oscillations manifesting as decadal-scale positive δ18O excursions. Conversely, during the LIA, the δ18O values were predominantly positive relative to the baseline value of zero, indicating a weakened ASM11,31,39,40. The stalagmite record from Wuya Cave showed a sedimentary hiatus of nearly 500 years during the LIA (Fig. 3D)56.
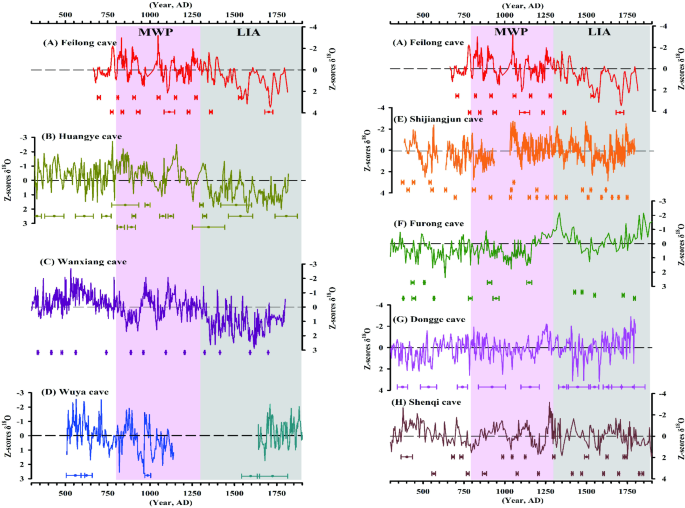
Comparison with stalagmite records from China. (A) Feilong Cave (FL; this study); (B) Huangye Cave (HY)54; (C) Wanxiang Cave (WX)55; (D) Wuya Cave (WY)56; (E) Shijiangjun Cave (SJJ)57; (F) Furong Cave (FR)49; (G) Dongge Cave (DG)32; (H) Shenqi Cave (SQ)30. Dating points and errors for each record are represented by colored dots and error bars, respectively. Pink and gray bands represent the Medieval Warm Period and the Little Ice Age, respectively. The black dashed line denotes the benchmark value of zero in the Z-scores analysis of each record.
During the MWP, comparing with stalagmite records from southern China, δ18O records from Shijiangjun Cave (106° 03′ E, 26° 17′N)57, Furong Cave (107° 54′ E, 29°13′N)49, Dongge Cave (108° 05′ E, 25° 17′N)32and Shenqi Cave (103° 10′ E, 28° 93′ N)30 in southwest China show significant differences compared to the record from Feilong Cave (this study) (Fig. 3A,E,F,G,H). The δ18O values of stalagmites from these four caves did not exhibit stable negative deviations during the MWP. The most negative peak in stalagmite δ18O values from Shijiangjun Cave occurred around 1000 AD (Fig. 3E)57. In Furong Cave and Dongge Cave, the main period of negative δ18O values during the MWP is between 800 and 1000 AD (Fig. 3F,G)32,49. For Shenqi Cave, the most negative δ18O value was observed around 1250 AD (Fig. 3H)30. During the LIA, the stalagmite δ18O values from Shijiangjun Cave, Furong Cave, Dongge Cave, and Shenqi Cave generally showed a negative trend, which contrasted with the positive δ18O trend observed in the stalagmite from Feilong Cave (this study) (Fig. 3A,E,F,G,H).
In addition, by comparing the FL2102 record (this study) with δ18O records from stalagmites in the middle and lower reaches of the Yangtze River, including Heshang Cave (110° 25′ E, 30° 27′N)15, Sanbao Cave (110° 26′ E, 31° 40′N)58, and Lianhua Cave (109° 32′ E, 29° 29′N)59, certain trends emerged. During the MWP, the δ18O records from the FL2102 stalagmite exhibited similarities with Heshang and Sanbao records (Fig. 4A–C). All three stalagmite δ18O records showed generally negative values compared to the baseline value of zero, indicating an enhancement of the ASM, accompanied by interdecadal climate oscillations reflected in positive δ18O anomalies. In contrast, during the LIA, the δ18O values were predominantly positive relative to the baseline value of zero, signaling a weakening of the ASM11,31,39,40.
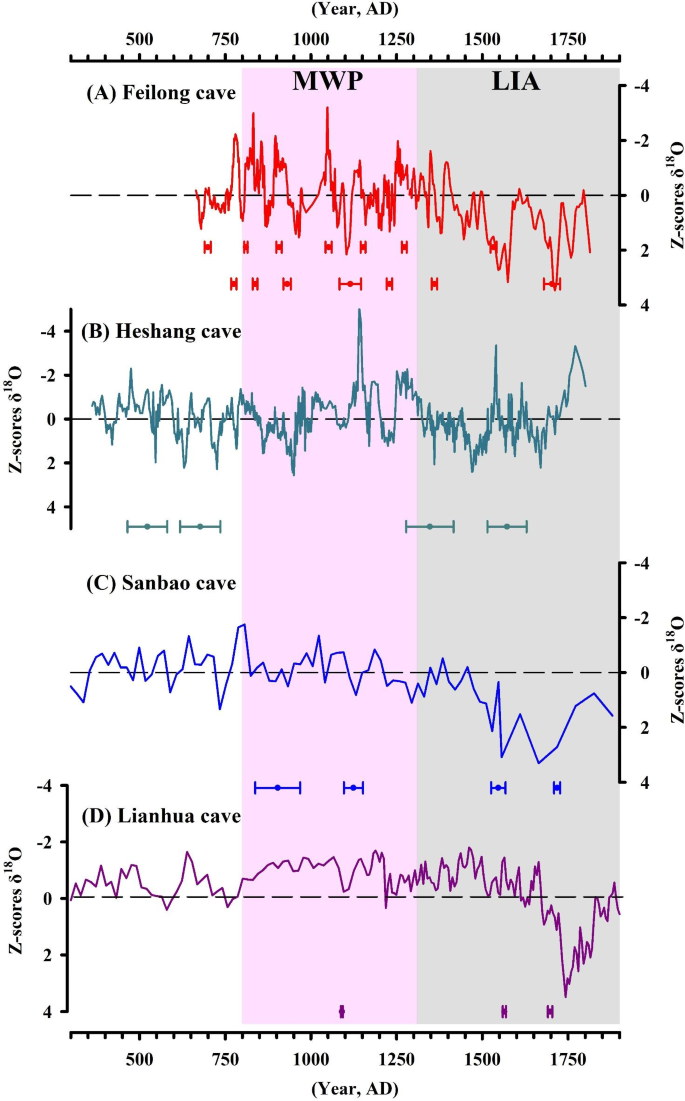
Comparison with stalagmite records from the middle and lower reaches of the Yangtze River. (A) Feilong Cave (FL; this study); (B) Heshang Cave (HS)15; (C) Sanbao Cave (SB)58; (D) Lianhua Cave (LH)59. Dating points and errors for each record are represented by colored dots and error bars, respectively. Pink and gray bands represent the Medieval Warm Period and the Little Ice Age, respectively. The black dashed line denotes the benchmark value of zero in the Z-scores analysis of each record.
During the MWP, the overall trend of δ18O values of stalagmite from Feilong Cave was generally consistent with those from Dandak Cave and Jhumar Cave in the Indian monsoon region. The δ18O values of these stalagmites were predominantly negative, indicating a consistent climatic trend between the East Asian and Indian monsoon regions during the MWP, with strengthened summer monsoon (Fig. 5)60,61. During the LIA, the overall trend of δ18O values of stalagmites from Feilong Cave, Dandak Cave, and Jhumar Cave was predominantly positive, indicating weakened summer monsoon (Fig. 5)60,61. The stalagmite record from Feilong Cave showed consistent variations with the ISM on decadal to centennial time scales, indicating that the stalagmite δ18O from Feilong Cave primarily recorded the climate signal of the ISM, consistent with the observations that for the summer precipitation in southwest China, mass of the moisture originate from Indian Ocean62. The differences among the three records during the LIA may be due to differences in dating points and resolutions of each record63.
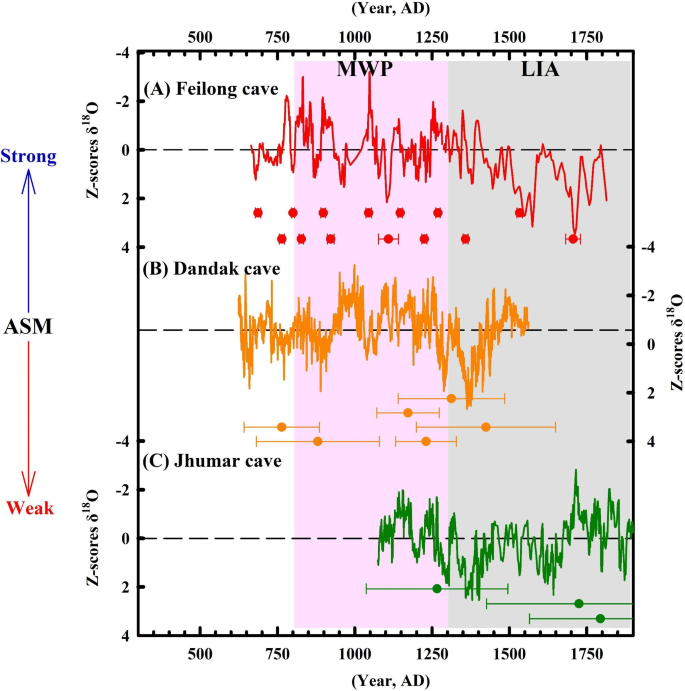
Comparison with stalagmite records from the Indian monsoon region since the middle ages. (A) Feilong Cave (FL; this study); (B) Dandak Cave (DK)60; (C) Jhumar Cave (JHU)61. Dating points and errors for each record are represented by colored dots and error bars, respectively. Pink and gray bands represent the Medieval Warm Period and the Little Ice Age, respectively. The black dashed line denotes the benchmark value in the Z-scores analysis of each record.
During the MWP, the temperature in northern hemisphere increased11,17, the ASM strengthened, particularly enhanced the long-range southwest moisture transport (carried by the ISM)11, resulted in the northward shift of the rain belt in the monsoon region of China, and finally increased precipitation in north China11. According to the Rayleigh fractionation principle64, long-distance transported water vapor may undergo a series of precipitation processes upstream along the transport path, leading to the continuous separation of isotopic systems, resulting in lower δ18O values of precipitation in downstream areas65. During the MWP, the δ18O values of stalagmites from Huangye Cave, Wanxiang Cave, and Wuya Cave in northern China (Fig. 3B–D), as well as from Heshang Cave, Sanbao Cave, and Lianhua Cave in the middle and lower reaches of the Yangtze River (Fig. 4B–D), were somewhat negative. This indicating the strengthening of the ASM, northward shift of the rain belt in the monsoon China, and increased precipitation in north China. In contrast, the overall δ18O values of stalagmites in the south region of China, including Shijiangjun Cave, Furong Cave, Dongge Cave and Shenqi Cave, were relatively positive during the MWP (Fig. 3E–H), attributed to the northward shift of the summer monsoon rain belt and/or relatively reduced precipitation in the south, coupled with land warming enhancing the evaporation effect10,66, leading to drying in the south and strengthening of local water cycles10,66. Since local water vapor mainly originates from the evaporation of inland rivers and lakes enriched in stable isotopes, the precipitation δ18O values produced by this type of water vapor are biased65. Therefore, during the MWP, a “south dry-north wet� pattern was observed in the monsoon China.
During the LIA, the temperature in northern hemisphere decreased7,11, the ASM weakened, southwestern moisture transport diminished, the rain belt in the eastern monsoon region of China shifted southward, and precipitation increased in southern China11. During the LIA, the δ18O values of stalagmites in northern China showed a positive trend (Fig. 3B–D), significantly biased toward the δ18O values during the MWP. At the same time, the δ18O values of stalagmites in the middle and lower reaches of the Yangtze River also showed a significant positive trend compared to the MWP (Fig. 4), indicating a weakening of the ASM during the LIA. In contrast, although stalagmite δ18O values in southern China showed a positive phase during the LIA, the stalagmite δ18O values in south China were negative on the whole (Fig. 3E–H), attributed to the southward shift of the rain belt and relatively increased precipitation in the south7,66. Additionally, during the LIA, sea surface temperature in the Western Pacific Warm Pool were lower than normal, convection activity between the Indochina Peninsula and the Philippines weakened, and the Western Pacific Subtropical High system may have anomalously shifted southward63,66, resulting in prolonged retention of the rain belt in southern China and increased monsoonal rainfall in this region67. Therefore, during the LIA, a “south wet-north dry� pattern was observed in the monsoon China.
The differences in precipitation patterns between north and south regions have been confirmed by other climate records in monsoon China. For example, the pH values of Tsuifong Lake (121° 31′ E, 24° 30′ N) along the southeast coast of China were consistently lower than average during the MWP (800–1300 AD), but noticeably increased during the late stages of the LIA (1500–1900 AD), indicating a relatively dry climate during the MWP and increased precipitation during the late LIA (Fig. 6A)68. The total organic carbon (TOC) records from Huguangyan Lake (110° 17′ E, 21° 90′ N) in Guangdong province showed that TOC values were below average during 800–1300 AD, suggesting a dry climate during the MWP; however, from 1300 to 1720 AD, TOC values were consistently above average, indicating a wetter climate during the LIA (Fig. 6B)69. Pollen-based reconstructions of rainfall from Dajiu Lake (110° 00′ E, 31° 34′ N) in central China show a relatively dry climate during the MWP and a wetter climate during the LIA (Fig. 6C)70. Sediment grain size records from Lugu Lake (100° 47′ E, 27° 42′ N) in southwestern China indicated that grain sizes were smaller than average during 800–1300 AD but larger than average during 1300–1750 AD, suggesting a dry climate during the MWP and a wetter climate during the LIA (Fig. 6D)71. Finally, sediment grain size records from Erhai Lake (100° 10′ E, 25° 53′ N) in Yunnan province also indicated a relatively dry climate during the MWP and a wetter and unstable climate during the LIA (Fig. 6E)72.
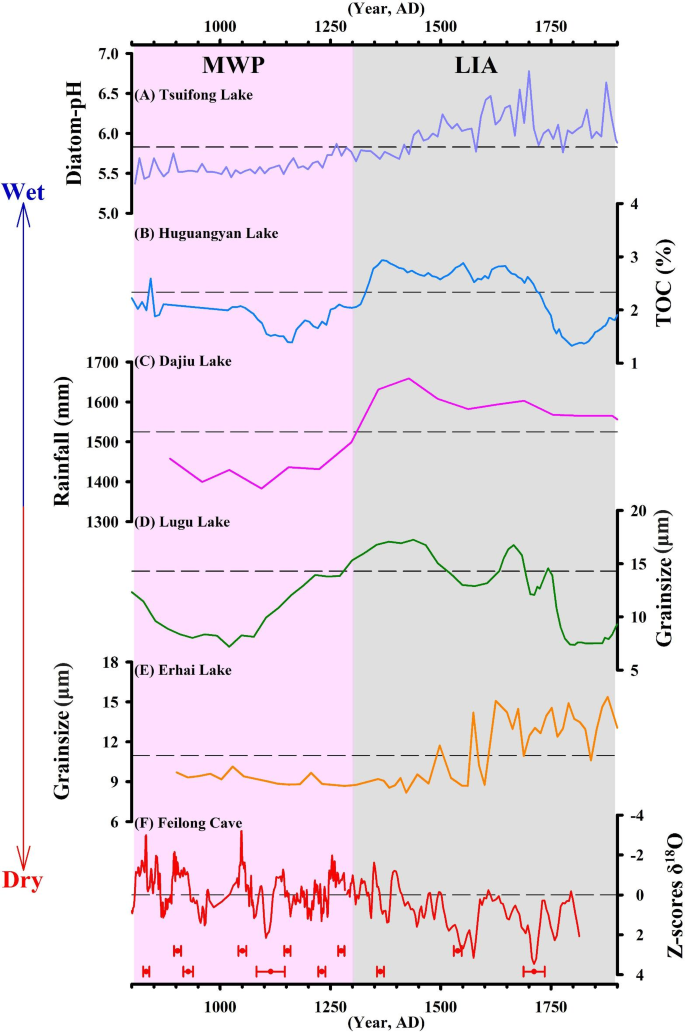
Comparison of paleoclimate records in southern China since the Middle Ages. (A) Tsuifong Lake68; (B) Huguangyan Lake69; (C) Dajiu Lake70; (D) Lugu Lake71; (E) Erhai Lake72; (F) Feilong Cave (FL; this study). The red dots and error bars at the bottom represent the dating points and age errors of stalagmite FL2102. The pink and gray bands represent the Medieval Warm Period and the Little Ice Age, respectively. The black dashed line in each of A, B, C, D and E represents the average values of the various record indicators presented, whereas in F, the black dashed line denotes the benchmark value of zero in the Z-scores analysis.
The conclusions drawn are primarily based on changes observed in paleoclimatic records. In Feilong Cave, located in Guizhou, Southwest China, the δ18O values of stalagmites indicated a negative shift during the MWP and a positive shift during the LIA. This suggests that the region was relatively more humid during the MWP and drier during the LIA. This pattern is contrary to the trend observed in other paleoclimatic records from Southern China, which indicated a drier climate during the MWP and a wetter climate during the LIA (Figs. 3 and 6). The observed discrepancy may be attributed to geographic differences in the cave environments63. By comparing climate proxies in Southwest China, the stalagmite δ18O from Dongge Cave (25° 17′ N, 108° 05′ E) in Guizhou Province exhibited high-frequency oscillations on decadal to centennial scales centered around the baseline value of zero during the MWP, with two distinct positive phases observed during the LIA: 1350–1440 AD and 1500–1700 AD (Supplementary Fig. 2A)32. These positive phases coincided well with the two distinct positive phases recorded by stalagmite δ18O from Shenqi Cave (28° 56′ N, 103° 06′ E) in Sichuan Province: 1350–1440 AD and 1550–1600 AD (Supplementary Fig. 2B)30. Both cave stalagmite δ18O records showed positive phases corresponding to two notable weak Asian summer monsoon events in Chinese history: the “Weak Summer Monsoon Event at the End of the Yuan Dynasty� and the “Weak Summer Monsoon Event at the End of the Ming Dynasty�30. The grain size of sediments from Lugu Lake (27° 42′ N, 100° 47′ E) in Yunnan Province was smaller than the average during the MWP and larger than the average during the LIA from 1300 to 1750 AD, indicating a drier climate during the MWP and a wetter climate during the LIA (Supplementary Fig. 2C)71. The grain size of sediments from Erhai Lake (25° 53′ N, 100° 10′ E) in Yunnan Province was smaller than the average from 900 to 1450 AD, suggesting a drier climate in the region during the MWP and the early LIA; after 1450 AD, the grain size of Erhai Lake sediments gradually increased with larger fluctuations, indicating a wetter and more unstable climate in the region (Supplementary Fig. 2D)72. During the mid-to-late LIA from 1500 to 1900 AD, the grain size records from Lugu Lake and Erhai Lake showed out-of-phase variations, reflecting the complexity of precipitation changes in Southwest China (Supplementary Fig. 2C,D)63.
Additionally, reconstructions of precipitation patterns in Northern and Southern China since the MWP, based on various proxy indicators, might show some degree of uncertainty and variability. This uncertainty arises from factors such as the number of records, spatial distribution, sensitivity to climate responses, dating methods, dating errors, and resolution30,39,40,63. Southwest China was influenced by a dual monsoon system comprising the Indian summer monsoon and the East Asian summer monsoon63. The intricate precipitation patterns observed in this region were deeply sculpted by its diverse topographical and landform characteristics, with significant variations in terrain configuration, altitude gradients, and slope orientations playing pivotal roles in generating notable disparities in precipitation across Southwest China63. Therefore, acquiring high-precision, high-resolution records that cover a larger geographic area is critical and urgent for improving paleoclimatic reconstructions on decadal to centennial timescales in both Northern and Southern China30,57,62.
In summary, the climate patterns in the monsoon China have exhibited an anti-phase relationship between the north and south since the Medieval period. During the MWP, a “south dry-north wet� pattern was observed, while during the LIA, a “south wet-north dry� pattern prevailed. It is worth pointing out that during the LIA, the precipitation pattern in southern China, including the middle-low Yangtze River basin, southeast China, southwest China, and south China, is still presented spatial variability based on existing studies40,57,73. Furthermore, high-precise and multi-proxy records are essential to deeply reveal the changes in regional precipitation and hydrological conditions.
Forcing for the ASM
Multiple paleoclimate records from the Asian monsoon region indicated that during the MWP, the ASM showed an overall strengthening trend in response to the rising temperature and summer solar insolation in the Northern Hemisphere. While during the LIA, the ASM exhibited an overall weakening trend, corresponding to the declining temperature and summer solar insolation in the Northern Hemisphere (Fig. 7A,B). On a millennial scale, the ASM strengthened with increasing solar insolation and weakens with decreasing solar insolation27,28,66,74.
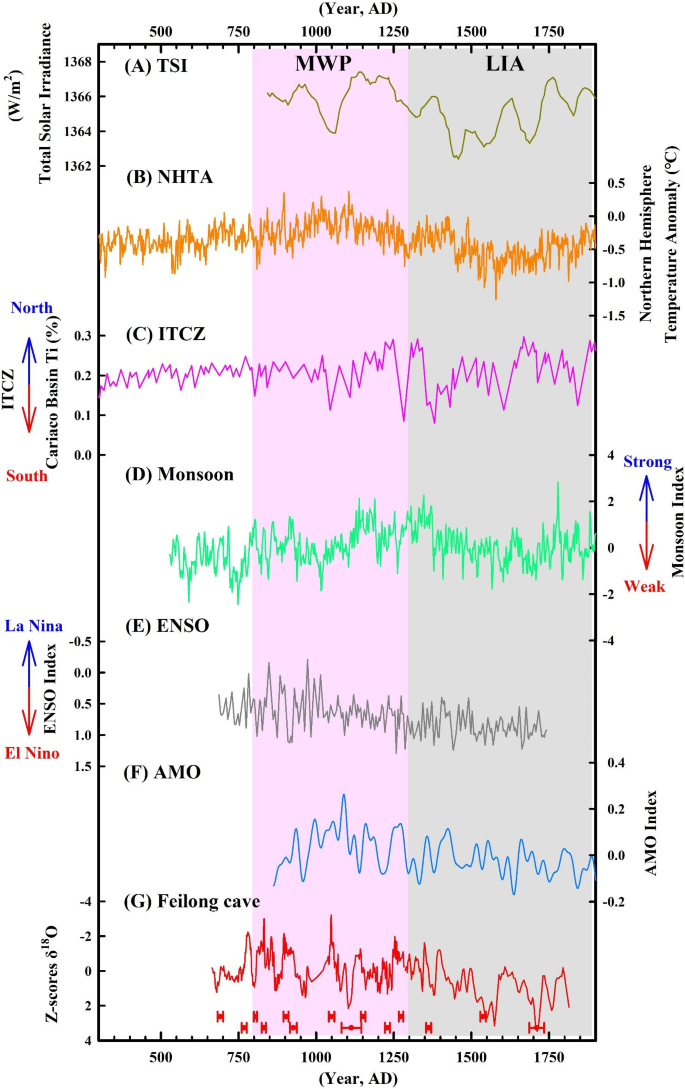
The driving mechanisms for the evolution of the Asian summer monsoon since the Medieval Warm Period. (A) Total Solar Irradiance (TSI)74; (B) Northern Hemisphere Temperature Anomaly (NHTA)4; (C) Titanium content in the Cariaco Basin81, indicating the north-south movement of the ITCZ; (D) Intensity of the Asian summer monsoon82; (E) ENSO Index80; (F) Atlantic Multidecadal Oscillation (AMO) Index95; (G) δ18O values of stalagmite FL2102 (this study). The red dots and error bars at the bottom represent the dating points and age errors of stalagmite FL2102. The pink and gray bands represent the Medieval Warm Period and the Little Ice Age, respectively.
Solar insolation is a crucial external factor driving changes in the ASM17,55, it produces wind by affecting atmospheric circulation, with the atmospheric circulation over the tropical Pacific Ocean further transmitting and amplifying the effects of solar insolation changes17,55. The tropical Pacific Ocean serves as a vast heat reservoir and a significant source of atmospheric moisture27,28. Its variations not only affect climate changes in tropical regions but also impact the climate of mid-high latitudes through atmospheric circulation systems like the Hadley circulation27,28. In the climate system of the tropical Pacific, the two hydrological systems that have the greatest regional and global impact are the ITCZ and the ENSO47,75.
Changes in solar insolation led to the north-south movement of the ITCZ47,55. During the MWP/LIA, with the increase/decrease in temperature in the Northern Hemisphere7, the land warmed rapidly/slowly as the summer Northern Hemisphere received more/less solar insolation, enhancing/weakening the contrast in thermal properties between land and sea and causing the ITCZ to shift northward/southward67,76,77,78. Precipitation in the Asian monsoon region is significantly influenced by the meridional transport of water vapor via the Hadley circulation11,79,80. When the ITCZ moves northward, the ascending branch of the Hadley circulation strengthens, the ASM strengthens or moves northward accordingly11,79,80. Conversely, when the ITCZ moves southward, the ascending branch of the Hadley circulation weakens, the ASM weakens or moves southward (Fig. 7C,D)11,79,80.
There is a significant positive correlation (r = 0.55, p < 0.01) between the δ18O of stalagmite FL2102 and the titanium content records from the Cariaco Basin in Central America, which indicated the north-south movement of the ITCZ81. During the MWP, the titanium content increased from 0.15% to around 0.3%, indicating a northward shift of the ITCZ, corresponding to the lighter δ18O of stalagmite FL2102 and the strengthening of the ASM (Fig. 7C,D,G)11,31,82. During the LIA, the titanium content decreased from around 0.3% to around 0.1%, indicating a southward shift of the ITCZ, corresponding to the heavier δ18O of stalagmite FL2102 and the weakening of the ASM (Fig. 7C,D,G). Therefore, on decadal to centennial timescales, the north-south movement of the ITCZ responds to solar insolation, thereby influencing the strength of the ASM.
Furthermore, ENSO activity is another important factor influencing the variability of the ASM48,80,83,84. During the MWP, ENSO activity was predominantly in a negative phase characterized by La Niña48,80,83,84, corresponding to lighter FL2102 δ18O values and a stronger ASM (Fig. 7D,E,G). In the LIA, ENSO activity was generally dominated by the positive phase of El Niño48,80,83,84, corresponding to heavier FL2102 δ18O values, indicating a weaker ASM (Fig. 7D,E,G). ENSO activity primarily influences the variability of the ASM by modulating the ocean-atmosphere circulation patterns. During El Niño events, the weakening of the Walker circulation and the reduction in the intensity of the ascending branch led to an eastward shift of the Walker circulation away from the Western Pacific Warm Pool19,48,80,85. Meanwhile, the strengthening of the Western Pacific Subtropical High extends westward to the southwestern region of China65. These changes in circulation patterns result in a weakening of the ASM, corresponding to heavier δ18O values in stalagmites (Fig. 7D,E,G); the opposite occurs during La Niña events (Fig. 7D,E,G)48,86,87.
In summary, the most important external factor regulating the variability of the ASM is solar insolation, which dominated the cyclic variations of the monsoon. The influence of tropical ocean-atmosphere circulation on the amplification and transmission of solar activity changes leads to the diversity of ASM variations, exhibiting frequent climate oscillations at decadal scales. Within the tropical Pacific climate system, the northward and southward movement of the ITCZ, as well as ENSO activity, are important factors influencing the variability of the ASM.
AMO, PDO, and ASM
The AMO refers to the quasi-periodic cold and warm anomalies in sea surface temperature in the North Atlantic, occurring over 60–70 years88. The primary cycle of the FL2102 stalagmite δ18O record, approximately 64 years (Fig. 8A), aligns with the typical AMO period of 60 to 70 years88, underscoring the close relationship between the Atlantic ocean-atmosphere oscillation and the ASM. AMO phase transitions have significant impacts on both global and regional climates. As a major multidecadal sea surface temperature mode, the AMO is a significant driver of changes in the ASM89.
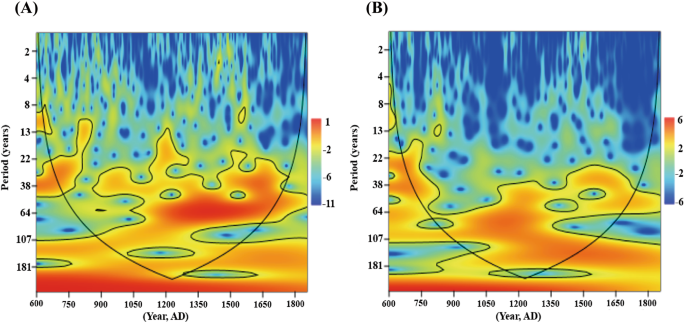
Wavelet analysis for the δ18O and δ13C of stalagmite FL2102. (A) Wavelet analysis plot of stalagmite FL2102 δ18O; (B) Wavelet analysis plot of stalagmite FL2102 δ13C. Wavelet analysis was conducted using Matlab, where spectral power (variance) is represented by colors ranging from blue (weak) to red (strong), and the black curve indicates the 95% confidence level90. For Matlab calculation methods, refer to http://noc.ac.uk/using-science/crosswavelet-wavelet-coherence .
The AMO phase transition can lead to significant climate changes across various regions of the Northern Hemisphere and has a notable impact on the interdecadal variations of the ASM through several pathways91,92,93,94. The first is through the air-sea feedback mechanism in the tropical western Pacific–Indian Ocean. Coupled ocean-atmosphere simulation experiments indicate that a positive AMO phase induces warm anomalies in the tropical Western Pacific and oceanic continents, resulting in increased local precipitation91. Additionally, the convection activities and atmospheric heating in these regions can trigger anticyclonic circulation anomalies in the lower troposphere of the Northwest Pacific, leading to a westward extension of the Western Pacific Subtropical High and thereby strengthening the ASM91. In contrast, a weakened Atlantic meridional overturning circulation cools the sea surface temperatures in the North Atlantic, consequently weakening the ASM through air-sea feedback mechanisms92. The second is to change the atmospheric temperature of the Eurasian troposphere. A positive AMO phase raises tropospheric temperature over the Eurasian continent, increasing the thermal contrast between the Asian landmass and the surrounding oceans, which in turn strengthens the ASM93. The third aspect pertains to the propagation dynamics of high-latitude atmospheric wave trains within the context of modulation. Across interannual timescales, a positive phase of the AMO has the capacity to elicit Rossby wave patterns, which propagate downstream in an eastward direction originating from the North Atlantic. This results in anomalous low-pressure systems over northern Asia and high-pressure systems over southern Asia, enhancing southerly winds and northward moisture transport in the region, thereby reinforcing the ASM94.
By comparing the AMO index with the intensity of the ASM, it is observed that during the MWP, the ASM was strengthened, corresponding to a positive AMO phase. In contrast, during the LIA, the ASM weakened, aligning with a negative AMO phase. This further indicates that AMO phase transitions significantly impact ASM variations on interdecadal timescales (Fig. 7D,F)89,90,91,92,93,94,95.
The interaction between the AMO and the Pacific significantly influences on the variability of ASM96. The decadal modes of sea surface temperature in the North Atlantic and North Pacific are two of the decadal signals in the global oceans and are significant factors driving decadal changes in ASM96. When the AMO and the PDO are in opposite phases, their effects align and reinforce each other, resulting in significantly stronger or weaker ASM (Supplementary Fig. 3a,b)95,97,98. Conversely, when the AMO and PDO are in the same phase, their effects counteract each other, leading to slightly stronger or weaker ASM (Supplementary Fig. 3c,d)95,97,98.
Therefore, the decadal variability of ASM is influenced not only by the AMO, but also by the phase combinations of the AMO and PDO89,90,91,92,93,94,95,96,97.
Stalagmite δ13C and the evolution of regional ecological environment
There is a significant positive correlation between the δ18O and δ13C values of stalagmite FL2102 (r = 0.63; p < 0.01) (Fig. 2). The covariation of stalagmite δ18O and δ13C records at centennial scales has been confirmed in multiple stalagmite records within the Asian monsoon region32,39,47,51,77,87,99. Cross-wavelet analysis of δ18O and δ13C revealed similar dominant periodic variations at decadal to centennial scales (significant cycle of 64 years) (Fig. 8), potentially driven by the same controlling factors. Increasing, studies suggested that the positive correlation between stalagmite δ18O and δ13C records cannot be simply explained by kinetic fractionation during stalagmite deposition39,40,43,100,101. Even if kinetic fractionation exists, the climate signals contained in stalagmite δ13C records would not be completely obscured26,39,40,43,44,101, because the biological processes and inorganic processes which influencing on the changes of δ13C are directly or indirectly, closely related to the regional hydrological conditions42,50. The δ13C of stalagmite FL2102 may reflect regional ecological evolution under the influence of the ASM39,42,43,50.
Temperature records in China indicated warmer temperature during the MWP102 (Fig. 9A). During the LIA, the weakening effect of solar insolation due to volcanic ash entering the atmosphere led to colder periods5. Temperature during the LIA were about 0.5 °C lower than the average temperature during 1961–1990 3–4. The δ18O values of stalagmite FL2102 were lighter during the MWP and heavier during the LIA, reflecting an overall response to temperature changes (Fig. 9B). The δ18O records of stalagmite FL2102 oscillated frequently and presented a positive trend during the LIA, indicating a weakening and unstable ASM (Fig. 9B).
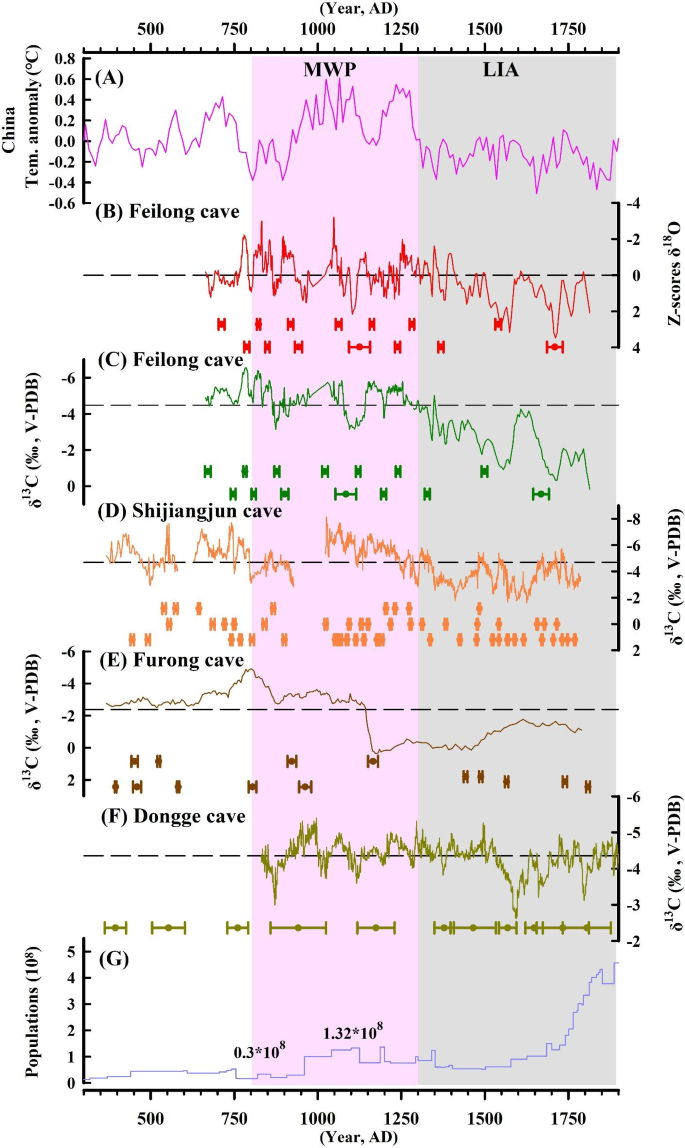
Comparison of stalagmite FL2102 δ13C with other climate records. (A) Temperature anomaly in China102; (B) δ18O record from Feilong Cave with Z-scores analysis (this study); (C) δ13C record from Feilong Cave (this study); (D) δ13C record from Shijiangjun Cave (SJJ)57; (E) δ13C record from Furong Cave (FR)49; (F) δ13C record from Dongge Cave (DG)32; (G) Historical population changes in China19,103. The dating points and errors of each record are represented by dots and error bars of corresponding colors, respectively. Pink and gray bands represent the Medieval Warm Period and Little Ice Age, respectively. The black dashed line in each of C, D, E and F represents the average values of the various record indicators presented, whereby in B, the black dashed line denotes the benchmark value of zero in the Z-scores analysis.
Both in MWP and LIA, the variations in δ13C values of stalagmite FL2102 responded to changes in δ18O values, even in some detailed structures (Fig. 9B,C). The covariance between the δ18O and δ13C records of stalagmite FL2102 indicated a close connection between stalagmite δ13C changes and climate variations. The positive trend in the δ13C values of regional stalagmites during the LIA suggested that the decrease in temperature and weakening of the ASM further exacerbated the degradation of the karst ecological environment in southwest China (Fig. 9C–F)32,49,57.
However, there are spatial differences between stalagmite δ13C records in southwest China and temperature records as well as ASM records, especially during the LIA (Fig. 9). The similarity between the stalagmite δ13C values of Shijiangjun Cave and Feilong Cave shows negative deviations during the MWP and positive deviations during the LIA (Fig. 9C,D)57. The δ13C values of Furong Cave stalagmite also exhibited characteristics of negative deviations during the MWP and positive deviations during the LIA; however, around 1150 AD, the sudden positive deviation in the stalagmite δ13C values of Furong Cave is significantly different from the gradual positive deviations in Feilong Cave and Shijiangjun Cave stalagmites (Fig. 9E)49. Meanwhile, the δ13C values of Dongge Cave stalagmite showed relatively consistent fluctuations during the MWP and LIA periods, without a significant positive trend around 1300 AD as preserved in other records. There was only one noticeable positive deviation during the period of 1500–1600 AD in Dongge record (Fig. 9F)32. This may be because the surface vegetation type in the area of Dongge Cave belongs to karst forests, maintaining a relatively humid surface state. Only under particularly severe disturbances will the ecological environment degrade significantly, resulting in noticeable positive deviations in stalagmite δ13C values32,53.
During the period from 1000 to 1200 AD, temperature records in China and the stalagmite δ18O in Feilong Cave maintained relatively stable fluctuations, indicating a relatively warm climate at that time (Fig. 9A)102, accompanied by a stronger ASM (Fig. 9B). However, the δ13C values of stalagmites in Feilong Cave, Shijiangjun Cave, and Furong Cave showed a gradually increasing trend (Fig. 9C,D,E)49,57. The positive trend in δ13C values of stalagmites correlated with the increasing trend in population (Fig. 9G)19,44,103. Additionally, during the period of 1700–1800 AD, temperature and ASM variations were relatively stable (Fig. 9A,B)102, while the δ13C values of stalagmite in Feilong Cave continued to be heavier (Fig. 9C), corresponding to rapid population growth (Fig. 9G)19,44,103. These comparisons indicated that during the MWP and LIA, besides climatic conditions104,105,106,107,108,109,110, human activities were also important factors influencing ecological changes in the region11,19,39,40,44,57. Population growth and increased land cultivation intensified ecological degradation11,39,40,44. During the MWP, specifically in 1127 AD, the famous historical event “Jingkang Event� occurred in China, leading to the fall of the Northern Song Dynasty40. After the “Jingkang Event�, the political and economic center of ancient Chinese civilization shifted from the north China to the south China for the first time. To be precise, the capital was moved to Lin’an Prefecture (present Hangzhou city), in the south of the Yangtze River. Thereafter, a large-scale migration of the Chinese population moved to the Yangtze River basin40, including the area where Feilong Cave is located. Compared to the period of 800–900 AD, the total population of China increased to about four times its original size from 1000 to 1300 AD (Fig. 9G)19,103. To alleviate population pressure and meet the needs of the rapidly growing population, continuous land cultivation was necessary, leading to worsening surface ecological conditions. Weakening of the summer monsoon, extensive deforestation due to population migration/increase, reduction in vegetation cover, and increased agricultural activities contributed to the decrease in soil CO2 production due to reduced respiratory and organic decomposition processes in plant roots, which was also one of the reasons for the positive δ13C values of stalagmite in Feilong Cave during the LIA11,19,51,111,112. Additionally, the introduction of C4 crops such as maize (with more positive δ13C values) may also have contributed to the positive trend in δ13C values of stalagmites11,19,39,40,44,113.
Conclusions
This study utilized the stalagmite FL2102 from Feilong Cave in southwest China to reconstruct the historical evolution of the ASM and regional karst ecological environment since the MWP.
The main external driving factors for the variation of the ASM are solar activity, while internal factors include tropical ocean-atmosphere circulation such as ITCZ and ENSO (Fig. 7). Additionally, the variability of the ASM was also influenced by the AMO and the different phase combinations between the AMO and PDO (Fig. 7) (Supplementary Fig. 3).
Since the MWP, the δ18O of stalagmite FL2102 reflected changes in the intensity of ASM, showing an overall weakening trend. Ten weak ASM events were recorded in total (Fig. 2). During the MWP, there was increased precipitation in northern monsoon China (“south dry-north wet� pattern), while during the LIA, there was increased precipitation in the southern region (“south wet-north dry� pattern), indicating a significant shift in precipitation patterns, which resulted by the north-south movement of the monsoon precipitation belt (Figs. 3, 4, 6).
The δ18O and δ13C records of stalagmites revealed that climate change and human activities jointly influenced on the evolution of karst environment. During the MWP and the LIA, intensified human activities exacerbated the degradation of the karst ecological environment in southwest China (Fig. 9).
Data availability
The datasets for this study can be found in the supplementary materials.
References
-
IPCC. Climate Change 2013: The Physical Science Basis. Contribution of Working Group I To the Fifth Assessment Report of the Intergovernmental Panel on Climate Change (Cambridge University Press, 2023).
-
Xu, D. K. et al. Asynchronous 500-year summer monsoon rainfall cycles between Northeast and central China during the holocene. Glob. Planet. Change 195, 103324 (2020).
-
Lamb, H. H. The early medieval warm epoch and its sequel. Palaeogeogr. Palaeoclimatol. 1, 13–37 (1965).
-
Mann, M. E. & Jones, P. D. Global surface temperatures over the past two millennia. Geophys. Res. Lett. 30, 1820 (2003).
-
Jones, P. D. & Mann, M. E. Climate over past millennia. Rev. Geophys. 42(2), 1–42 (2004).
-
Bronnimann, S. et al. Last phase of the little ice age forced by volcanic eruptions. Nat. Geosci. 12(8), 650–656 (2019).
-
Grove, J. M. & Switsur, R. Glacial geological evidence for the medieval warm period. Clim. Changes 26(2–3), 143–169 (1994).
-
Liu, J. B. et al. Environmental magnetic characteristics of rock cores from the Gonghai lake in Ningwu, Shanxi Province and exploration of the humid climate during the medieval warm period. Chin. Sci. Bull. 56(31), 2580–2590 (2011).
-
Zhu, K. Z. Preliminary research on climate change in China over the past five thousand years. Sci. Sin. 2, 168–189 (1973).
-
Zheng, J. Y. et al. The drought and flood patterns of cold and warm weather in Eastern China over the past 2,000 years. Chin. Sci. Bull. 59(30), 2964–2971 (2014).
-
Zhang, W. S. et al. Reconstruction of holocene precipitation patterns and vegetation evolution in the North China plain: Deciphering the relative influence of climate and anthropogenic forcing. Palaeogeogr. Palaeoclimatol. 638, 112020 (2024).
-
Xu, Z. W. et al. Critical transitions in Chinese dunes during the past 12,000 years. Sci. Adv. 9, 8020 (2020).
-
Yu, G., Ke, X. K., Xue, B. & Ni, J. The relationships between the surface arboreal pollen and the plants of the vegetation in China. Rev. Palaeobot. Palynol. 129(64), 181–198 (2004).
-
Chen, J. H. et al. Hydroclimatic changes in China and surroundings during the medieval climate anomaly and little ice age: Spatial patterns and possible mechanisms. Quat. Sci. Rev. 119, 157–158 (2015).
-
Hu, C. Y. et al. Quantification of holocene Asian monsoon rainfall from spatially separated cave records. Earth Planet. Sci. Lett. 266(3–4), 221–232 (2008).
-
Wang, Z. Y., Li, Y., Liu, B. & Liu, J. Global climate internal variability in a 2,000-year control simulation with community earth system model (CESM). Chin. Geogr. Sci. 25(03), 263–273 (2015).
-
Wang, S. J. et al. Spatial and seasonal isotope variability in precipitation across China: Monthly isoscapes based on regionalized fuzzy clustering. J. Clim. 35(11), 3411–3425 (2022).
-
Xu, H. N., Wang, T., Wang, H. J., Chen, S. Q. & Chen, J. H. External forcings caused the tripole trend of Asian precipitation during the holocene. J. Geophys. Res. Atmos. 128(21), e2023JD039460 (2023).
-
Duan, R. et al. Karst-ecological changes during the middle and late holocene in Southwest China revealed by δ18O and δ13C records in a stalagmite. Palaeogeogr. Palaeoclimatol. 615, 111437 (2023).
-
Shen, C. C. et al. High-precision and high-resolution carbonate 230Th dating by MC-ICP-MS with SEM protocols. Geochim. Cosmochim. Acta 99, 71–86 (2012).
-
Cheng, H. et al. Jr. Improvements in 230Th dating, 230Th and 234U half-life values, and U-Th isotopic measurements by multi-collector inductively coupled plasma mass spectrometry. Earth Planet. Sci. Lett. 371–372, 82–91 (2013).
-
Edwards, R. L., Chen, J. H. & Wasserburg, G. J. 238U–234U–230Th–232Th systematics and the precise measurement of time over the past 500,000 years. Earth Planet. Sci. Lett. 81(2–3), 175–192 (1987).
-
Jaffey, A. H., Flynn, K. F., Glendenin, L. E., Bentley, W. C. & Essling, A. M. Precision measurement of half-lives and specific activities of 235U and 238U. Phys. Rev. C 4(5), 1889–1906 (1971).
-
Taylor, S. R. & McLennan, S. M. The geochemical evolution of the continental crust. Rev. Geophys. 33, 241–265 (1995).
-
Hercman, H. & Pawlak, J. Mod-Age: An age-depth model construction algorithm. Quat. Geochronol. 12, 1–10 (2012).
-
Cosford, J. et al. East Asian monsoon variability since the Mid-Holocene recorded in a high-resolution, absolute-dated Aragonite speleothem from Eastern China. Earth Planet. Sci. Lett. 275(3–4), 296–307 (2008).
-
Cheng, H. et al. The Asian monsoon over the past 640,000 years and ice age terminations. Nature 534(7609), 640–646 (2016a).
-
Cheng, H. et al. Climate variations of central Asia on orbital to millennial timescales. Sci. Rep. 6, 369–375 (2016b).
-
Kathayat, G. et al. The Indian monsoon variability and civilization changes in the Indian Subcontinent. Sci. Adv. 3(12), e1701296 (2017).
-
Tan, L. C. et al. High resolution monsoon precipitation changes on southeastern Tibetan plateau over the past 2,300 years. Quat. Sci. Rev. 195, 122–132 (2018).
-
Liu, X. K. et al. Abrupt climate change in arid central Asia during the holocene: A review. Earth-Sci. Rev. 242, 104450 (2023).
-
Zhao, K. et al. A high-resolved record of the Asian summer monsoon from Dongge cave, China for the past 1,200 years. Quat. Sci. Rev. 122, 250–257 (2015).
-
Liu, Z. Y. et al. Chinese cave records and the East Asia summer monsoon. Quat. Sci. Rev. 83, 115–128 (2014).
-
Dayem, K. E., Molnar, P., Battisti, D. S. & Roe, G. H. Lessons learned from oxygen isotopes in modern precipitation applied to interpretation of speleothem records of paleoclimate from Eastern Asia. Earth Planet. Sci. Lett. 295(1–2), 219–230 (2010).
-
Pausata, F. S. R., Battisti, D. S., Nisancioglu, K. H. & Bitz, C. M. Chinese stalagmite δ18O controlled by changes in the Indian monsoon during a simulated Heinrich event. Nat. Geosci. 4, 474–480 (2011).
-
Maher, B. A. & Thompson, R. Oxygen isotopes from Chinese caves: Records not of monsoon rainfall but of circulation regime. J. Quat. Sci. 27, 615–624 (2012).
-
Cheng, H. et al. Review and prospect of ancient climate research on Chinese stalagmites. Sci. Sin. 49(10), 1565–1589 (2019).
-
Li, Y. X. et al. Environmental significance and inter-relationship of stalagmite δ13C and δ18O records from Zhenzhu Cave, north China, over the last 130 ka. Earth Planet. Sci. Lett. 536, 116149 (2020).
-
Chen, C. J. et al. Karst hydrological changes during the Late-Holocene in Southwestern China. Quat. Sci. Rev. 258, 106865 (2021a).
-
Chen, C. J. et al. Human activity and climate change triggered the expansion of Rocky desertification in the karst areas of Southwestern China. Sci. China Earth Sci. 64(10), 1761–1773 (2021b).
-
Li, T. Y. et al. Transportation characteristics of δ13C in the plants-soil-bedrock-cave system in Chongqing karst area. Sci. China Earth Sci. 55, 685–694 (2012).
-
Li, J. Y. & Li, T. Y. Seasonal and annual changes in soil/cave air pCO2 and the δ13C DIC of cave drip water in response to changes in temperature and rainfall. Appl. Geochem. 93, 94–101 (2018).
-
Li, Y. X. et al. Newly-found ferns in an artificially illuminated deep karst cave have the most negative known carbon isotope values. Sci. Bull. 69(07), 881–884 (2024).
-
Zhao, J. J., An, C. B., Zhao, Y. T. & Dong, W. M. Holocene C3/C4 vegetation variations in arid central Asia: Implications for paleoclimate. Palaeogeogr. Palaeoclimatol. 592, 110905 (2022).
-
Liu, D. B. et al. Strong coupling of centennial-scale changes of Asian monsoon and soil processes derived from stalagmite δ18O and δ13C records, Southern China. Quat. Res. 85(3), 333–346 (2017).
-
Rudzka, D. et al. The coupled δ13C-radiocarbon systematics of three late glacial/early holocene speleothems, insights into soil and cave processes at climatic transitions. Geochim. Cosmochim. Acta 75(15), 4321–4339 (2011).
-
Li, Y. X. et al. Re-evaluation of the effects of precipitation amount and temperature on precipitation δ18O at the monthly and interannual timescales. J. Water Clim. Change 14(6), 1816 (2023).
-
Wang, S. J. et al. Interannual variations in stable isotopes of atmospheric water in arid central Asia due to changes in atmospheric circulation. Glob. Planet. Change 233, 104367 (2024).
-
Li, H. C. et al. The δ18O and δ13C records in an Aragonite stalagmite from furong cave, Chongqing, China: A-2,000-year record of monsoonal climate. J. Asian Earth Sci. 40(6), 1121–1130 (2011).
-
Li, T. Y., Huang, C. X., Tian, L. J., Suarez, M. B. & Gao, Y. Variation of δ13C in plant-soil-cave systems in karst regions with different degrees of Rocky desertification in Southwest China and implications for paleoenvironment reconstruction. J. Cave Karst Stud. 80(4), 212–228 (2018).
-
Kuo, T. S. et al. Climate and environmental changes during the past millennium in central Western Guizhou, China as recorded by stalagmite ZJD-21. J. Asian Earth Sci. 40, 1111–1120 (2011).
-
Zhang, E. L. et al. Linkages between climate, fire and vegetation in Southwest China during the last 18.5 ka based on a sedimentary record of black carbon and its isotopic composition. Palaeogeogr. Palaeoclimatol. 435, 86–94 (2015).
-
Zhao, M., Li, H. C., Shen, C. C., Kang, S. C. & Chou, C. Y. δ18O, δ13C, elemental content and depositional features of a stalagmite from Yelang cave reflecting climate and vegetation changes since late pleistocene in central Guizhou, China. Quat. Int. 452, 102–115 (2017).
-
Tan, L. C. et al. Centennial-to decadal-scale monsoon precipitation variability in the semi-humid region, Northern China during the last 1,860 years: Records from stalagmites in Huangye cave. Holocene 21(2), 287–296 (2011).
-
Zhang, P. Z. et al. A test of climate, sun, and culture relationships from an 1,810-year Chinese cave record. Science 322(5903), 940–942 (2008).
-
Tan, L. C. et al. Holocene monsoon change and abrupt events on the western Chinese Loess Plateau as revealed by accurately-dated stalagmites. Geophys. Res. Lett. 47(21), e2020GL090273 (2020).
-
Li, T. Y. et al. Little ice age climate changes in Southwest China from a stalagmite δ18O record. Palaeogeogr. Palaeoclimatol. 562, 110167 (2021).
-
Dong, J. G. et al. A high-resolution stalagmite record of the holocene East Asian monsoon from Mt Shennongjia, central China. Holocene 20(2), 257–264 (2010).
-
Cosford, J., Qing, H., Mattey, D., Eglington, B. & Zhang, M. L. Climatic and local effects on stalagmite δ13C values at Lianhua cave, China. Palaeogeogr. Palaeoclimatol. 280(1–2), 235–244 (2009).
-
Berkelhammer, M. et al. Persistent multidecadal power of the Indian summer monsoon. Earth Planet. Sci. Lett. 290, 166–172 (2010).
-
Sinha, A. et al. The leading mode of Indian summer monsoon precipitation variability during the last millennium. Geophys. Res. Lett. 38, 1–5 (2011).
-
Xue, Y. X. et al. Quantifying source effects based on rainwater δ18O from 10-year monitoring records in Southwest China. Appl. Geochem. 155, 105706 (2023).
-
Yin, J. J. et al. Variation in the Asian monsoon intensity and dry-wet condition since the little ice age in central China revealed by an Aragonite stalagmite. Clim. Past 10, 1803–1816 (2014).
-
Rayleigh, S. R. S. L. Theoretical considerations respecting the separation of gases by diffusion and similar processes. Philos. Mag. 42(259), 493–498 (1896).
-
Tan, M. Circulation effect: Response of precipitation δ18O to the ENSO cycle in monsoon regions of China. Clim. Dyn. 42(3–4), 1067–1077 (2014).
-
Wan, N. J. et al. Spatial variations of monsoonal rain in Eastern China: Instrumental, historic and speleothem records. J. Asian Earth Sci. 40(6), 1139–1150 (2011).
-
Tan, L. C. et al. Rainfall variations in central Indo-Pacific over the past 2,700 y. Proc. Natl. Acad. Sci. USA 116(35), 17201–17206 (2019).
-
Wang, L. C. et al. Increased precipitation during the little ice age in Northern Taiwan inferred from diatoms and geochemistry in a sediment core from a subalpine lake. J. Paleolimnol. 49(4), 619–631 (2013).
-
Chu, G. Q. et al. The mediaeval warm period drought recorded in lake Huguangyan, tropical South China. Holocene 12(5), 511–516 (2002).
-
He, B. Y., Zhang, S. & Cai, S. M. Climatic changes recorded in peat from the Dajiu lake basin in Shennongjia since the last 2,600 years. Mar. Geol. Quat. Geol. 23(2), 109–115 (2003).
-
Sheng, E. G. et al. Late holocene Indian summer monsoon precipitation history at lake Lugu, Northwestern Yunnan Province, Southwestern China. Palaeogeogr. Palaeoclimatol. 438, 24–33 (2015).
-
Xu, H. et al. Late holocene Indian summer monsoon variations recorded at lake Erhai, Southwestern China. Quat. Res. 83(2), 307–314 (2015).
-
Cao, J. T., Chen, F. J., Chu, G. Q. & Jia, G. D. Persistent coast mode of precipitation in southeast China over the last millennium. Geophys. Res. Lett. 51, e2024GL109379 (2024).
-
Mohtadi, M., Prange, M. & Steinke, S. Palaeoclimatic insights into forcing and response of monsoon rainfall. Nature 533(7602), 191–199 (2016).
-
Griffiths, M. L. et al. Western Pacific hydroclimate linked to global climate variability over the past two millennia. Nat. Commun. 7, 11719 (2016).
-
Wang, P. X. et al. The global monsoon across time scales: Mechanisms and outstanding issues. Earth-Sci. Rev. 174, 84–121 (2017).
-
Wu, Y. et al. Variations in Asian summer monsoon and hydroclimate during Heinrich stadials 4 revealed by stalagmite stable isotopes and trace elements. Quat. Sci. Rev. 299, 107869 (2023a).
-
Wu, Y. et al. Northern hemisphere summer insolation and ice volume driven variations in hydrological environment in Southwest China. Geophys. Res. Lett. 50, e2023GL105664 (2023).
-
Schneider, T., Bischoff, T. & Haug, G. H. Migrations and dynamics of the Intertropical convergence zone. Nature 513(7516), 45–53 (2014).
-
Zhao, K. et al. Contribution of ENSO variability to the East Asian summer monsoon in the late holocene. Palaeogeogr. Palaeoclimatol. 449, 510–519 (2016).
-
Haug, G. H., Hughen, K. A., Sigman, D. M., Peterson, L. C. & Röhl, U. Southward migration of the Intertropical convergence zone through the holocene. Science 293(5533), 1304–1308 (2001).
-
Jin, L. Y. et al. The spatial-temporal patterns of Asian summer monsoon precipitation in response to holocene insolation change: A model-data synthesis. Quat. Sci. Rev. 85, 47–62 (2014).
-
Yan, H. et al. A record of the Southern Oscillation index for the past 2,000 years from precipitation proxies. Nat. Geosci. 4, 611–614 (2011).
-
Berkelhammer, M. et al. On the low-frequency component of the ENSO-Indian monsoon relationship: A paired proxy perspective. Clim. Past 10(2), 733–744 (2014).
-
Zhang, J., Liang, M. Q., Li, T. Y., Chen, C. J. & Li, J. Y. Asian-Australian monsoon evolution over the last millennium linked to ENSO in composite stalagmite δ18O records. Quat. Sci. Rev. 281, 107420 (2022).
-
Chen, C. J. & Li, T. Y. Geochemical characteristics of cave drip water respond to ENSO based on a 6-year monitoring work in Yangkou cave, Southwest China. J. Hydrol. 561, 896–907 (2018).
-
Zhang, J. & Li, T. Y. Annual variations of hydrochemical characteristics and stable isotopic compositions of drip waters in furong cave, Southwest China based on 12 years’ monitoring. J. Hydrol. 572, 40–50 (2019).
-
Kerr, R. A. A North Atlantic climate pacemaker for the centuries. Science 288(5473), 1984–1985 (2000).
-
Zhang, R. et al. A review of the role of the Atlantic meridional overturning circulation in Atlantic multidecadal variability and associated climate impacts. Rev. Geophys. 57(2), 316–375 (2019).
-
Grinsted, A. & Moore, J. C. Application of cross wavelet transform and wavelet coherence to geophysical time series. Nonlinear Proc. Geophys. 11, 561–566 (2004).
-
Lu, R. Y., Dong, B. W. & Ding, H. Impact of the Atlantic multidecadal Oscillation on the Asian summer monsoon. Geophys. Res. Lett. 33(24), L24710 (2006).
-
Lu, R. Y. & Dong, B. W. Response of the Asian summer monsoon to weakening of Atlantic thermohaline circulation. Adv. Atmos. Sci. 25(5), 723–736 (2008).
-
Wang, Y. M., Li, S. L. & Luo, D. H. Seasonal response of Asian monsoonal climate to the Atlantic multidecadal Oscillation. J. Geophys. Res. Atmos. 114(D2), D02112 (2009).
-
Si, D., Hu, A. X., Jiang, D. B. & Lang, X. M. Atmospheric teleconnection associated with the Atlantic multidecadal variability in summer: Assessment of the CESM1 model. Clim. Dyn. 60(3–4), 1043–1060 (2023).
-
Wang, J. L. et al. Internal and external forcing of multidecadal Atlantic climate variability over the past 1,200 years. Nat. Geosci. 10, 512–517 (2017).
-
Zhang, Z. Q., Sun, X. G. & Yang, X. Q. Understanding the interdecadal variability of East Asian summer monsoon precipitation: Joint influence of three oceanic signals. J. Clim. 31(14), 5485–5506 (2018).
-
Si, D., Jiang, D. B. & Ding, Y. H. Synergistic impacts of the Atlantic and Pacific oceans on interdecadal variations of summer rainfall in Northeast Asia. J. Meteorol. Res-Prc 35(5), 844–856 (2021).
-
Jiang, D. B., Si, D. & Miao, J. P. Impacts of Atlantic multidecadal Oscillation on the East Asian climate: A review. Chin. J. Atmos. Sci. 48(1), 261–272 (2024) (in Chinese).
-
Wu, Y. et al. Variation of the Asian summer monsoon since the last glacial-interglacial recorded in a stalagmite from Southwest China. Quat. Sci. Rev. 234, 106261 (2020).
-
Hendy, C. H. 1971. The isotopic geochemistry of speleothems-1. The calculation of the effects of different modes of formation on the isotopic composition of speleothems and their applicability as palaeoclimate indicators. Geochim. Cosmochim. Acta 35, 801–824 (2003).
-
Fairchild, I. J. et al. Modification and preservation of environmental signals in speleothems. Earth-Sci. Rev. 75, 105–153 (2006).
-
Ge, Q. S., Zheng, H. J. & Shao, X. Temperature changes over the past 2,000 year in China and comparison with the Northern hemisphere. Clim. Past 9, 1153–1160 (2013).
-
Zhang, Z. B. et al. Periodic Climatic cooling enhanced natural disasters and wars in China during AD 10 – 1,900. Proc. R. Soc. B-Biol. Sci. 277(1701), 3745–3753 (2010).
-
Hu, Z. Y., Fan, H. W., Liu, Y. H., Wu, Z. P. & Hu, C. Y. Separation of the Asian summer monsoon and local precipitation from stalagmite oxygen isotope records in Eastern China during the last millennium. Quat. Sci. Rev. 325, 108498 (2024).
-
Yan, D. D., Wünnemann, B., Zhang, Y. Z. & Andersen, N. Holocene Climatic and tectonic forcing of decadal hydroclimate variation on the north-eastern Tibetan plateau. Quat. Sci. Rev. 326, 108514 (2024).
-
Fan, H. W. et al. Transitions between Chinese dynasties influenced by spatial-patterned precipitation. Quat. Sci. Rev. 346, 109069 (2024).
-
Wang, M. M. et al. Stalagmite records of Spatiotemporal hydroclimatic variations in monsoonal China during 47 – 12 ka BP. Glob. Planet. Change 244, 104639 (2025).
-
Yin, Q. Z., Zhang, H. W. & Trauth, M. H. Global monsoonal systems during the last glacial-interglacial cycle. Quat. Sci. Rev. 349, 109144 (2025).
-
Chen, J. S. et al. El Niño-Southern Oscillation signals imprinted in stalagmite δ18O from 2,005 to 2,017. Quat. Int. 715, 109631 (2025).
-
Ding, W. N. et al. Strong coupling between the East Asian summer monsoon and regional hydrological conditions as evidenced by multiproxy stalagmite records for the last deglaciation. Quat. Sci. Rev. 345, 109023 (2024).
-
Yang, S. D. et al. Assessing the impacts of rural depopulation and urbanization on vegetation cover: Based on land use and nighttime light data in China, 2000–2020. Ecol. Indic. 159, 111639 (2024).
-
Sukkar, A., Abulibdeh, A., Essoussi, S. & Seker, D. Z. Investigating the impacts of climate variations and armed conflict on drought and vegetation cover in Northeast Syria (2,000-2,023). J. Arid Environ. 225, 105278 (2024).
-
Wang, Y. Y., Liu, S. N. & Shi, H. Y. Comparison of climate change impacts on the growth of C3 and C4 crops in China. Ecol. Inf. 74, 101968 (2023).
Acknowledgements
This research was supported by the Yunnan Fundamental Research Projects (Grant 202201AS070022), the Young and Middle-age Academic and Technical Leader in Yunnan Province (No. 202205AC160025) to T.-Y Li; National Natural Science Foundation of China (NSFC, No. 42272214, 42172204, and 42488201), to T.-Y Li, J.-Y Li and H Cheng. Yao Wu received support through a grant by the China Scholarship Council (No. 202106990014). This research was also supported by the Open Project Program of Chongqing Key Laboratory of Karst Environment (Grant No. Cqk202301), and project (No. 2023ZB003) of Yunnan Normal University for C.-J Chen.
Author information
Authors and Affiliations
Contributions
C.-Y.W. wrote the main manuscript, J.-Y.L., C.-J.C., J.Z., Y.W., H.C., C.-C.S. and T.-Y.L. reviewed the manuscript.
Corresponding authors
Ethics declarations
Competing interests
The authors declare no competing interests.
Additional information
Publisher’s note
Springer Nature remains neutral with regard to jurisdictional claims in published maps and institutional affiliations.
Electronic supplementary material
Below is the link to the electronic supplementary material.
Rights and permissions
Open Access This article is licensed under a Creative Commons Attribution-NonCommercial-NoDerivatives 4.0 International License, which permits any non-commercial use, sharing, distribution and reproduction in any medium or format, as long as you give appropriate credit to the original author(s) and the source, provide a link to the Creative Commons licence, and indicate if you modified the licensed material. You do not have permission under this licence to share adapted material derived from this article or parts of it. The images or other third party material in this article are included in the article’s Creative Commons licence, unless indicated otherwise in a credit line to the material. If material is not included in the article’s Creative Commons licence and your intended use is not permitted by statutory regulation or exceeds the permitted use, you will need to obtain permission directly from the copyright holder. To view a copy of this licence, visit http://creativecommons.org/licenses/by-nc-nd/4.0/.
About this article
Cite this article
Wang, CY., Li, JY., Chen, CJ. et al. Evolution of the Asian summer monsoon and regional karst ecological environment since the middle ages in Southwest China.
Sci Rep 15, 8091 (2025). https://doi.org/10.1038/s41598-025-92634-0
-
Received: 18 September 2024
-
Accepted: 03 March 2025
-
Published: 08 March 2025
-
DOI: https://doi.org/10.1038/s41598-025-92634-0
Keywords
Search
RECENT PRESS RELEASES
Related Post


