XRP Already Recovered 20%, Enormous Ethereum (ETH) Selling Volume Before $2,000, Sixth Shiba Inu (SHIB) Recovery Attempt: Another Crash?
March 14, 2025
Advertisement
After hitting recent lows, XRP has recovered, significantly rising by about 20%. After striking important support levels, the asset quickly recovered, giving investors new hope. Regaining several resistance levels during the ascent is among the most noteworthy aspects of XRP’s recent price movement. This shows that after weeks of bearish dominance, buyers are progressively taking back control.
The fact that XRP is currently trading close to $2.38 indicates a significant improvement in buying pressure and sentiment. Now that XRP is getting close to the 100-day Exponential Moving Average (EMA), which has historically served as a potent resistance level, a significant technical milestone is in store. A more prolonged bullish phase with price targets extending toward the upper boundary of the descending channel at $2.60 may be indicated if the asset is able to break through this barrier.
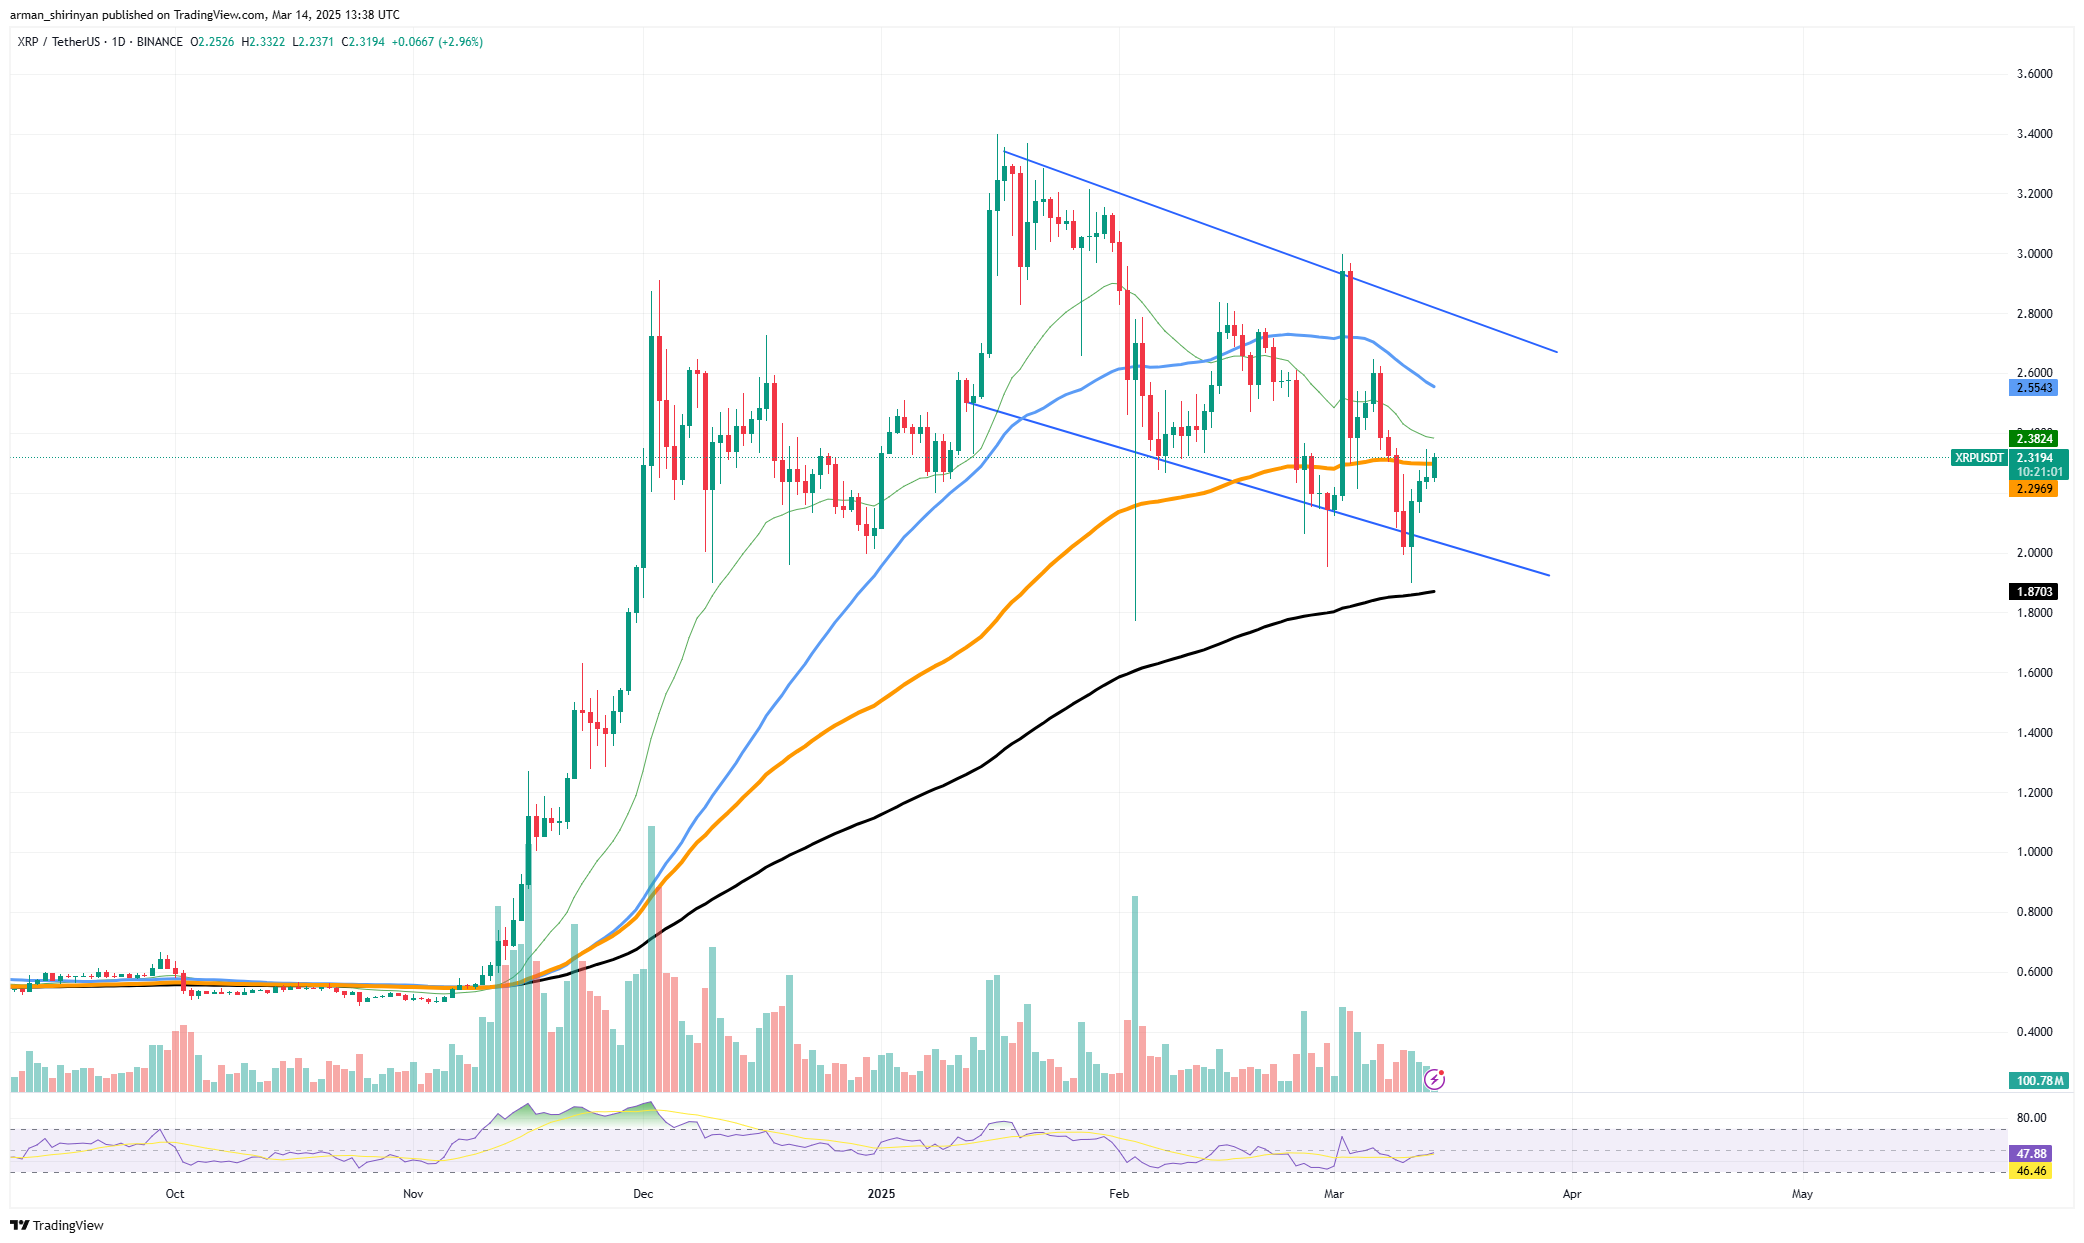
Furthermore, the recovery attempt is being supported by volume dynamics. When trading activity steadily rises, it suggests that the buying momentum is a change in market positioning rather than merely a phased reaction. A healthier market state is also reflected by the Relative Strength Index (RSI), which is shifting out of the oversold area. However, difficulties still exist.
The overall cryptocurrency market continues to be volatile, and sustained demand is necessary for XRP to continue on its upward trajectory. If the 100 EMA is not broken, there may be another pullback, possibly retesting lower levels around $2.20.
Advertisement
Ethereum reversal potential
Because of the strong selling pressure on Ethereum, the $2,000 mark is becoming more and more elusive. With volume increasing as traders sell off their holdings, recent price action indicates that bearish momentum is still in control despite slight recoveries. The market’s selling volume has significantly increased, suggesting that a large number of entities are selling their ETH holdings.
A spike in volume during a downtrend usually indicates strong seller conviction, which makes it harder for the price to turn around. This is exactly where ETH is at right now, with more selling pressure following each small rebound. Upon closer examination, Ethereum‘s price action shows that it is having difficulty maintaining its upward momentum. As significant resistance levels, the 50-day and 100-day EMAs have kept the asset below important moving averages.
Any recovery attempt may not last long until ETH regains these levels. The market sentiment surrounding Ethereum is heavily influenced by the $2,000 psychological threshold. ETH might signal further losses in the future if it is unable to retest this level. Ethereum may decline toward the next support zones at $1,800 and possibly lower if selling pressure continues.
According to the current downward trend, buyers are holding off on entering the market until a more distinct bottom formation has formed. A change in the mood of the market is necessary for ETH to escape this selling cycle.
Shiba Inu’s retrace attempt
For the sixth time, Shiba Inu is making an attempt to recover lost ground. However, the asset’s upside potential is still being challenged by the strong resistance levels and ongoing downtrend. SHIB is currently circling the $0.000012 level, a critical cutoff that has served as a major support area in recent months.
A clear move above this level might signal a more robust recovery effort, but the momentum is still unclear at this point. In assessing whether this attempt will differ from earlier unsuccessful recoveries, the general state of liquidity and the sentiment of the market as a whole continue to be crucial factors. Technically speaking, SHIB is having trouble staying above its 50-day moving average, which is presently supporting downward pressure.
The fact that the asset is still trading below the 100- and 200-day moving averages further emphasizes the market’s bearish hegemony. Any short-term rebound is tentative until these levels are regained. The price of $0.0000135, where the last unsuccessful recovery attempt was rejected, is the next significant resistance level for SHIB.
The $0.000015 region, a crucial psychological level for traders, may be the next target if the asset is able to break through. The asset might retest the $0.000011 support zone on the downside if SHIB is unable to maintain its position above that level. SHIB may accelerate losses and move closer to the crucial $0.00001 mark if there is a breakdown below this region.
Search
RECENT PRESS RELEASES
