Integration of wind flow effects in theoretical and experimental models for solar power generation
March 15, 2025
Abstract
The increasing demand for sustainable energy solutions has highlighted the need to optimize solar power generation systems. While solar power has been extensively studied, the influence of local wind flow on solar irradiance and power generation remains underexplored. This study addresses this gap by developing a differential model that incorporates both solar irradiance and wind flow effects to enhance the prediction of solar power generation across various regions in Uganda. Key qualitative findings suggest that regions with higher wind flow significantly enhance solar power efficiency, revealing potential opportunities for optimizing solar facility locations. Numerical findings show that the northern region yielded the highest solar power generation ((132.8 ,textWm^-2)), followed closely by the eastern ((132.7 , textWm^-2)), western ((127.2 , textWm^-2)), and central ((119.6 ,textWm^-2)) regions. Error analysis using the RMSE indicator confirms the validity of the model with values of 0.9701, 0.8215, and 6.4186 for the northern, central, and western regions, respectively. This work proposes an integrated approach to solar power generation, considering both solar irradiance and wind flow effects, with the potential to identify optimal deployment sites for solar facilities. Consequently, the study suggests deploying solar facilities in regions with higher solar power distribution and transmitting energy to areas with sparse distribution. Further studies are needed to conduct a comprehensive assessment of solar potential in varying environmental conditions.
Introduction
Solar renewable energy is abundant and harvestable in all parts of the world, making it a fast-growing industry with immense potential. According to Louwen and van Sark1, advancements in photovoltaic technology have contributed significantly to reducing costs, enabling widespread adoption of solar energy. Similarly, Zahedi2 highlights the role of solar power as a sustainable alternative that can mitigate environmental challenges caused by fossil fuel consumption. In addition, Chu and Meisen3 emphasize the capacity for growth of solar energy systems, which can cater to both large-scale grid systems and decentralized applications in remote areas. Furthermore, Fashina et al.4 provide evidence of the growing acceptance of solar energy in emerging economies, showcasing its potential to drive economic growth while addressing energy deficits. Looking back, the sun emits its photons in all directions which provides the necessary source of energy needed to sustain life of all kinds on earth5,6. The sunlight from the sun can be utilized directly by collecting it and using it in a thermal system. Guarracino et al.7 discuss advancements in thermal systems for harnessing solar energy efficiently. Alternatively, sunlight can be converted directly to electrical energy using semiconductor materials in solar photovoltaic systems (SPV). Singh8 highlights the principles and development of SPV technologies, while Otanicar et al.9 explores innovative techniques to enhance their efficiency. Furthermore, Nnamchi et al.10 examine recent breakthroughs in materials science for improving solar energy conversion in SPV systems. However, solar PV is the easiest and direct approach to capture sunlight and convert it directly into electricity11. Fundamentally, the incident photons from the sun are absorbed by the semiconductor material, creating an electrostatic field in the region between the layers of the material, enabling it to generate electricity. Rashid (12 and Nnamchi et al.13 provide detailed understandings into the mechanisms of photon absorption and field generation in semiconductors. Similarly, Solanki14 and Sauer15 explore advancements in semiconductor materials and their efficiency in electricity generation. The generation of electricity from solar energy offers a renewable clean source of energy for powering houses, industries and as a driver for all other sectors of the economy4. Correspondingly, India is the home to the largest solar power plant in the world, 2,245Â MW16 followed by China 2.2 GW17. In comparison, Uganda has a total installed capacity of 50Â MW from four different plants to boast the national grid18,19,20. Uganda has significant solar potential, with an average global horizontal irradiation of 1680 kWh/m2 per year and daily variability below 10%21. The northern region receives the highest average daily irradiation, while the western region receives the lowest. Solar potential varies spatially and temporally, with maxima at equinox and minimum between June and July. Clearness index ranges from 0.5123 to 0.6224 across different regions22. The market potential for solar PV systems is substantial, with approximately 5.3 million households lacking electricity access23. Mercatorian and spatial solar power potential models have been developed to guide preliminary design and installation of solar facilities24. These studies provide valuable insights for optimizing solar energy exploitation in Uganda, with the northern region showing the highest potential for efficient solar installations.
Scientifically, the power generated by SPV module depends on both exogenous and endogenous factors namely; the effect of temperature on the semiconductor material25,26,27,28. However, high-quality PV modules are optimized to sustain higher temperatures. The module operating temperature of the photovoltaic generators, (T_pvg) can be determined by29,30,31,32,33 in Eq. (1).
where (T_air) (°C) is the ambient air temperature and (G_0) ((textWm^-2)) is the solar irradiance and (k) (Ross coefficient) is the gradient of the plot of temperature difference against solar radiation flux. This coefficient is used to quantify the relationship between temperature difference ((Delta T)) and solar radiation flux, typically in a linear regression analysis. For the present study, Eq. (1) connects theoretical modeling of solar power generation with practical environmental factors such as temperature and wind flow. It enhances the model’s ability to predict solar panel performance across different regions, identify optimal locations for solar installations, and guide system designs to maximize efficiency under varying climatic conditions in Uganda. Additionally, the electricity generated by SPV module also depends on, the energy conversion efficiency of the SPV systems33 in Eqs. (2) and (3).
where (P_m) ((W)) is the output power of the generator, (P_in) is the input power taken at STC to be (1000,textWm^-2) and (A_pvg) ((m^2)) is the catchment area available for generation which is also given in terms of the short circuit current, (I_sc left(Aright)) and the short circuit current density, (J_sc) ((A)).
Moreover, the inefficiency of photovoltaic generators in the industry 15–20%34, has remained a big hindrance to maximize solar power generation. This conversion efficiency specification from the market indicates that only 15–20% of electricity is generated from the solar irradiation incident on the SPV module surface.
Furthermore, the power generated by SPV module is also affected by; the performance or strength of spectral solar irradiance26,35, alignment of the solar module in the direction of sunlight36,37 and the catchment surface area of the panel exposed to sunlight to generate more of electricity38,39. Correspondingly, the present work will set up a pilot solar system (experimental rig) for measurement of solar power available in Kampala district (central region) to be able to make an inter-comparison with the theoretical or modelled power in the same location. This will tell how best the decision-makers will develop different regions of Uganda using solar power.
In effect, various authors have performed studies related to solar power generation in different places using different approaches. Correspondingly, Chiu40 proposed a fussy modelling direct (MPPT) model or method for generating solar power that’s better than other techniques because it can generate more solar power. Subsequently, Paul41 in his study (Tanzania) to compare the experimental power to the theoretical power of a hybrid SPV system found that the theoretical power available is higher than the experimental power generated. In this study, the author measured the electrical parameters of current and voltage from the experimental observations which was substantiated with three other meteorological parameters for the theoretical power to arrive at the novelty of the study. Further, Ghasemi et al.42 in their study to estimate the generation of solar power harvestable in two locations in Iran using both photovoltaic and concentrated solar power generators considered in their computation; the annual solar irradiance of the locations, the efficiency of the solar generators, the total catchment area of the generators and the performance of the SPV system. They found that the theoretical approach their study used yielded higher annual solar power than the technical approach in solar power generation. However, the present study focused on both theoretical and experimental solar power generation using only photovoltaic generators at national and regional levels (northern, eastern, central and western regions) in Uganda. Nevertheless, Yamegueu et al.43 carried out experimental study using a hybrid system for solar power generation and found that its performance depends on the output from the PV generator. In a related study for solar power generation using hybrid system, Wu et al.44 applied five predictive models based on historical data. The models were applied for prediction of solar power generation using three PV generators. Their findings indicate that the hybrid models generated better results. In a related study to forecast solar power, Wan et al.45 also considered the ambient temperature and reflectivity of the photovoltaic generators as factor in solar power generation. Correspondingly, El Mnassri & Leger46 considered the solar irradiance of the location and the power rating of the PV module in the estimation of solar power generated for a standalone SPV system. Chen et al.47 also established a model for the estimation of solar PV power generation dependent on the solar irradiance and the ambient temperature of the module. However, the present study in addition considers the efficiency of the PV module and its catchment surface area in the computation of solar power generation for various solar applications. In another study, Mekhail et al.48 used thermodynamics model to predict the performance of solar facility (solar chimney) installed in the Egyptian city, Aswan for generation of solar power. The results obtained from the developed model indicated goodness of fit between the theoretical and the experimental performance of the solar facility. Similar studies to Mekhail et al.48 for solar power generation using predictive models for the performance of solar facility have been conducted in Iran49,50. Remarkably, Eswaramoorthy et al.51, used parabolic dish generator for solar power generation. They considered the temperature of the dish, the incident solar irradiance and the current and voltage generated by the collector. Contrarily, Natsheh and Albarbar52 used PV generators together with other balance of system components (BOS) to measure the system parameters for computation of actual solar power generated by the modules. The results obtained from the comparison between technical power and theoretical power indicated goodness of fit for the solar facility.
Exceptionally, solar energy potential assessment is critical for identifying optimal locations for solar power installations. Previous studies, such as the assessment of solar energy potential in the western Himalayan state of Himachal Pradesh using the J48 algorithm of WEKA in an artificial neural network-based prediction mode53, demonstrate the effectiveness of combining machine learning tools with traditional methodologies for enhanced accuracy. Inspired by such studies, the present work applies unique local factors, including wind flow effects, to improve the predictive accuracy of solar potential assessment in Uganda. Additionally, the study develops and validates a solar power generation model that integrates the effects of wind flow and climatic factors. While the model is applied to all the regions of Uganda, its purpose is to establish a foundational approach to solar potential assessment. Future studies will expand upon this work for comprehensive solar potential mapping.
Outstandingly, Photovoltaic collectors hold paramount importance in renewable energy as they directly convert sunlight into electricity, offering a sustainable and abundant power source without emitting greenhouse gases or pollutants54. By diversifying the energy mix and reducing reliance on fossil fuels, photovoltaic generators contribute significantly to energy security55. Their deployment mitigates environmental impacts associated with conventional energy sources, such as air and water pollution, habitat destruction, and resource depletion56. Furthermore, the growing PV industry creates job opportunities, stimulates economic growth, and fosters innovation in manufacturing, installation, and maintenance sectors57 PV systems enable decentralized power generation, facilitating off-grid electrification in remote areas and enhancing energy access for underserved communities58. Distributed PV installations also enhance grid resilience by reducing vulnerabilities to centralized failures, natural disasters, and geopolitical tensions59. Moreover, PV electricity displaces carbon-intensive generation, contributing to climate change mitigation efforts and helping countries meet emissions reduction targets60. Ongoing research and development in PV technology drive efficiency improvements, cost reductions, and performance enhancements, making solar power increasingly competitive with conventional energy sources61,62. Collectively, these aspects underscore the critical importance of photovoltaic collectors in the transition towards a sustainable energy future.
Analytically, taking into account the gaps drawn from the earlier studies in terms of content, context, theory and methods; the present work distinctively connected two photovoltaic generators in series with no charge storage system for the outdoor experiment to determine the output power generated to compare with the theoretical power generated based on solar power potential model, SPP ((phi , lambda)) and wind speed model, (u (phi , lambda )) records from satellite and local meteorological centers for non-regional and regional localization of solar power in Uganda. The electrical parameters considered and measured for the experimental power produced by the photovoltaic generators are current and voltage. The present study also considered and measured the surface temperature of the generators and the wind speed just above the surface of the generators.
Solar energy, as a clean, renewable, and abundant resource, has garnered significant attention in addressing global energy demands. Photovoltaic technology, a primary method for harnessing solar energy, is increasingly deployed in both developed and developing regions. However, accurately quantifying the solar power potential at specific locations remains a challenge, particularly when accounting for localized factors such as wind flow and regional insolation variability. Existing studies primarily rely on theoretical power predictions that overlook critical derating effects, such as those introduced by wind dynamics, leading to overestimated outputs and underutilization of solar resources. This gap emphasizes the need for models that reflect realistic, location-specific solar power potential.
Specifically, the objective of this study is to develop and validate a differential model for solar power generation that integrates the effects of local wind flow and regional wind velocity on photovoltaic systems. This approach not only refines the theoretical estimation of solar power but also bridges the gap between theoretical predictions and practical performance in Uganda.
The novelty of this work lies in incorporating wind flow effects as a derating factor in solar power modeling, an aspect often ignored in similar studies. The proposed model offers a unique contribution by providing more accurate and practical information into the deployment of photovoltaic systems in wind-sensitive regions. Unlike traditional solar models that solely rely on solar irradiance, this model considers the cooling effects of wind, offering a more accurate and region-specific prediction of solar power potential. By combining theoretical modeling with empirical validation, this study establishes a robust framework for optimizing solar power generation in the northern, eastern, central, and western regions of Uganda, offering recommendations for deploying solar facilities in high-potential areas. The findings are important for planning solar power projects, optimizing system design, and addressing the Sustainable Development Goals (SDGs) related to clean energy and climate action.
Materials and methods
This study adopts a hybrid approach to solar energy potential assessment, integrating empirical measurements with computational modeling techniques. Similar to the methodology applied by Yadav and Chandel53, which utilized the J48 algorithm and ANN-based prediction for solar energy potential mapping, the present work applies a region-specific solar power model that incorporates wind flow effects and local climatic factors. This approach ensures a robust assessment targeted to the unique geographical and climatic conditions of Uganda. Furthermore, this study integrates wind flow effects into solar power prediction by employing a differential model. For the present work, the test rig facility for the experiment is made up of two (2) PV generators (ASE SOLAR EN61000/IEC62321), each rated at (80 W)(STC). The manufacturer’s technical specifications is presented in Table 1. Other materials include pre-calibrated digital multi-meter (ALDA AVD-830D) and electrical clamp multi-meter (BESTIR 38,626) for recording the output voltage and the output current of the generators with no external load. Additionally, the ambient temperature was measured using infrared temperature sensors (Benetch GM900). It is important to note that the temperature measurement using the infrared sensor was deployed at the back sheet of the generators to avoid the effect of front surface reflection interfering with the results. Besides, it was deployed at the middle of the generators, safe from the effects of wind and humidity to ensure correct readings are observed to ensure that conclusions and recommendations derived from the present study are grounded on very accurate experimental observations. Other balance of system components include alligator clips and MC4 cable connectors. The following measurements were taken and recorded in intervals of 30 min from 8:00 am to 6:00 pm; the ambient temperature ((T_amb)), wind speed ((u)), output current ((I)) and the output voltage ((V)) of the generators. Moreover, a quadragenarious data on wind speed, ambient temperature was also acquired from NASA POWER and measured data from local meteorological centers (Uganda National Meteorological Authority). The experimental data from the study location was used to validate the performance of solar power generation model developed using the measured and meteo-sat data from the four locations of the present study.
The technical specifications for polycrystalline photovoltaic generators at Standard Test Conditions (STC), including an irradiance of 1000 (textWm^-2), cell temperature of 25 °C, and air mass of AM 1.5, typically encompass parameters important for evaluating module performance. These specifications comprise the Peak Power ((P_max)), representing the maximum power output in watts ((W)) under STC, Open-Circuit Voltage ((V_oc)) indicating the voltage across the module under no-load conditions in volts ((V)), Short-Circuit Current ((I_sc)) measuring the maximum current under short-circuit conditions in amperes ((A)), Voltage at Peak Power ((V_pmax)), and Current at Peak Power ((V_pmax)).
Additionally, efficiency, expressed as a percentage, is calculated by dividing (P_max) by the total incident solar power. Temperature coefficients, detailing the rate of change of module performance with temperature, are often provided for (P_max), (V_oc), and (I_sc), aiding in estimating module performance under different operating conditions. These comprehensive specifications facilitate the evaluation and comparison of polycrystalline PV modules for various solar energy applications, aiding in informed decision-making and system design. The efficiency of the PV generator (ASE SOLAR) calculated using Eq. (2) at STC conditions is 15.147%. The test rig apparatus was set up as shown in Fig. 1 (block diagram) and Fig. 2 (Pictographic). In each of the figures shown, the generators are connected in series to obtain an SPV system working at a required voltage and power output.
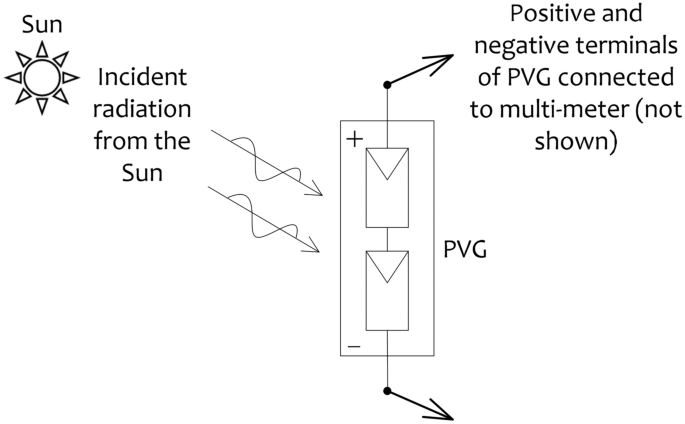
Block diagram for the power generation scheme.
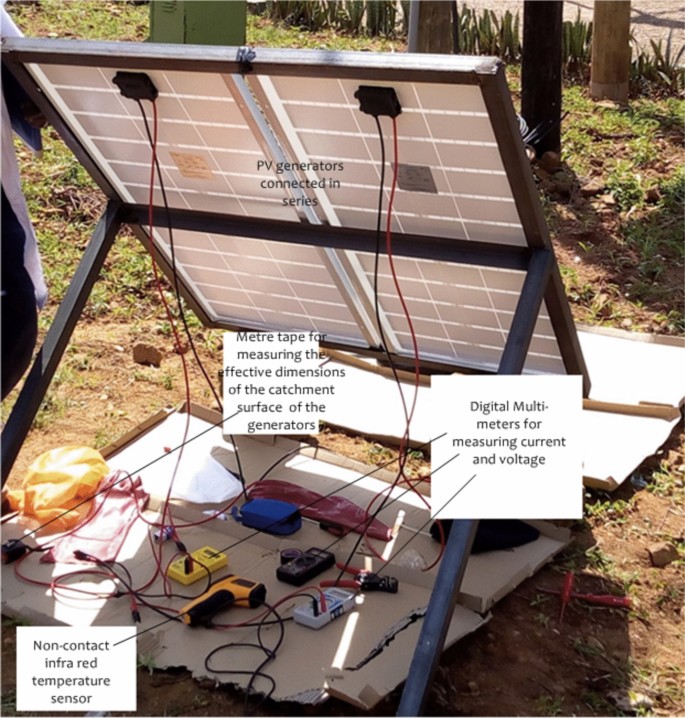
Pictographic outdoor experimental test rig for data collection at site.
Site selection for the outdoor experiment
The modelling and simulation for the solar power generation was conducted for all the four regions of Uganda; northern, eastern, central and western regions.
Nevertheless, the test rig for the experimental power output for the PV generators was set in Kampala district, the largest city in Uganda, located in the central part of the country near the shorelines of Lake Victoria. Its geographical coordinates are: lat. 0.320° N, long. 32.588°E and its elevation above sea level is 1177 m. The study location, Kampala, experiences the warmest months of the year from January to March (27–28 °C) with June at low average temperature of 21 °C representing a typical tropical climate. The average day length is 12.1 h, sunrise is at 6:36 am and sunset is at 6:42 pm with mean wind speed of (3 ms^-1) north east. Thus, selecting Kampala district, for an outdoor experiment on solar power generation in this environment provides a unique opportunity that can yield impactful research, relevant and applicable to other regions with similar climatic conditions.
Model formulation
The existing theoretical power (underrated power), (P_T) ((W)) for a photovoltaic generator is given by Eq. (4)
where (eta _pvg) ((-)) is the solar photovoltaic module rated efficiency, SPP (left(textWm^-2right)) is the solar power potential on horizontal surface for a specified location (Nnamchi et al., 2020) and (A_pvg) ((m^2)) is the catchment surface area of the module available for power generation. Therefore, the underrated power density or power flux is given by Eq. (5)
The proposed model caters for the actual power generation via deration of the power generated by introducing the effectiveness of wind in the PV generators. Outstandingly, the relative velocity or the effectiveness of wind flow is given by Eq. (6)
where (u(phi , lambda )) is the local wind flow model for solar power generation dependent on the latitude, (phi) and longitude, (lambda) of the locations for the present study and (u_max)((phi , lambda )) is the maximum velocity of wind at non-regional, northern, eastern, central and western regions of Uganda22,63.
Correspondingly, the actual power (derrated theoretical actual power) gives the true power that can be harvested in a given location. It is expressed in Eq. (7)
or
Correspondingly, the measured or experimental power ((P_exp)) is computed from experimental observations using Eq. (8)
where (m) is an arbitrary number that will drive the present power close to the measured power.
Results and discussion
This section presents the findings of the study, its interpretations, context and the importance of the findings.
Results
Figures 3, 4, 5, 6, and 7 presents the distribution of theoretical power from previous studies (a) and actual power from the present study via deration (b) after considering the of effect on insolation. The power distribution matrices are made navigable on the locations (latitude and longitude) of the present study. The navigation or the solar power distribution is formulated on non-regional and regional basis for; northern, eastern, central and western regions of the country, respectively. Additionally, Fig. 8 presents the graphical validation of the solar power model against the theoretical power from previous studies and the measured or experimental power from the study location of the present work. In addition to the visual validation, the performance of the error analysis using the statistical indicator, RMSE reveal that the model performance for the location in the northern region, the central region and the western region has values of 0.9701, 0.8215 and 6.4186.
Non-regional solar power distribution.
Regional solar power distribution for northern region.
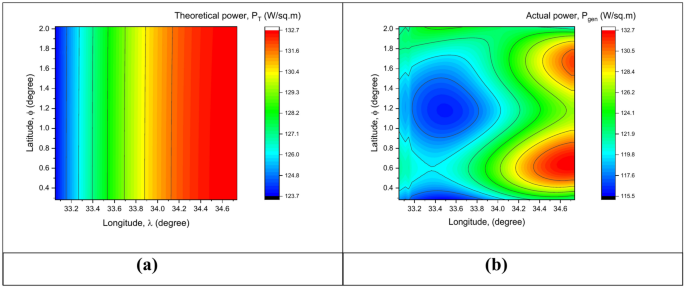
Regional solar power distribution for eastern region.
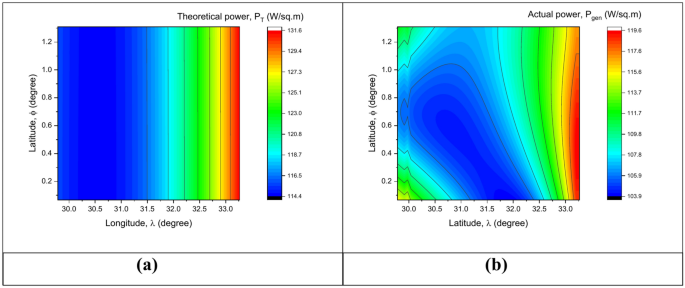
Regional solar power distribution for central region.
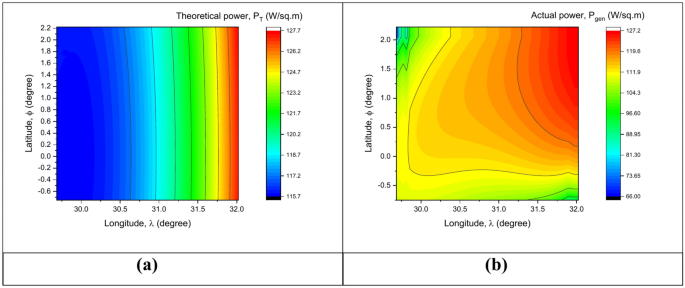
Regional solar power distribution for western region.
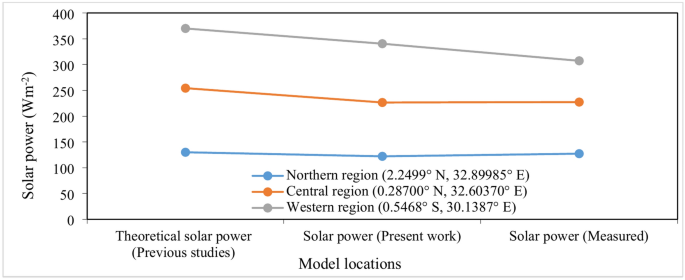
Validation of modelled solar power against theoretical and measured power.
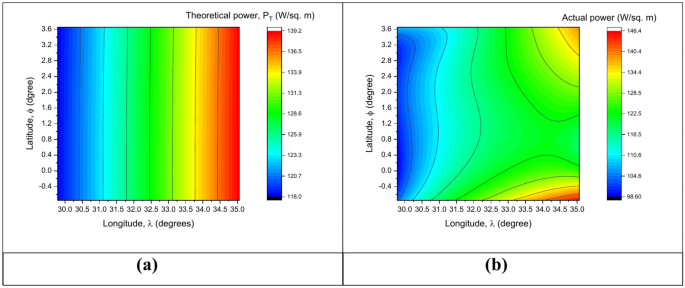
Figure 3 presents a comparison of theoretical solar power (Fig. 3a) derived from previous studies and actual solar power (Fig. 3b) determined through deration to account for insolation effects. The theoretical power shows a uniform gradient from (118 ,textWm^-2) (blue) to (139.2 ,textWm^-2) (red) across the study area. However, the actual power distribution reflects significant deviations, with values ranging from (98.6 ,textWm^-2) to (146.4 ,textWm^-2), indicating regional variability. High actual solar power hotspots are observed predominantly in the eastern part of the study area.
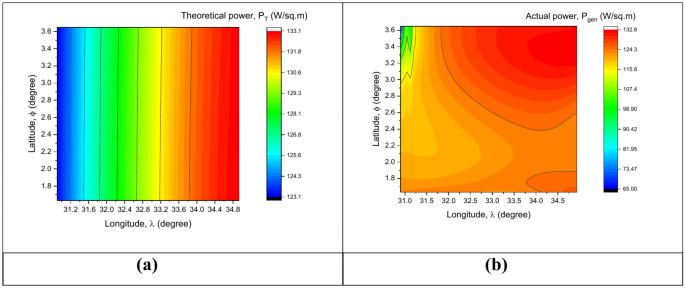
Figure 4 compares the theoretical solar power distribution (Fig. 4a) with the actual power distribution for the northern region (Fig. 4b). The theoretical solar power ranges from (123.1 ,textWm^-2) to (133.1 ,textWm^-2), displaying a relatively uniform gradient across the region. In contrast, the actual solar power distribution shows significant variability, ranging from (65.0 ,textWm^-2) to (132.8 ,textWm^-2).
Figure 5 illustrates the theoretical solar power distribution (Fig. 5a) compared with the actual solar power distribution (Fig. 5b) for the eastern region. The theoretical power values range from (123.7 ,textWm^-2) to (132.7 ,textWm^-2), with a uniform color band distribution across the region. Conversely, the actual solar power varies between (115.5 ,textWm^-2) and (132.7 ,textWm^-2). The highest power values (red bands) are concentrated at coordinates around 1.5° latitude and 34.8° longitude, while the lowest values (blue bands) are observed near 1.0° latitude and 33.8° longitude.
Figure 6 compares the theoretical (Fig. 6a) and actual solar power distributions (Fig. 6b) for the central region. The theoretical power ranges between (114.4 ,textWm^-2) and (131.6 ,textWm^-2,) with consistent bands of increasing intensity from west to east. In contrast, actual solar power ranges from (103.9 ,textWm^-2) to (119.6 ,textWm^-2) showing a concentration of higher power (red bands) at around 1.2° latitude and 33.0° longitude. Lower power values blue bands) are found near 0.4° latitude and 30.5° longitude.
Figure 7 illustrates the theoretical (Fig. 7a) and actual (Fig. 7b) solar power distributions for the western region. The theoretical solar power ranges from (115.7 ,textWm^-2) to (127.7 ,textWm^-2), with a steady gradient from blue to red bands across longitudes. In the actual distribution, power values range from (66.0 ,textWm^-2) to (127.2 ,textWm^-2.) Higher power zones (red bands) are observed near 2.0° latitude and 31.5° longitude, while significantly lower values (blue bands) dominate near 0.2° latitude and 30.0° longitude.
In the northern region (Fig. 8), theoretical solar power is (approx 130 ,textWm^-2), while the modeled power from the present work is slightly higher ((approx 122 ,textWm^-2)), reflecting improved calibration using localized data. Measured power also aligns closely ((approx 127 ,textWm^-2)), validating the model’s accuracy for arid and semi-arid conditions. In the Central Region, theoretical power is (approx 255 ,textWm^-2), with the modeled value slightly lower ((sim 225 ,textWm^-2)), likely due to urban effects. Measured power ((approx 228 ,textWm^-2)) closely matches the modeled results, indicating effective handling of urban influences and weather variability. In the Western Region, theoretical power is (approx 370 ,textWm^-2), while the modeled power is lower ((approx 340 ,textWm^-2)), accounting for topographical shading and cloud effects. Measured power ((approx 310 ,textWm^-2)) is slightly below the modeled value, suggesting further refinement may be required to address unique regional microclimates.
To further contextualize the findings of this study, Table 2 compares the novel approach of the present work to existing solar power generation models. This comparison highlights the contribution of the present work in enhancing solar power prediction accuracy, particularly in region-specific scenarios.
Discussions
The solar power distribution or navigation from the previous studies for the different regions is restricted only within certain confine or stretch in that given location dependent only on the longitude of the location thereby limiting the possibility of exploiting solar power locations in that region for establishing mega solar power plants for the generation of clean, reliable, affordable, sustainable and environmentally friendly energy to realize the SDGs. However, this paper adds significant value by considering the localized impact of wind flow on solar power generation, which is a more novel aspect of the proposed model. The effect of wind speed on solar power generation, particularly through the wake effect, is often overlooked in traditional solar power distribution studies.
In this study, we extended the classical model by factoring in wind flow velocity, which influences solar irradiance through changes in temperature and cloud cover. The novelty of the model lies in the consideration of local wind dynamics at different geographical points, which can significantly alter solar power efficiency. Wind flow can either enhance or disrupt solar power generation depending on the local topography and atmospheric conditions, and the results of this study show significant regional variations due to wind influences.
Correspondingly, the distribution of solar power generation in Uganda and the corresponding regions is displayed in Figs. 3, 4, 5, 6, and 7, respectively. Largely, where the power distribution is abundant, such locations should be spotted for installation of mega solar power plants to increase the generation capacity of the country. This information is important for planning and implementing solar energy projects, optimizing system designs, and assessing the feasibility of solar energy deployment in different geographical areas. Nonetheless, Fig. 3 depicts power distribution at non-regional level where most of the districts favoured by the non-regional siting for the theoretical power come from the eastern region. The comparison reveals a discrepancy between theoretical and actual solar power, highlighting the influence of local atmospheric conditions and environmental factors on solar radiation levels. However, the distribution for the actual power generated by the present models uncovers more locations hidden by the non-regional siting, for example between latitudes (− 0.75 to − 0.4° N) and longitude (33.4–35.1° E) with another additional stretch between latitude, 3.2 – 3.6° N and longitude, 34.5 – 35.1° E, demonstrating the ability of the present model to more accurately predict the actual usable solar power. Therefore, such findings should be applied in the deployment of solar resources in the sited location.
Moreover, Fig. 4 implies that most of the locations in the northern region have probabilities of localization equally likely as evidenced by the stretch of the red band across the localities in this region. Thus, this region provides almost an equal opportunity for all the districts for mapping out the hot spots for solar deployment. However, the disparity between theoretical and actual solar power highlights the effects of regional atmospheric conditions, such as cloud cover and air quality, on solar energy potential. While the theoretical model assumes uniform conditions, actual observations suggest considerable localized variations, with some areas underperforming due to environmental or geographical factors.
Similarly, Fig. 5 illustrates the distribution of solar power in the eastern region with the hotspots enclosed by the red bands, an indication that, Tororo district where Tororo power plant (0.665° N, 34.2° E) is located is within the most favoured locations in this region. Additionally, the variation between theoretical and actual solar power highlights the influence of local environmental factors such as cloud cover, aerosols, and topography. The blue bands around 1.0° latitude and 33.8° longitude indicate areas with reduced solar irradiance, possibly due to higher atmospheric attenuation or geographical features. Conversely, the red bands at approximately 1.5° latitude and 34.8° longitude suggest favorable conditions for capturing solar energy, possibly due to clearer skies and better insolation. Thus, solar power deployment should prioritize areas with red color bands, particularly around 1.5° latitude and 34.8° longitude, to optimize energy generation. Additionally, environmental assessments and on-site measurements should be conducted in areas with blue bands, such as near 1.0°.
In the same way, the thin spread of solar power is in the central region (Fig. 6). The disparity between theoretical and actual solar power distribution reflects regional atmospheric and environmental factors. The blue bands at approximately 0.4° latitude and 30.5° longitude suggest areas of significant attenuation, possibly due to denser cloud cover or high aerosol content. The red bands near 1.2° latitude and 33.0° longitude highlight optimal solar power potential, likely due to favorable weather conditions and geographical elevation. Solar energy development in the central region should focus on high-performance zones, such as those near 1.2° latitude and 33.0° longitude. Simultaneously, areas with low power output, such as 0.4° latitude and 30.5° longitude, may require mitigation strategies like advanced photovoltaic technologies or site-specific optimization techniques to enhance solar energy capture.
The western region experiences low solar power generation (maximum of (127.2 ,textWm^-2)) but evenly distributed in the region. The theoretical model indicates a relatively uniform solar power distribution; however, the actual power distribution reveals areas of attenuation. The low-power zones near 30.0° longitude coincide with potential shading effects or high atmospheric particulate matter. Conversely, the optimal power region near 31.5° longitude suggests favorable conditions, including reduced cloud cover and topographical advantages. Investment in solar energy systems should only prioritize the high-output areas in the western region, such as those near 2.0° latitude and 31.5° longitude. To address low-output zones (e.g., 0.2° latitude and 30.0° longitude), strategies such as site-specific solar panel alignment, atmospheric mitigation, or advanced photovoltaic technologies should be explored. Additionally, periodic monitoring of solar insolation patterns in this region is recommended for accurate forecasting and planning.
Therefore, in terms of solar power generation, the most favoured region are of the order; northern region ((132.8 ,textWm^-2)), eastern region ((132.7 ,textWm^-2)), western region ((127.2 ,textWm^-2)), and central region ((119.6 ,textWm^-2)). Thus, the present work proposes that solar facilities should be deployed at locations with higher solar power distribution and transmission of solar power to regions with sparse distribution.
Pertinently, the graphical validation presented in Fig. 8 shows that the level of agreement between the present solar power model and the measured power are nearly linear with zero gradient in comparison to the power from previous studies. This is portrayed by the straight line between the solar power model and the measured power. Additionally, Fig. 8 validates the solar power models developed in this study by comparing theoretical estimates from previous studies, modeled solar power (this work), and measured power values. The results reveal that while theoretical models overestimate solar potential, the present work aligns closely with measured values, particularly in the Northern and Central regions. This alignment highlights the importance of localized adjustments in modeling solar power potential, ensuring greater accuracy in feasibility studies and deployment strategies. In the Western region, minor deviations between modeled and measured values point to the need for further refinement to address microclimatic effects. These findings reinforce the utility of the proposed methodology for regional solar energy planning in Uganda. In regions like the western region of Uganda, where wind flow significantly alters solar irradiance patterns, the impact of local wind effects becomes especially important in understanding actual power generation.
Correspondingly, the statistical validation, RMSE of solar power model for all the regions in Uganda has relatively minimal deviations (northern, 0.9701; central, 0.8215 and the western, 6.4186) which is in strong agreement with other previous studies. The RMSE values provide a quantitative measure of the model’s accuracy.. All these authenticate the robustness and versatility of the solar power generation model. However, the exceptionality which occurred in the western region (0.5468° S, 30.1387° E) is attributed to the climatic conditions in these areas of the country where they experience a fairly intermittent solar energy due to cloud cover.
Thus, while the general rule of thumb of siting solar power plants in regions with abundant sunlight is valid, this study emphasizes that factoring in wind flow dynamics and regional wind velocities can lead to more optimal solar power deployment, especially in areas where wind patterns have the potential to either enhance or mitigate solar energy generation.
Conclusions
In the present work, a differential model for solar power generation has been developed to reflect the actual solar power harvestable in a given location dependent on the effect of the local wind flow on insolation and the maximum velocity of wind at non-regional, northern, eastern, central and western regions against the overstated theoretical power from previous studies. The findings indicate that while light-rich areas are generally favorable for solar installations, the addition of wind flow considerations significantly refines the selection of optimal sites for solar power generation. Explicitly, the present work experimentally determined the solar power generated using SPV generators connected in series in three different locations to compare with the theoretical power and the power from the present model to optimize the best option for deployment. A graphical validation of the solar power model against the theoretical power from previous studies and the measured or experimental power from the study location of the present work was performed to authenticate the validity of the model developed. In addition to the visual validation, the performance of the error analysis using the statistical indicator, RMSE reveal that the model performance for the location in the northern region, the central region and the western region has values of 0.9701, 0.8215 and 6.4186. Further, the study also revealed that in terms of solar power generation, the most favoured region are of the order; northern region ((132.8 ,textWm^-2)), eastern region ((132.7 ,textWm^-2)), western region ((127.2 ,textWm^-2)), and central region ((119.6 ,textWm^-2)). Thus, the present work proposes that solar facilities should be deployed at locations with higher solar power distribution and transmission of solar power to regions with sparse distribution. Besides, the study further proposes for an integrated approach that considers both solar irradiance and wind flow effects to optimize power generation. This dual-focus strategy has the potential to identify previously overlooked areas, particularly in regions where wind plays a significant role in enhancing solar energy efficiency. Additionally, the present work focuses on the development of a solar power generation model, validated through onsite experiments and simulations. While the results highlight the potential for solar power in all the regions of Uganda, we acknowledge the need for further studies for comprehensive solar potential assessments.
Data availability
All the data used is within the manuscript.
References
-
Louwen, A. & van Sark, W. Chapter 5 – Photovoltaic solar energy. In Technological Learning in the Transition to a Low-Carbon Energy System (eds Junginger, M. & Louwen, A.) 65–86 (Academic Press, 2020).
-
Zahedi, A. Maximizing solar PV energy penetration using energy storage technology. Renew. Sustain. Energy Rev. 15, 866–870. https://doi.org/10.1016/j.rser.2010.09.011 (2011).
-
Qasaimeh, A., Qasaimeh, M., Abu-Salem, Z., Momani, M. Solar Energy Sustainability in Jordan. In CWEEE. 03, 41–47. https://doi.org/10.4236/cweee.2014.32006 (2014).
-
Fashina, A. et al. The drivers and barriers of renewable energy applications and development in Uganda: A review. Clean Technol. 1, 9–39. https://doi.org/10.3390/cleantechnol1010003 (2019).
-
Ruban, A. V. Evolution under the sun: optimizing light harvesting in photosynthesis. J. Exp. Bot. 66, 7–23. https://doi.org/10.1093/jxb/eru400 (2015).
-
Planning and Installing Photovoltaic Systems: A Guide for Installers, Architects and Engineers, https://www.routledge.com/Planning-and-Installing-Photovoltaic-Systems-A-Guide-for-Installers-Architects-and-Engineers/DeutscheGesellschaftfurSonnenenergieDGS/p/book/9781849713436.
-
Guarracino, I. et al. Systematic testing of hybrid PV-thermal (PVT) solar collectors in steady-state and dynamic outdoor conditions. Appl. Energy. 240, 1014–1030. https://doi.org/10.1016/j.apenergy.2018.12.049 (2019).
-
Singh, G. K. Solar power generation by PV (photovoltaic) technology: A review. Energy. 53, 1–13. https://doi.org/10.1016/j.energy.2013.02.057 (2013).
-
Otanicar, T. P., Chowdhury, I., Prasher, R. & Phelan, P. Band-gap tuned direct absorption for a hybrid concentrating solar photovoltaic/thermal system. J. Solar Energy Eng. Trans. ASME. https://doi.org/10.1115/1.4004708 (2011).
-
Nnamchi, S. N., Mundu, M. M., Ukagwu, K. J. & Oyagbola, I. A. Development and adaptation of relative sunshine hours models for the equatorial latitudes: a case study. Model. Earth Syst. Environ. 8, 1191–1201. https://doi.org/10.1007/s40808-021-01147-y (2022).
-
Hosenuzzaman, M. et al. Global prospects, progress, policies, and environmental impact of solar photovoltaic power generation. Renew. Sustain. Energy Rev. 41, 284–297. https://doi.org/10.1016/j.rser.2014.08.046 (2015).
-
(PDF) Power Electronics Handbook” by, https://www.researchgate.net/publication/375598117_Power_Electronics_Handbook_by
-
Nnamchi, S. N., Mundu, M. M., Busingye, J. D. & Ezenwankwo, J. U. Extrinsic modeling and simulation of helio-photovoltaic system: a case of single diode model. Int. J. Green Energy. 16, 450–467. https://doi.org/10.1080/15435075.2019.1578659 (2019).
-
Solar Photovoltaic Technology and Systems: A Manual For Technicians, Trainers and Engineers | PDF | Rechargeable Battery | Solar Power, https://www.scribd.com/document/420807061/Sample-7549
-
Sauer, D. U. Electrochemical storage for photovoltaics. In Handbook of Photovoltaic Science and Engineering 896–953 (Wiley, 2010).
-
Kumar, M. Technical issues and performance analysis for grid connected PV system and present solar power scenario. In 2020 International Conference on Electrical and Electronics Engineering (ICE3), 639–645. https://doi.org/10.1109/ICE348803.2020.9122812 (2020).
-
World’s second-largest solar plant goes online in China, https://www.pv-magazine.com/2024/11/12/worlds-second-largest-solar-plant-goes-online-in-china/
-
Reports – ERA – Electricity Regulatory Authority, https://www.era.go.ug/index.php/resource-centre/publications/reports
-
Ssemwogerere, E.: Uganda’s Grid-Connected Solar Portfolio Increases, https://www.era.go.ug/index.php/media-centre/what-s-new/276-uganda-s-grid-connected-solar-portfolio-increases
-
Nnamchi, S. N. & Mundu, M. M. Development of solar isodose lines: Mercatorian and spatial guides for mapping solar installation areas. Heliyon. https://doi.org/10.1016/j.heliyon.2022.e11045 (2022).
-
Katongole, D. N. et al. Spatial and temporal solar potential variation analysis in Uganda using measured data. Tanzania J. Sci. 49, 1–14. https://doi.org/10.4314/tjs.v49i1.1 (2023).
-
Mundu, M. M., Nnamchi, S. N. & Ukagwu, K. J. Algorithmized modelling, simulation and validation of clearness index in four regions of Uganda. J. Solar Energy Res. 5, 432–452. https://doi.org/10.22059/jser.2020.300924.1150 (2020).
-
Aarakit, S. M., Ssennono, V. F. & Adaramola, M. S. Estimating market potential for solar photovoltaic systems in Uganda. Front. Energy Res. https://doi.org/10.3389/fenrg.2021.602468 (2021).
-
Nnamchi, S.N., Onochie, U. Development of solar isodose lines: Mercatorian and spatial guides for preliminary design and installation of solar facilities. https://papers.ssrn.com/abstract=4059400 (2022).
-
Mehmood, U. et al. Effect of temperature on the photovoltaic performance and stability of solid-state dye-sensitized solar cells: A review. Renew. Sustain. Energy Rev. 79, 946–959 (2017).
-
Rahman, M. M., Hasanuzzaman, M. & Rahim, N. A. Effects of various parameters on PV-module power and efficiency. Energy Convers. Manag. 103, 348–358. https://doi.org/10.1016/j.enconman.2015.06.067 (2015).
-
F.a, T., M.a, A.-H., H.j, B. Study of the effects of dust, relative humidity, and temperature on solar PV performance in Doha: Comparison between monocrystalline and amorphous PVS. (2013).
-
Agbor, M. E. et al. Potential impacts of climate change on global solar radiation and PV output using the CMIP6 model in West Africa. Clean. Eng. Technol. 13, 100630. https://doi.org/10.1016/j.clet.2023.100630 (2023).
-
Maturi, L., Belluardo, G., Moser, D. & Del Buono, M. BiPV system performance and efficiency drops: overview on PV module temperature conditions of different module types. Energy Procedia. 48, 1311–1319. https://doi.org/10.1016/j.egypro.2014.02.148 (2014).
-
Ciulla, G., Lo Brano, V. & Moreci, E. Forecasting the cell temperature of PV modules with an adaptive system. Int. J. Photoenergy. 2013, 192854. https://doi.org/10.1155/2013/192854 (2013).
-
Ya’acob, M. E., Hizam, H., Radzi, M. A. M. & Kadir, M. Z. A. A. Field measurement of PV array temperature for tracking and concentrating 1 k W p generators installed in Malaysia. Int. J. Photoenergy. 2013, 1–8. https://doi.org/10.1155/2013/502503 (2013).
-
Al Mahdi, H., Leahy, P. G., Alghoul, M. & Morrison, A. P. A review of photovoltaic module failure and degradation mechanisms: Causes and detection techniques. Solar. 4, 43–82. https://doi.org/10.3390/solar4010003 (2024).
-
Skoplaki, E. & Palyvos, J. A. Operating temperature of photovoltaic modules: A survey of pertinent correlations. Renew. Energy. 34, 23–29 (2009).
-
Chala, G. T. & Al Alshaikh, S. M. Solar photovoltaic energy as a promising enhanced share of clean energy sources in the future—A comprehensive review. Energies. 16, 7919. https://doi.org/10.3390/en16247919 (2023).
-
Elgani, R. A., Hilo, M. H. M., Allah, M. D. A., Hassan, A. A. & Elhai, R. A. Impact of the light intensity variation on the performance of solar cell constructed from (Muscovite/TiO2/Dye/Al). Nat. Sci. 5, 1069–1077. https://doi.org/10.4236/ns.2013.510131 (2013).
-
Babatunde, A. A., Abbasoglu, S. & Senol, M. Analysis of the impact of dust, tilt angle and orientation on performance of PV Plants. Renew. Sustain. Energy Rev. 90, 1017–1026. https://doi.org/10.1016/j.rser.2018.03.102 (2018).
-
Soga, K. & Akasaka, H. Influences of solar incident angle on power generation efficiency of PV modules under field conditions. J. Asian Archit. Build. Eng. 2, 43–48. https://doi.org/10.3130/jaabe.2.b43 (2003).
-
Cotfas, D. T. & Cotfas, P. A. A simple method to increase the amount of energy produced by the photovoltaic panels. Int. J. Photoenergy. 2014, 901581. https://doi.org/10.1155/2014/901581 (2014).
-
Kaplani, E. Detection of degradation effects in field-aged c-Si solar cells through IR thermography and digital image processing. Int. J. Photoenergy. 2012, 396792. https://doi.org/10.1155/2012/396792 (2012).
-
Chu, Y. Review and Comparison of Different Solar Energy Technologies.
-
Paul, D. I. A comparison analysis of the experimental and theoretical power output of a hybrid photovoltaic cell. J. Renew. Energy. 2019, 3684284. https://doi.org/10.1155/2019/3684284 (2019).
-
Ghasemi, G., Noorollahi, Y., Alavi, H., Marzband, M. & Shahbazi, M. Theoretical and technical potential evaluation of solar power generation in Iran. Renew. Energy. 138, 1250–1261 (2019).
-
Yamegueu, D., Azoumah, Y., Py, X. & Zongo, N. Experimental study of electricity generation by solar PV/diesel hybrid systems without battery storage for off-grid areas. Renew. Energy. 36, 1780–1787. https://doi.org/10.1016/j.renene.2010.11.011 (2011).
-
Wu, Y.-K., Chen, C.-R. & Abdul Rahman, H. A novel hybrid model for short-term forecasting in PV power generation. Int. J. Photoenergy. 2014, 1–9. https://doi.org/10.1155/2014/569249 (2014).
-
Wan, C. et al. Photovoltaic and solar power forecasting for smart grid energy management. CSEE J. Power Energy Syst. 1, 38–46. https://doi.org/10.17775/CSEEJPES.2015.00046 (2015).
-
El Mnassri, M. & Leger, A. S. Stand alone photovoltaic solar power generation system: A case study for a remote location in Tunisia. In IEEE PES General Meeting, 1–4. https://doi.org/10.1109/PES.2010.5590206 (2010).
-
Chen, C. S., Hsu, C. T. & Korimara, R. The photovoltaic generation system impact on the energy demand of a small Island and its financial analysis. Energy Procedia. 14, 411–417. https://doi.org/10.1016/j.egypro.2011.12.951 (2012).
-
the Faculty of Energy Engineering, Mekhail, T., Rekaby, A., Fathy, M., the Faculty of Energy Engineering, Bassily, M., the Department of Mechanical Power Engineering, Faculty of Engineering, Minia University, Harte, R., the Faculty of Architecture and Civil Engineering, University of Wuppertal: Experimental and Theoretical Performance of Mini Solar Chimney Power Plant. JOCET. 5, 294–298 (2017). https://doi.org/10.18178/JOCET.2017.5.4.386
-
Asnaghi, A. & Ladjevardi, S. M. Solar chimney power plant performance in Iran. Renew. Sustain. Energy Rev. 16, 3383–3390. https://doi.org/10.1016/j.rser.2012.02.017 (2012).
-
Muhamad, M. M., Kibirige, D., Uzorka, A. & John, U. K. Design and simulation of an inverter drive system with a display for a renewable energy system in the rural isolated communities of Uganda. J. Power Energy Eng. 10, 1–14. https://doi.org/10.4236/jpee.2022.1012001 (2022).
-
Eswaramoorthy, M., Shanmugam, S. & Veerappan, Ar. Experimental study on solar parabolic dish thermoelectric generator. IJEE. 3, 62–66. https://doi.org/10.5963/IJEE0303001 (2013).
-
Natsheh, E. M. & Albarbar, A. Solar power plant performance evaluation: simulation and experimental validation. J. Phys.: Conf. Ser. 364, 012122. https://doi.org/10.1088/1742-6596/364/1/012122 (2012).
-
Yadav, A. K. & Chandel, S. S. Solar energy potential assessment of western Himalayan Indian state of Himachal Pradesh using J48 algorithm of WEKA in ANN based prediction model. Renew. Energy. 75, 675–693. https://doi.org/10.1016/j.renene.2014.10.046 (2015).
-
Khan, J. & Arsalan, M. H. Solar power technologies for sustainable electricity generation: A review. Renew. Sustain. Energy Rev. 55, 414–425. https://doi.org/10.1016/j.rser.2015.10.135 (2016).
-
Shyam, S. & Tiwari, G. N. Analysis of series connected photovoltaic thermal air collectors partially covered by semitransparent photovoltaic module. Solar Energy. 137, 452–462. https://doi.org/10.1016/j.solener.2016.08.052 (2016).
-
Alsema, E. A. & de Wild, M. J. Environmental impacts of crystalline silicon photovoltaic module production. MRS Online Proc. Library. 895, 305. https://doi.org/10.1557/PROC-0895-G03-05 (2006).
-
Li, Y., Cai, W. & Wang, C. Economic impacts of wind and solar photovoltaic power development in China. Energy Procedia. 105, 3440–3448. https://doi.org/10.1016/j.egypro.2017.03.787 (2017).
-
Bazilian, M. et al. Re-considering the economics of photovoltaic power. Renew. Energy. 53, 329–338. https://doi.org/10.1016/j.renene.2012.11.029 (2013).
-
Toledo, O.M., Oliveira Filho, D., Diniz, A.S.A.C.: Distributed photovoltaic generation and energy storage systems: A review. Renewable and Sustainable Energy Reviews. 14, 506–511 (2010). https://doi.org/10.1016/j.rser.2009.08.007
-
Creutzig, F. et al. The underestimated potential of solar energy to mitigate climate change. Nat. Energy. 2, 1–9. https://doi.org/10.1038/nenergy.2017.140 (2017).
-
Green, M. A. et al. Solar cell efficiency tables (version 51). Progress in Photovoltaics: Research and Applications. 26, 3–12. https://doi.org/10.1002/pip.2978 (2018).
-
Living, O., Nnamchi, S. N., Mundu, M. M., Ukagwu, K. J. & Abdulkarim, A. Coupled modelling and simulation of power transmission lines: A systematic analysis of line losses. Electric Power Syst. Res. 226, 109954. https://doi.org/10.1016/j.epsr.2023.109954 (2024).
-
Mundu, M. M. et al. Numerical modelling of wind flow for solar power generation in a case study of the tropical zones. Model. Earth Syst. Environ. 8, 4123–4134. https://doi.org/10.1007/s40808-021-01343-w (2022).
Acknowledgements
The authors wish to appreciate the School of Engineering and Applies Sciences, Kampala International University for the technical aids received in the course of this research. The authors also recognize the three sources of data; NASA POWER, Uganda National Meteorological Authority (UNMA) and the Department of Physics, Makerere University, for making available the data used in the formulation and validation of the models in Uganda.
Author information
Authors and Affiliations
Contributions
Conceptualization and Supervision MMM, SJI: Data curation and Analysis: NSN, DEU, GBM: Writing of manuscript original draft: SJI, and DEU, NSN and MMM, read the manuscript, and edited it for intellectual content: All authors approved the final manuscript for submission and publication.
Corresponding authors
Ethics declarations
Competing interests
The authors declare no competing interests.
Additional information
Publisher’s note
Springer Nature remains neutral with regard to jurisdictional claims in published maps and institutional affiliations.
Rights and permissions
Open Access This article is licensed under a Creative Commons Attribution-NonCommercial-NoDerivatives 4.0 International License, which permits any non-commercial use, sharing, distribution and reproduction in any medium or format, as long as you give appropriate credit to the original author(s) and the source, provide a link to the Creative Commons licence, and indicate if you modified the licensed material. You do not have permission under this licence to share adapted material derived from this article or parts of it. The images or other third party material in this article are included in the article’s Creative Commons licence, unless indicated otherwise in a credit line to the material. If material is not included in the article’s Creative Commons licence and your intended use is not permitted by statutory regulation or exceeds the permitted use, you will need to obtain permission directly from the copyright holder. To view a copy of this licence, visit http://creativecommons.org/licenses/by-nc-nd/4.0/.
About this article
Cite this article
Mundu, M.M., Sempewo, J.I., Nnamchi, S.N. et al. Integration of wind flow effects in theoretical and experimental models for solar power generation.
Sci Rep 15, 8939 (2025). https://doi.org/10.1038/s41598-025-90680-2
-
Received: 25 July 2024
-
Accepted: 14 February 2025
-
Published: 15 March 2025
-
DOI: https://doi.org/10.1038/s41598-025-90680-2
Keywords
Search
RECENT PRESS RELEASES
Related Post


