Top 3 Price Prediction Bitcoin, Ethereum, Ripple: BTC and ETH show weakness while XRP stab
April 10, 2025
- Bitcoin hovers around $80,000 on Friday after facing rejection from its descending trendline the previous day.
- Ethereum price stabilizes at around $1,500 on Friday after falling almost 3% so far this week.
- XRP holding support around its 200-day EMA at $1.94 could lead to a recovery.
Bitcoin (BTC) and Ethereum (ETH) prices are hovering around $80,000 and $1,500 on Friday after facing rejection from their respective key levels, indicating signs of weakness. Meanwhile, Ripple (XRP) broke and found support around its critical level; maintenance suggests a recovery on the cards.
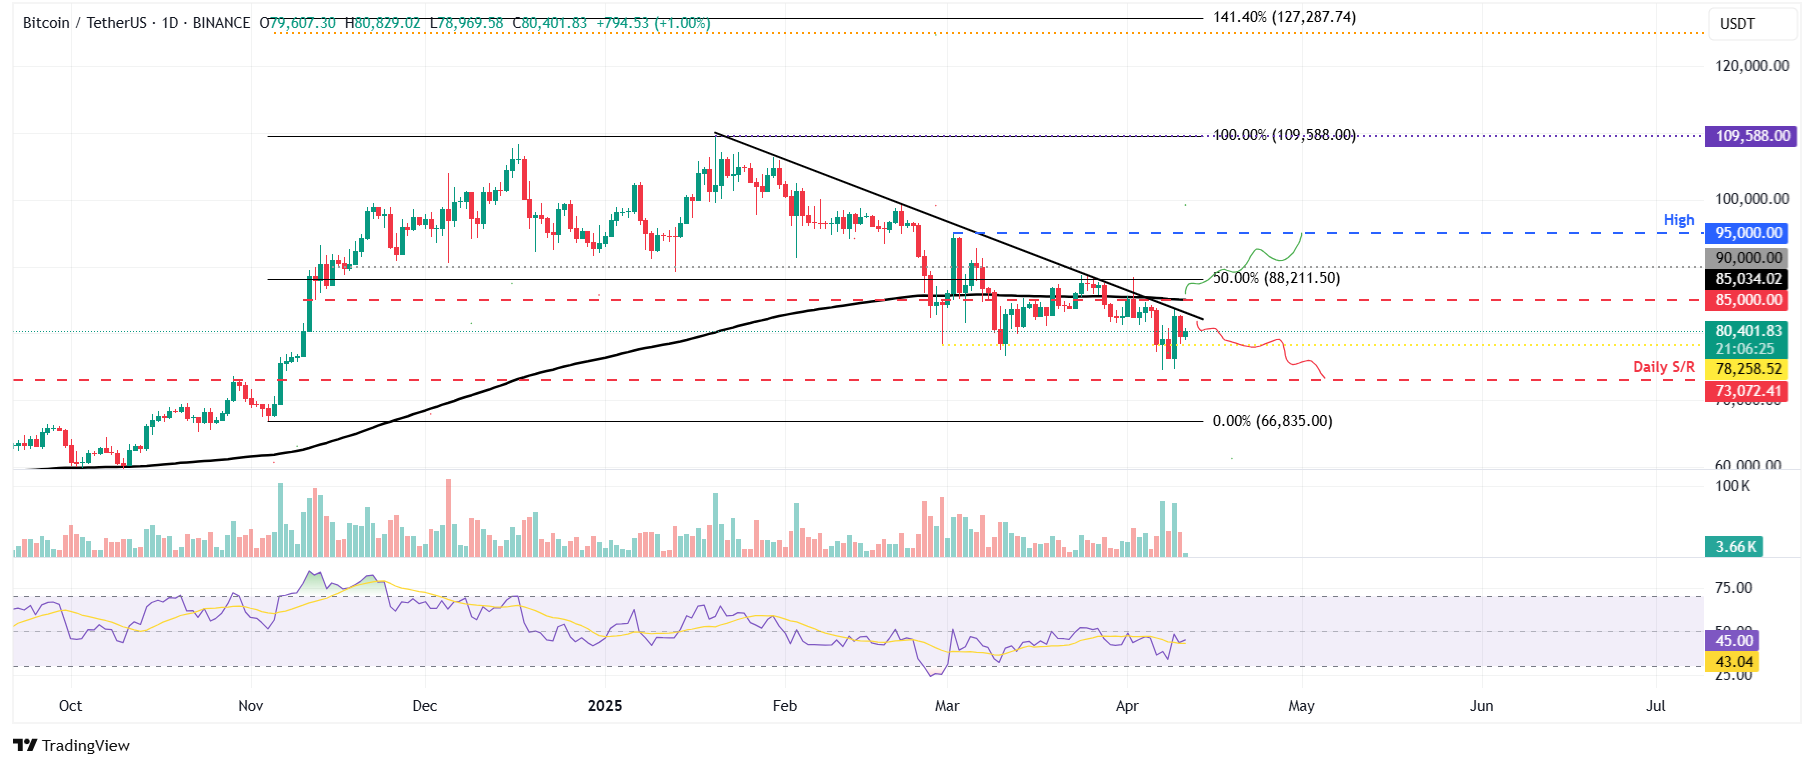
Bitcoin price was rejected from its daily resistance of $85,000 on April 2 and declined 10.55% until Tuesday. It also reached a new year-to-date low of $74,508 on Monday. However, BTC recovered 8% and closed above $82,600 on Wednesday. The next day, BTC declined 3.64% after facing rejection from its descending trendline (drawn by connecting multiple high levels since mid-January). At the time of writing on Friday, it hovers at around $80,000.
Bitcoin’s current price action looks indecisive, and two possibilities can be played out.
In a ‘dead cat bounce’ scenario, the market could experience a temporary, short-lived recovery towards the $85,000 resistance level before continuing its downward trend.
The daily chart’s Relative Strength Index (RSI) indicator supports a ‘dead cat’ situation after a sharp recovery on Wednesday. Currently, the RSI reads 45, pointing downward after being rejected from its neutral level of 50, indicating a rise in bearish momentum. If the RSI falls sharply, BTC could see a correction ahead.
If BTC continues its downward trend, it could extend the decline to retest its next daily support level at $73,072.
BTC/USDT daily chart
However, another possibility is that BTC continues its recovery following Wednesday’s sharp positive move and breaks and closes above the descending trendline, which coincides with the daily resistance level and the 200-day Exponential Moving Average (EMA) at $85,000.
In this case, BTC could extend the recovery to retest the key psychological level of $90,000 and the March 2 high of $95,000.
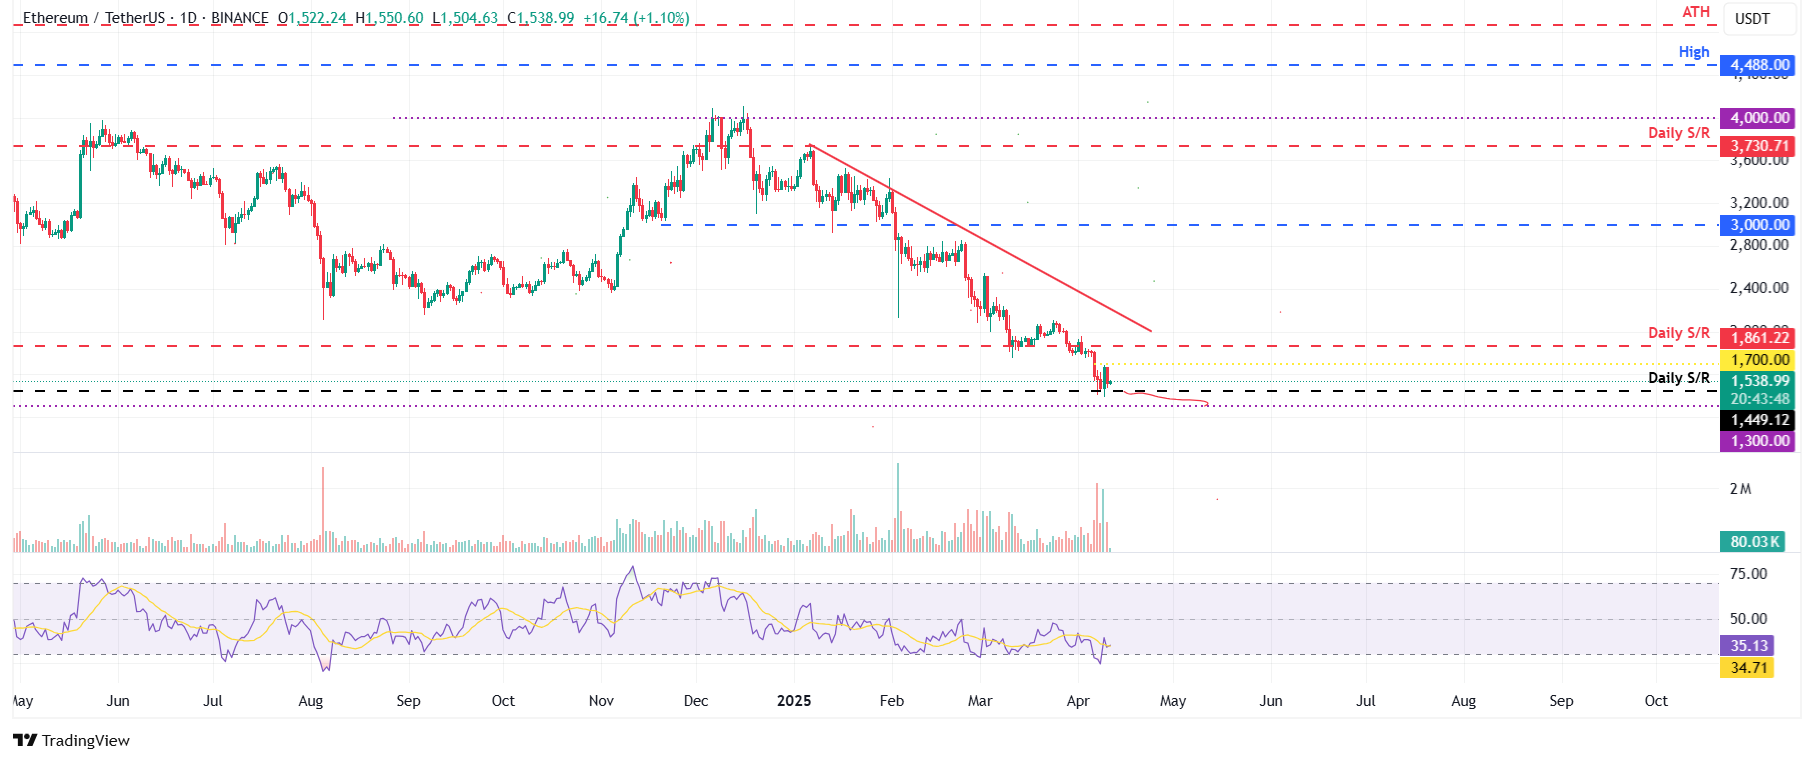
Ethereum price declined nearly 13% last week after failing to close above the daily level of $1,861. As of this week, it continues its downward momentum and declined nearly 7% until Tuesday. However, it recovered by 13.13% after finding support around the $1,449 level on Wednesday, but the recovery was short-lived as ETH declined 8.82% the next day. At the time of writing on Friday, ETH hovers at around $1,500.
If ETH closes below its daily support level of $1,449, it could extend the decline to retest its important psychological level of $1,300.
The RSI reads 35, below its neutral level of 50, indicating bearish momentum.
ETH/USDT daily chart
Conversely, if ETH recovers, it could extend the recovery to retest its important psychological level of $1,700.
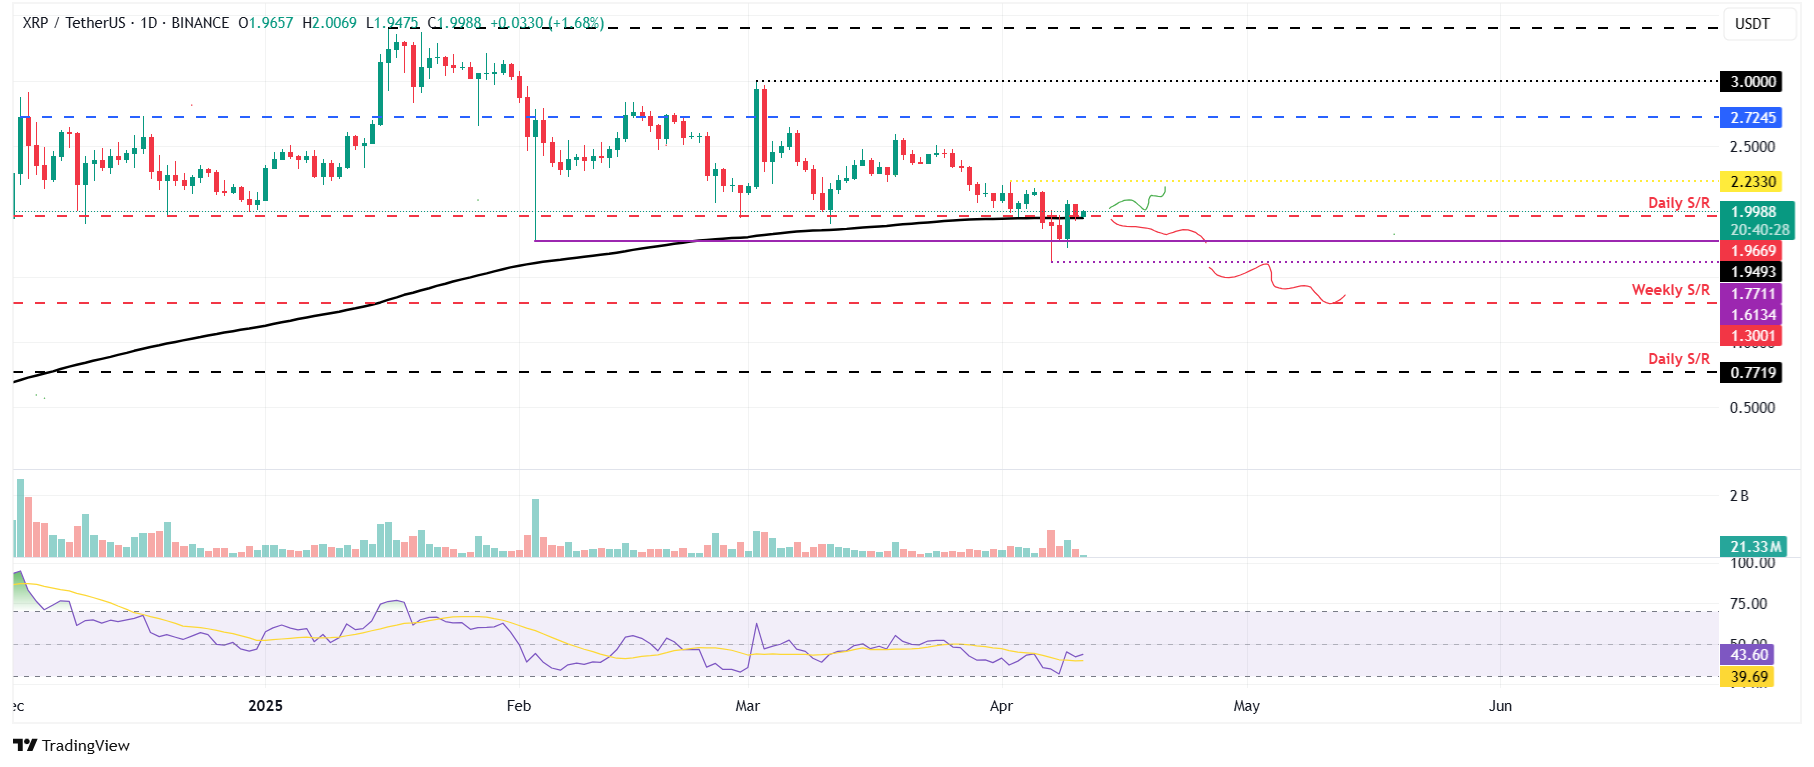
XRP price recovered by 14.28%, breaking above its 200-day EMA at $1.94 on Wednesday. It declined by 4.24% the next day, and the 200-day EMA level was tested. At the time of writing on Friday, it trades slightly above its 200-day EMA level.
If the 200-day EMA holds as support, XRP could extend the rally to retest its April 2 high of $2.23.
The RSI on the daily chart reads 43 after bouncing off its oversold level of 30 on Tuesday. It points upward toward its neutral level of 50, indicating fading bearish momentum. The RSI must move above its neutral level of 50 for the bullish momentum to be sustained.
XRP/USDT daily chart
On the other hand, if XRP closes below its 200-day EMA, it could extend the decline to retest its next support level at $1.77.
Bitcoin is the largest cryptocurrency by market capitalization, a virtual currency designed to serve as money. This form of payment cannot be controlled by any one person, group, or entity, which eliminates the need for third-party participation during financial transactions.
Altcoins are any cryptocurrency apart from Bitcoin, but some also regard Ethereum as a non-altcoin because it is from these two cryptocurrencies that forking happens. If this is true, then Litecoin is the first altcoin, forked from the Bitcoin protocol and, therefore, an “improved” version of it.
Stablecoins are cryptocurrencies designed to have a stable price, with their value backed by a reserve of the asset it represents. To achieve this, the value of any one stablecoin is pegged to a commodity or financial instrument, such as the US Dollar (USD), with its supply regulated by an algorithm or demand. The main goal of stablecoins is to provide an on/off-ramp for investors willing to trade and invest in cryptocurrencies. Stablecoins also allow investors to store value since cryptocurrencies, in general, are subject to volatility.
Bitcoin dominance is the ratio of Bitcoin’s market capitalization to the total market capitalization of all cryptocurrencies combined. It provides a clear picture of Bitcoin’s interest among investors. A high BTC dominance typically happens before and during a bull run, in which investors resort to investing in relatively stable and high market capitalization cryptocurrency like Bitcoin. A drop in BTC dominance usually means that investors are moving their capital and/or profits to altcoins in a quest for higher returns, which usually triggers an explosion of altcoin rallies.
Disclaimer: For information purposes only. Past performance is not indicative of future results.
Search
RECENT PRESS RELEASES
Related Post


