US-UK and China trade deals fail to push Bitcoin to all-time high, what will it take?
May 12, 2025
- Bitcoin hovers under $104,000 on Monday; traders await a re-test of the all-time high of $109,588.
- The US-UK and China trade deals are the two key developments that could settle tariff uncertainties surrounding the Trump administration.
- Bitcoin’s consolidation ended on April 9, and the largest cryptocurrency is less than 6% away from its all-time high.
The United States unveiled its first major trade deal with the UK last week. The announcement was followed by talks of a highly anticipated deal with China. Both developments failed to catalyze a re-test of the all-time high in Bitcoin. Crypto market capitalization erased 2% of its value in the last 24 hours, down to $3.45 trillion.
Bitcoin’s return above the $100,000 milestone was a key development for traders last week. Among other catalysts, the largest cryptocurrency awaits a push to re-test its previous all-time high and break past the $109,588 level.
On-chain metrics show consistent profit-taking in Bitcoin, traders continue to realize their gains in the largest cryptocurrency. Data from crypto intelligence tracker Santiment shows that Bitcoin traders keep realizing gains on their BTC holdings.
Whale transactions in both categories, greater than $100,000 and $1 million, slowed down since May 9. The count of daily active addresses in Bitcoin took a hit, alongside other on-chain developments.
On-chain metrics present a neutral to bullish outlook for Bitcoin in the short term.
%20%5B10-1747027174434.33.45,%2012%20May,%202025%5D.png)
Bitcoin on-chain analysis | Source: Santiment
Tariff uncertainty in the Trump administration could eventually settle as the United States announces subsequent deals with its key trade partners. While the US-UK deal faces criticism according to a BBC report, the deal with China brings certainty and is likely to support bullish sentiment among market participants.
The crypto market has rebounded sharply from early April lows, Bitcoin ended its consolidation phase and started a rally, breaking past the $100,000 milestone. Technical indicators support further gains in Bitcoin.
The Relative Strength Index (RSI) and Moving Average Convergence Divergence (MACD) indicator on the daily timeframe support a bullish thesis for Bitcoin. RSI reads 73 and MACD flashes green histogram bars above the neutral line.
Bitcoin price is less than 6% away from its previous all-time high, the nearest support is the $100,000 milestone and the lower boundary of a Fair Value Gap (FVG) between $97,732 and $102,315.
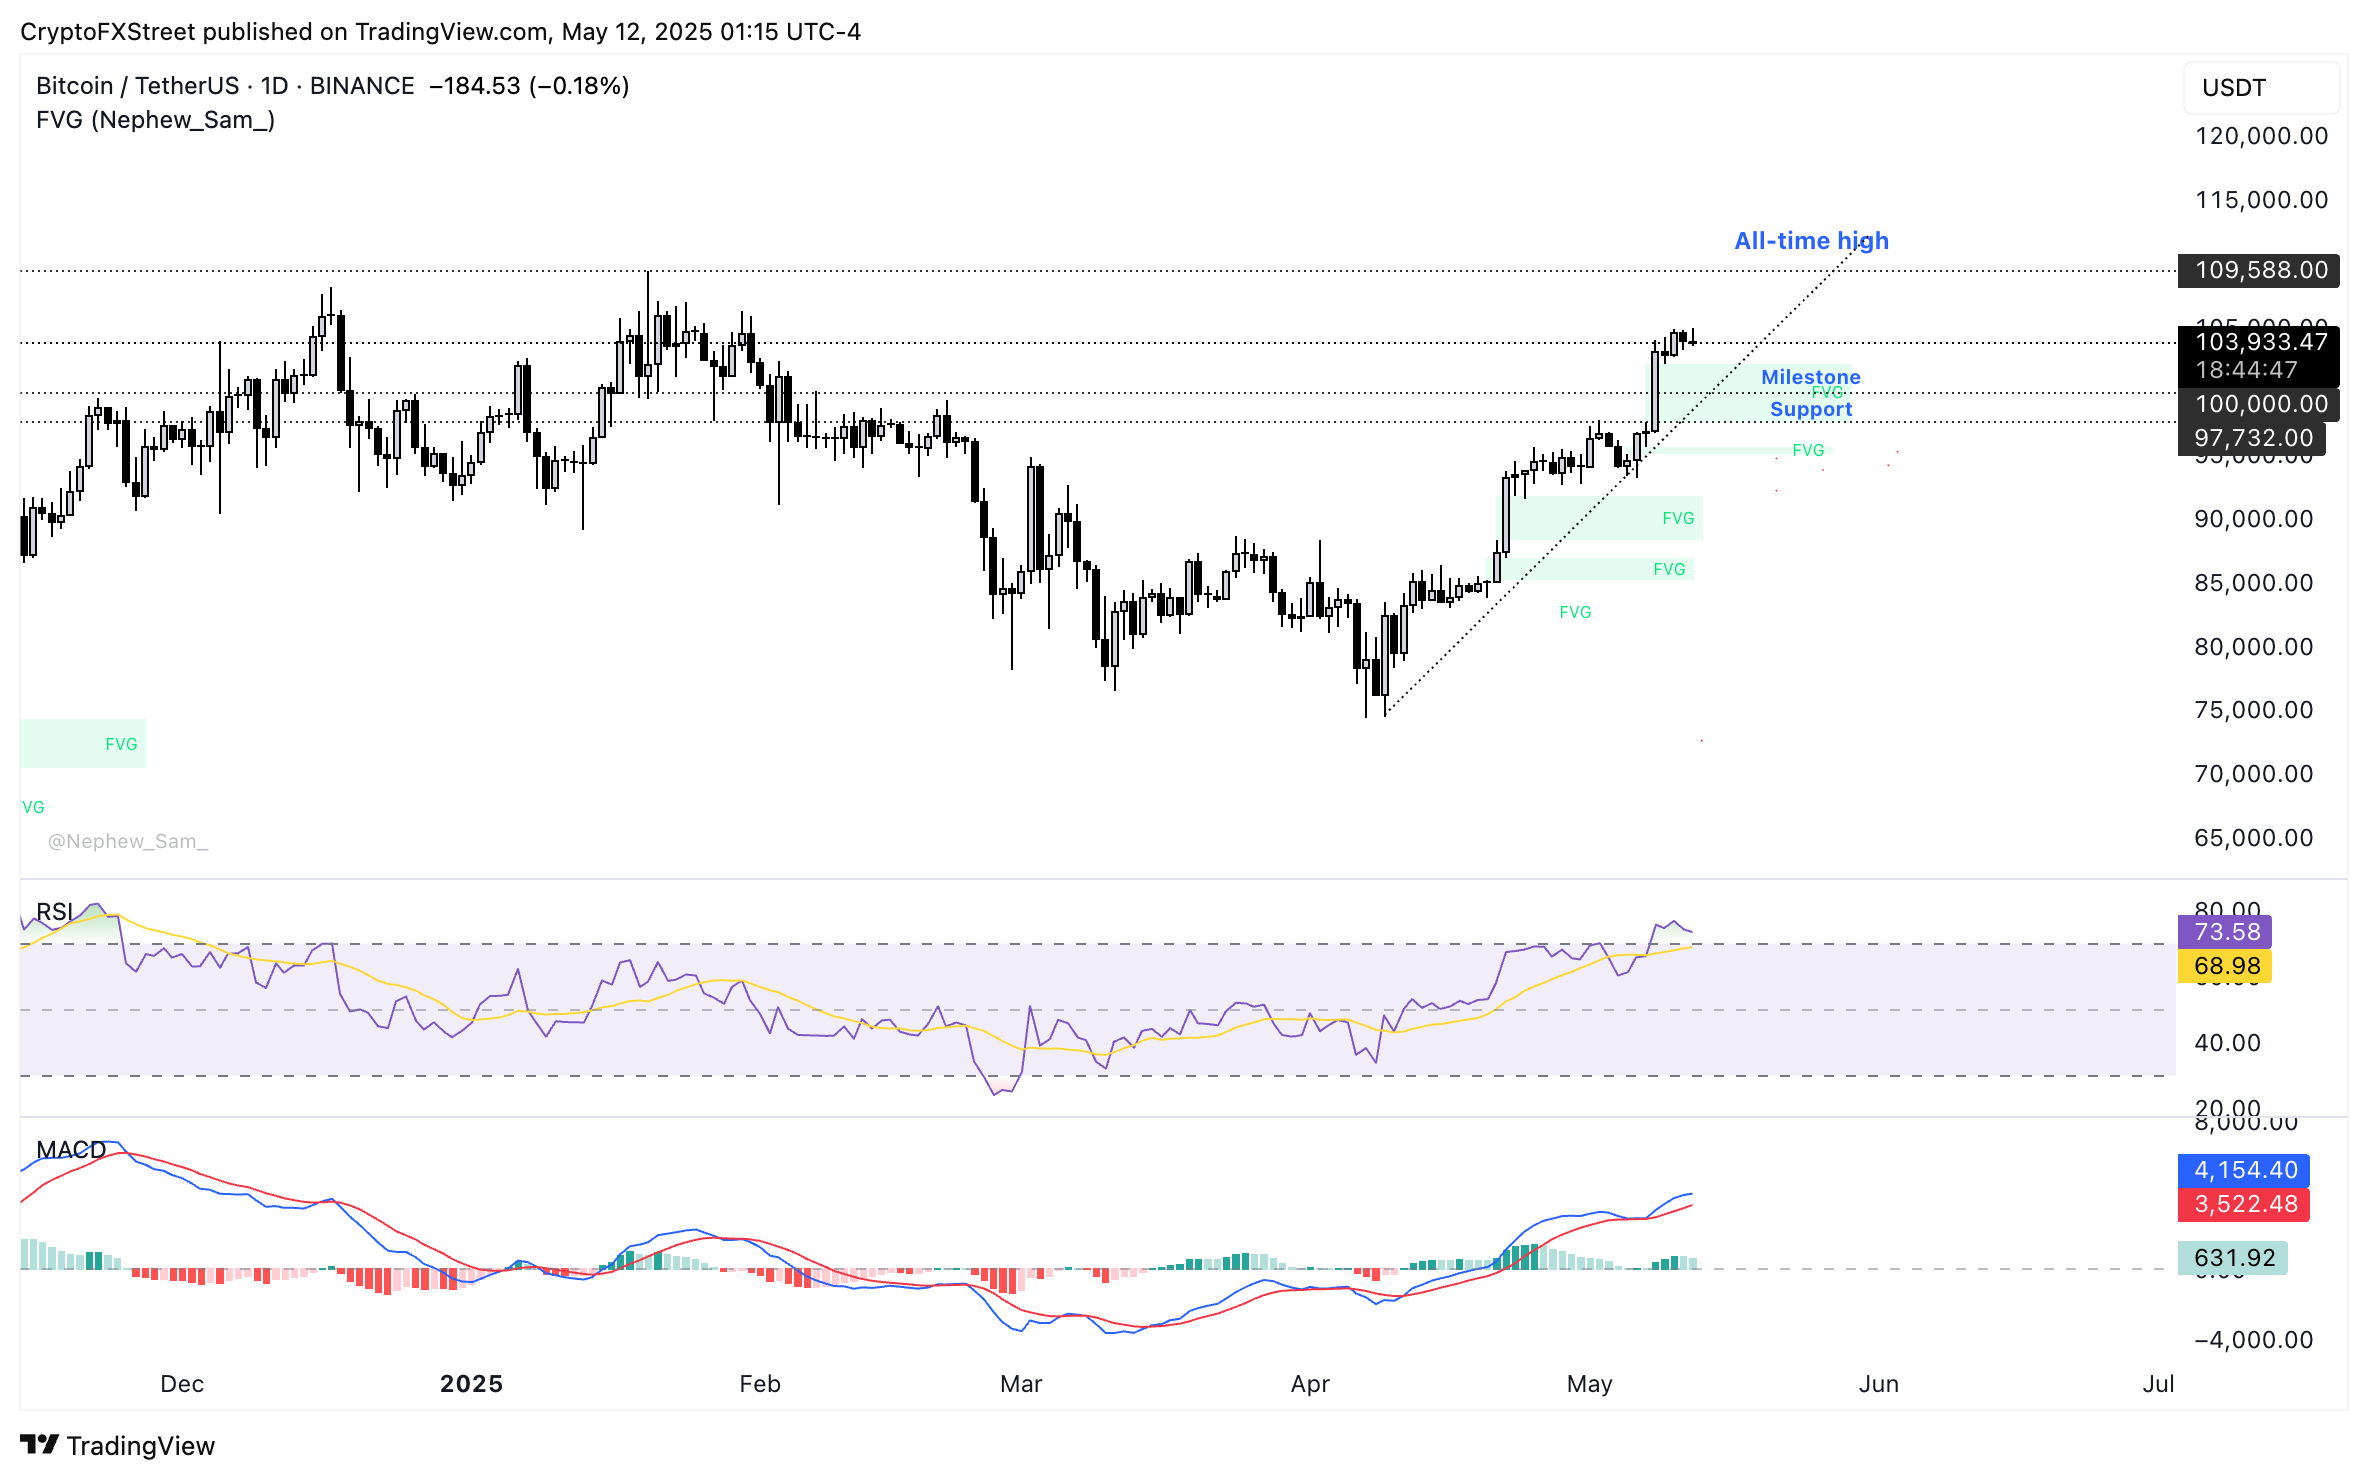
BTC/USDT daily price chart
At the time of writing, Bitcoin hovers around $104,000.
Share:
Cryptos feed
Search
RECENT PRESS RELEASES
Related Post


