Breaking: Bitcoin hits new all-time high, with BTC/USD crossing above $109,400
May 21, 2025
- Bitcoin hit a new all-time high above $109,800 on Wednesday, breaking its previous record of $109,588 from January 20.
- The new milestone marks the second time BTC has established a new all-time high in 2025.
- Bitcoin has risen more than 47% since establishing a low below $75,000 on April 7.
Bitcoin (BTC) registered a new all-time high above $109,800 on Wednesday, breaking past its previous record of $109,588, according to data from crypto exchange Binance.
BTC’s march to the new milestone above $109,800 marks a 47% rise from a low just below $75,000 on April 7. This is also the second time BTC reached a new all-time high in 2025.
The top cryptocurrency faced intense bearish pressure between January and early April after US President Donald Trump began talks of slapping tariffs on several international trading partners. Just after establishing a high of $109,588 on January 20, Bitcoin crashed more than 30% to under $75,000 before picking up pace in mid-April, following the US reaching trading agreements with several nations.
The rise was also partly fueled by intense buying pressure from US spot Bitcoin ETF investors who have triggered net inflows of $7.4 billion in the past five weeks. The products recorded net inflows of $329.02 million on Tuesday. In addition, financial intelligence firm Strategy has also been expanding its Bitcoin playbook, stretching its BTC treasury holdings to 576,230 BTC last week — 2.74% of the total Bitcoin supply.
The entire crypto market is showing bullish signs following BTC’s new high, with the positive sentiment also lifting top altcoins Ethereum, XRP and Solana.
Bitcoin broke above $106,000 on Monday before finding support near $105,200. At the time of writing on Wednesday, it rallied and broke above its all-time high of $109,588 set on January 20.
If BTC continues its upward trend into uncharted territory, it could extend the rally toward its next major psychological milestone at $120,000.
The Relative Strength Index (RSI) and Stochastic Oscillator are in their overbought regions, indicating strong bullish momentum. However, traders should be cautious as the chances of a pullback are high due to its overbought condition.
The 50-day Simple Moving Average (SMA) is on the verge of crossing above its 200-day SMA, signaling a potential golden cross on the daily chart. If the crossover occurs, it would confirm another buy signal.
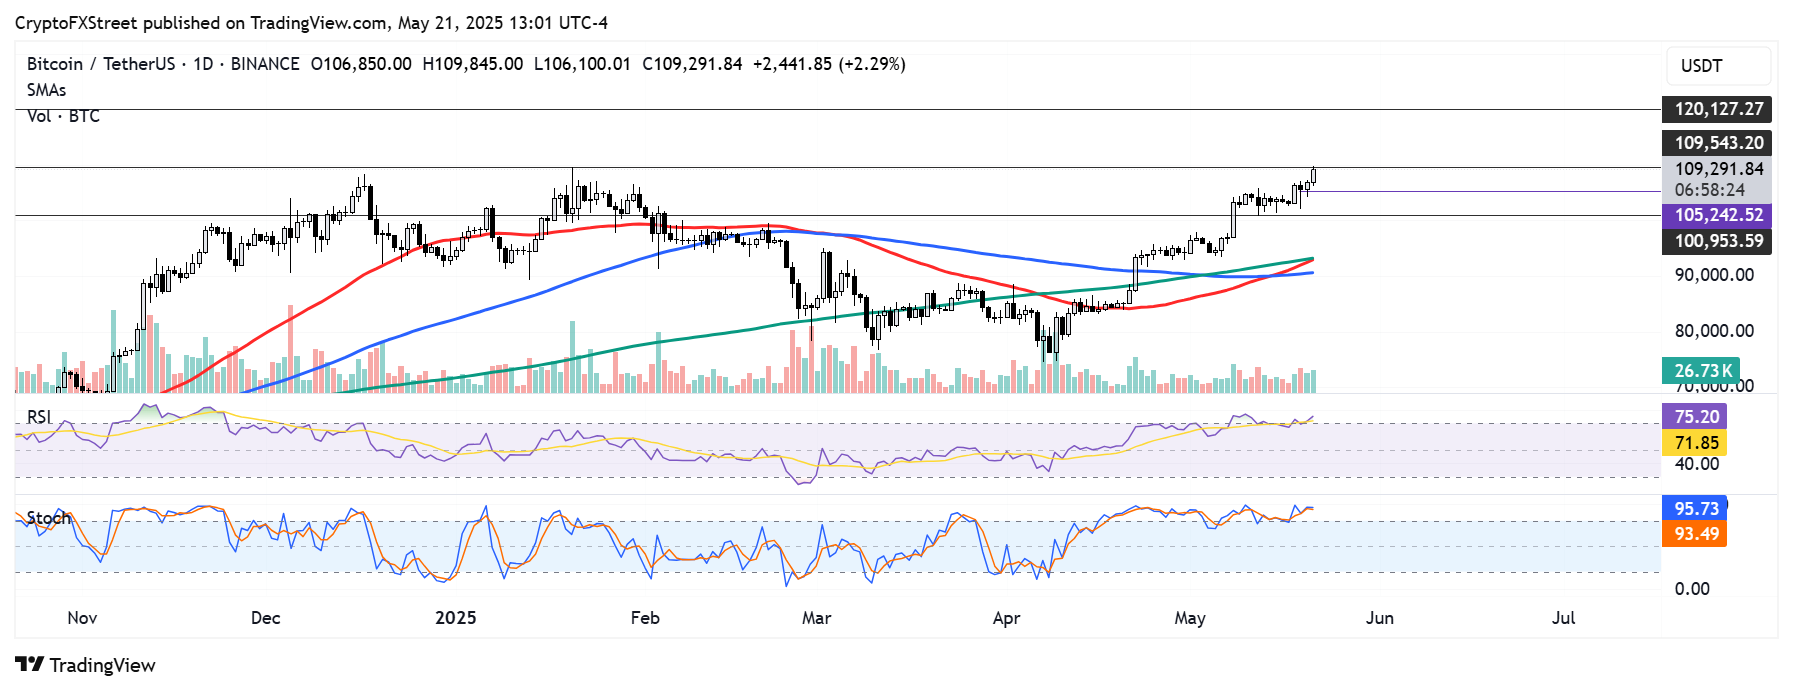
BTC/USDT daily chart
However, if BTC faces a pullback and closes below $105,000, it could extend the decline to retest the support near its psychological level at $100,000.
(This story was updated to add details about Bitcoin’s new all-time high and US spot BTC ETF investors)
Share:
Cryptos feed
Information on these pages contains forward-looking statements that involve risks and uncertainties. Markets and instruments profiled on this page are for informational purposes only and should not in any way come across as a recommendation to buy or sell in these assets. You should do your own thorough research before making any investment decisions. FXStreet does not in any way guarantee that this information is free from mistakes, errors, or material misstatements. It also does not guarantee that this information is of a timely nature. Investing in Open Markets involves a great deal of risk, including the loss of all or a portion of your investment, as well as emotional distress. All risks, losses and costs associated with investing, including total loss of principal, are your responsibility. The views and opinions expressed in this article are those of the authors and do not necessarily reflect the official policy or position of FXStreet nor its advertisers. The author will not be held responsible for information that is found at the end of links posted on this page.
If not otherwise explicitly mentioned in the body of the article, at the time of writing, the author has no position in any stock mentioned in this article and no business relationship with any company mentioned. The author has not received compensation for writing this article, other than from FXStreet.
FXStreet and the author do not provide personalized recommendations. The author makes no representations as to the accuracy, completeness, or suitability of this information. FXStreet and the author will not be liable for any errors, omissions or any losses, injuries or damages arising from this information and its display or use. Errors and omissions excepted.
The author and FXStreet are not registered investment advisors and nothing in this article is intended to be investment advice.
Search
RECENT PRESS RELEASES
Related Post


