Two Major Support Levels to Watch for Bitcoin Price This Week
June 8, 2025
Bitcoin (BTC) recently ended a two-week downtrend, which saw its price fall to $100,200 before bouncing back. Despite the recovery, Bitcoin still faces selling pressure from long-term holders (LTHs), which could make it vulnerable to a potential price correction.
The crypto market remains volatile, and Bitcoin’s next price movement will depend on these factors.
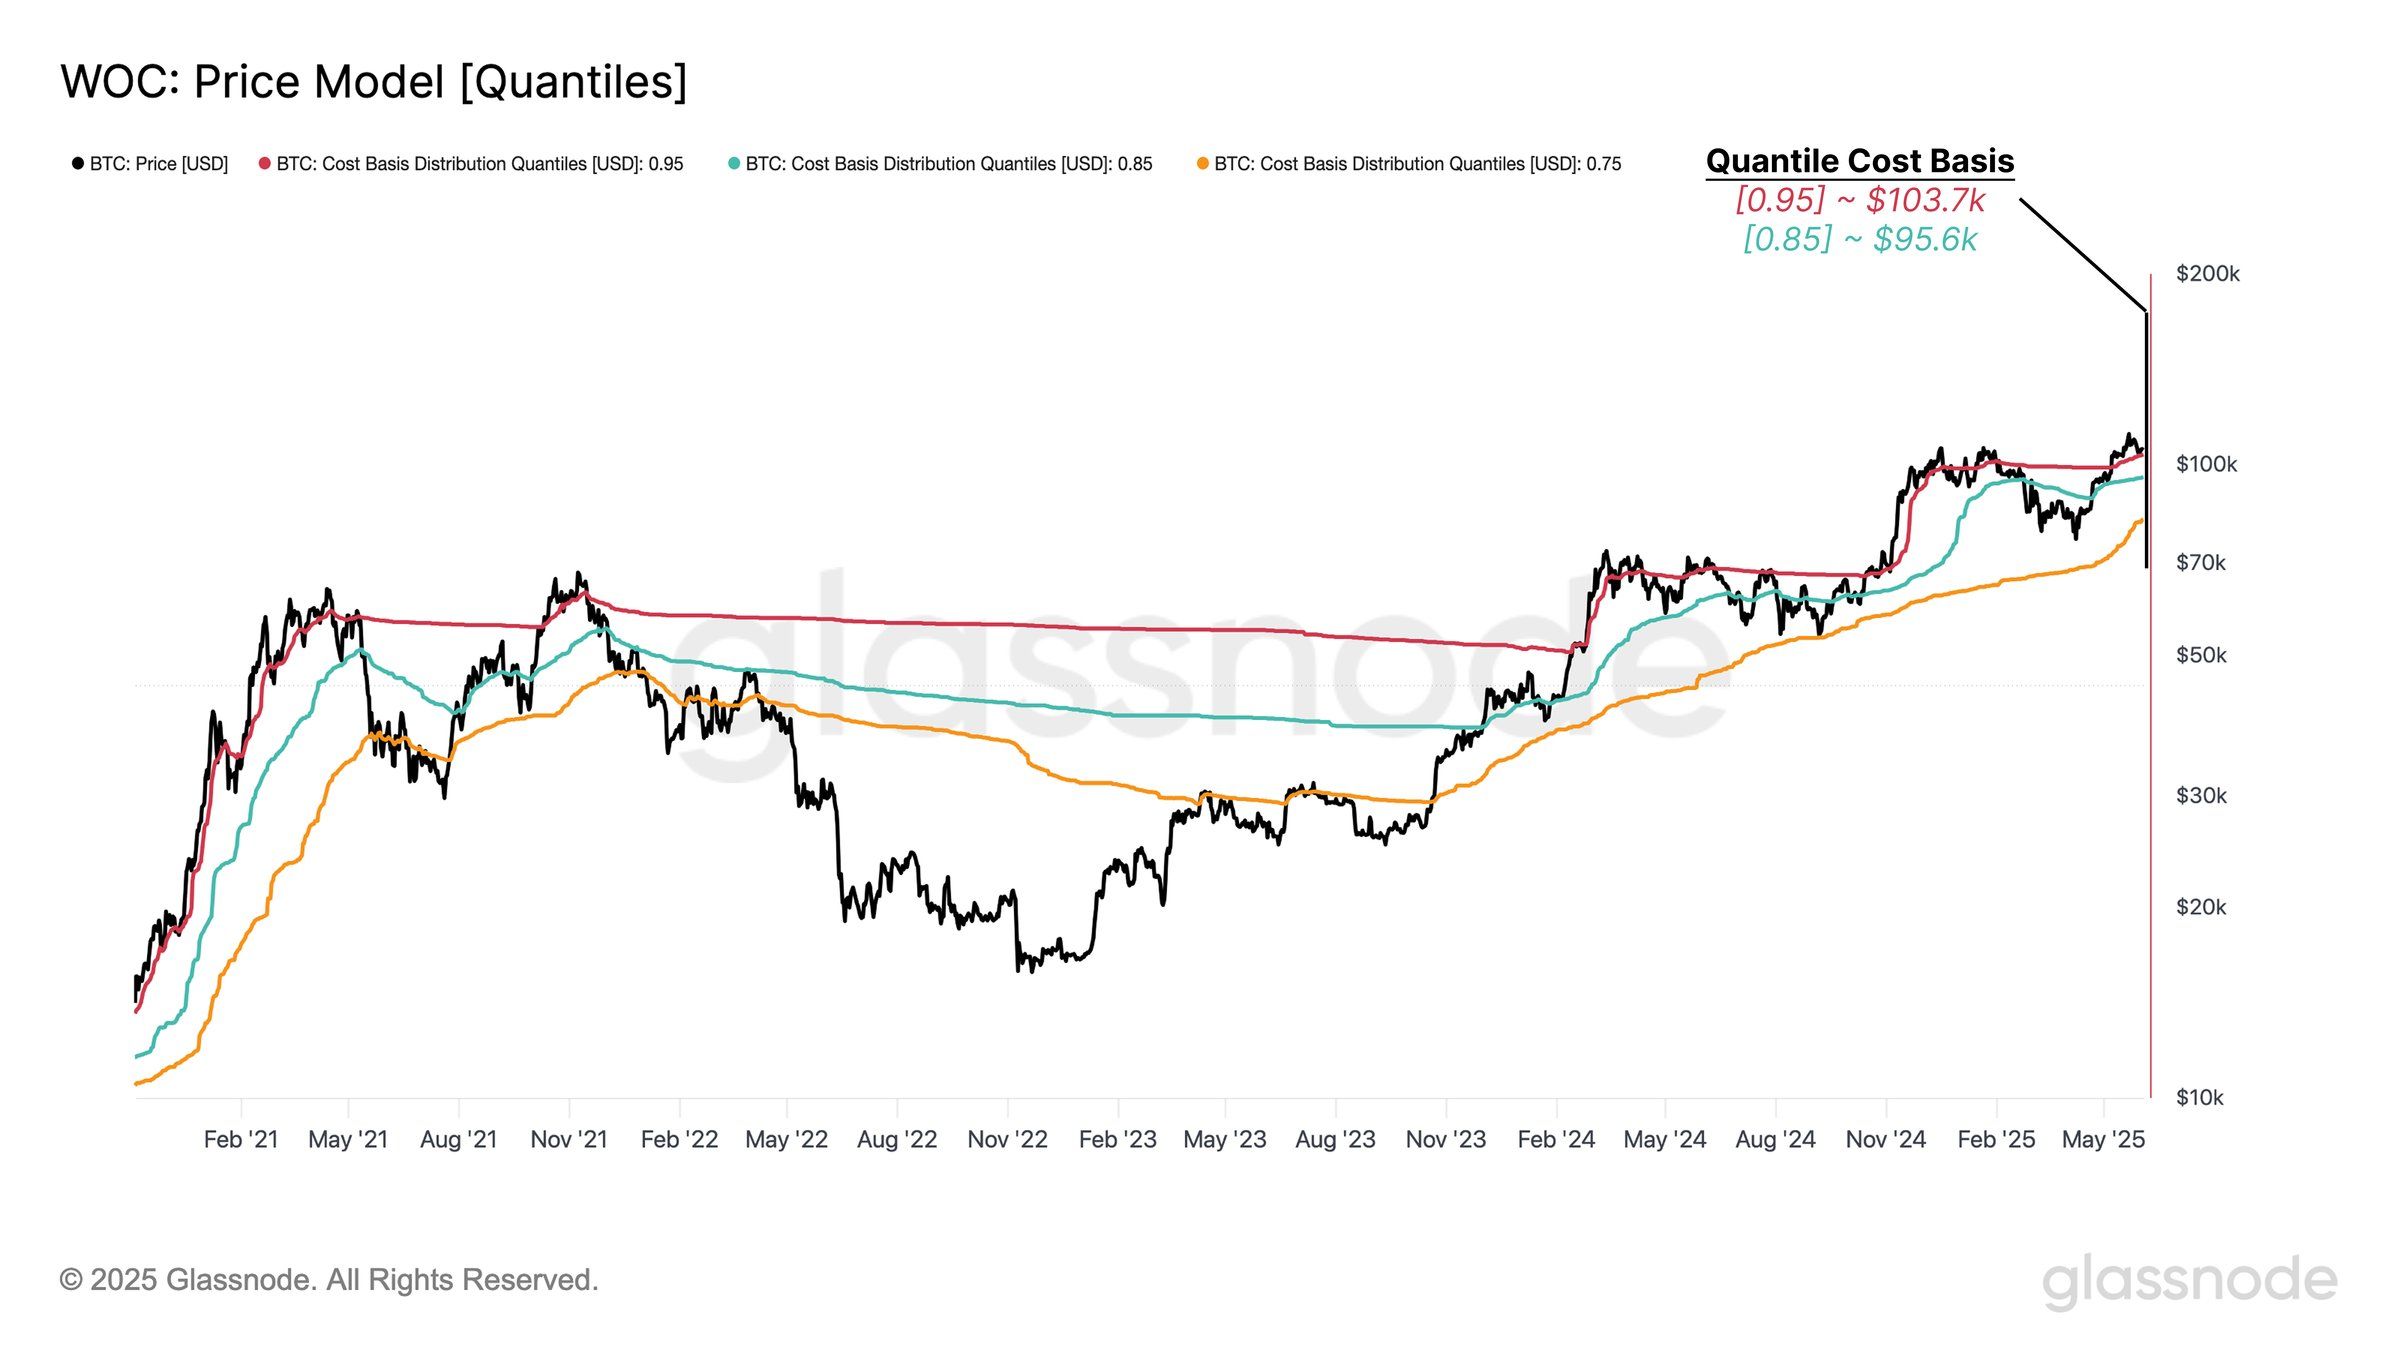
Bitcoin’s cost basis quantiles highlight key support levels that could be crucial in the near term. The 0.95 SSD (Spendable Supply Distribution) indicates that 95% of the circulating Bitcoin supply was bought below $103,700.
This suggests that only 5% of Bitcoin was acquired above this level, making $103,700 a strong support zone.
Additionally, another critical support level sits at $95,600, where the 0.85 SSD coincides. This level represents a point at which 85% of circulating Bitcoin has a lower acquisition price, making it another potential stronghold for Bitcoin’s price.
If Bitcoin faces more selling pressure, these levels could serve as strong barriers to a deeper drop.
Despite the selling pressure from LTHs, Bitcoin’s macro momentum suggests a positive outlook in the long term.
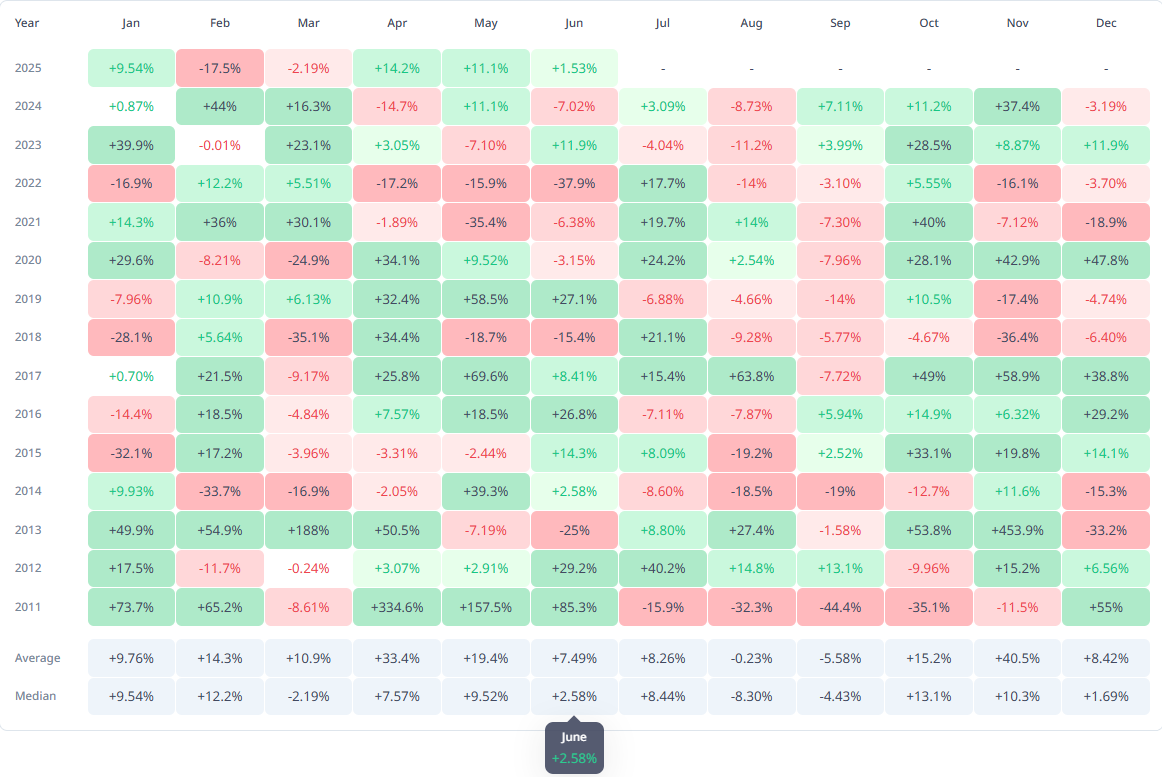
Historical monthly return data for Bitcoin shows that June has typically been a positive month for the asset, with a median rise of 2.58%. This indicates that while Bitcoin may face short-term corrections due to selling, the broader market trend could support price recovery.
The historical trend suggests that any correction Bitcoin faces due to LTH selling will likely be temporary. With Bitcoin’s price showing potential for growth in the long term, the market could soon shift toward bullish sentiment, especially if broader market conditions improve.
Bitcoin’s price has recently risen 4.7% over the past three days, trading at $106,263. However, the cryptocurrency remains just below the resistance level of $106,265.
Given the current market sentiment and key support levels, the factors at play suggest that Bitcoin might experience a decline in the short term.
If Bitcoin fails to maintain the $106,265 level and faces further selling pressure, it could fall through the $105,000 support and move toward $103,700.
This level, as identified in the quantiles cost basis, could provide significant support. In a more bearish scenario, Bitcoin could even slide to the next support at $102,734.

On the other hand, if the broader market turns bullish and counters the impact of LTH selling, Bitcoin could push past the $106,265 resistance level.
A successful breach of this level could lead Bitcoin toward $108,000 or even higher, invalidating the current bearish thesis and signaling a potential price rally.
Disclaimer
In line with the Trust Project guidelines, this price analysis article is for informational purposes only and should not be considered financial or investment advice. BeInCrypto is committed to accurate, unbiased reporting, but market conditions are subject to change without notice. Always conduct your own research and consult with a professional before making any financial decisions. Please note that our Terms and Conditions, Privacy Policy, and Disclaimers have been updated.

Search
RECENT PRESS RELEASES
Related Post


