Bitcoin’s slump under $103,000 crashes altcoins: FARTCOIN, ENA, LDO in freefall
June 12, 2025
- Bitcoin extends its losses amid market-wide risk-off sentiment, with Israel confirming strikes on Iran’s nuclear sites.
- FARTCOIN, ENA, and LDO experience double-digit crashes, reflecting the risk-off sentiment.
- The technical outlook suggests room for a steeper correction if Bitcoin drops under $100,000.
The broader cryptocurrency market risk-off sentiment, as Israel confirms attacks on Iran’s nuclear sites, triggers a wave of profit booking among top coins, leading to Bitcoin (BTC) edging lower by nearly 2% at press time on Friday. With the market leader under pressure, the top altcoins Ethereum (ETH), Solana (SOL), and Dogecoin (DOGE) have declined by nearly 10% in the last 24 hours, while XRP (XRP) has recorded a 6% drop during the same period.
As the crypto market trades in the red, Fartcoin (FARTCOIN), Ethena (ENA), and Lido DAO (LDO) rank the chart with a pullback of nearly 20% in the last 24 hours.
Bitcoin trades in the red on Friday at press time, briefly dropping under $103,000 to $102,664. With the third consecutive bearish candle, BTC erases the recovery earlier this week and is down nearly 2% so far this week.
Bitcoin marks a short-term recovery as it bounces off the high-demand zone, marked in a green band, above $102,000 and the rising 50-day Exponential Moving Average (EMA) at $104,458. This creates a minor shadow in the intraday candle, projecting recovery chances later in the day.
The Moving Average Convergence/Divergence (MACD) indicates a failed bullish reversal, as it reverses from its signal line without crossing above it. With the resurgence of bearish histograms, the indicator suggests a pullback phase is underway.
The Relative Strength Index (RSI) at 45 steps under the halfway level indicates a loss in bullish momentum. As RSI edges lower towards the oversold zone, it warns of further downside.
A daily close under the 50-day EMA at $104,458 could violate the support zone above $102,000. In such a case, sidelined investors could find an entry opportunity with $100,372, the 30-day lowest trading price, as the next immediate support.
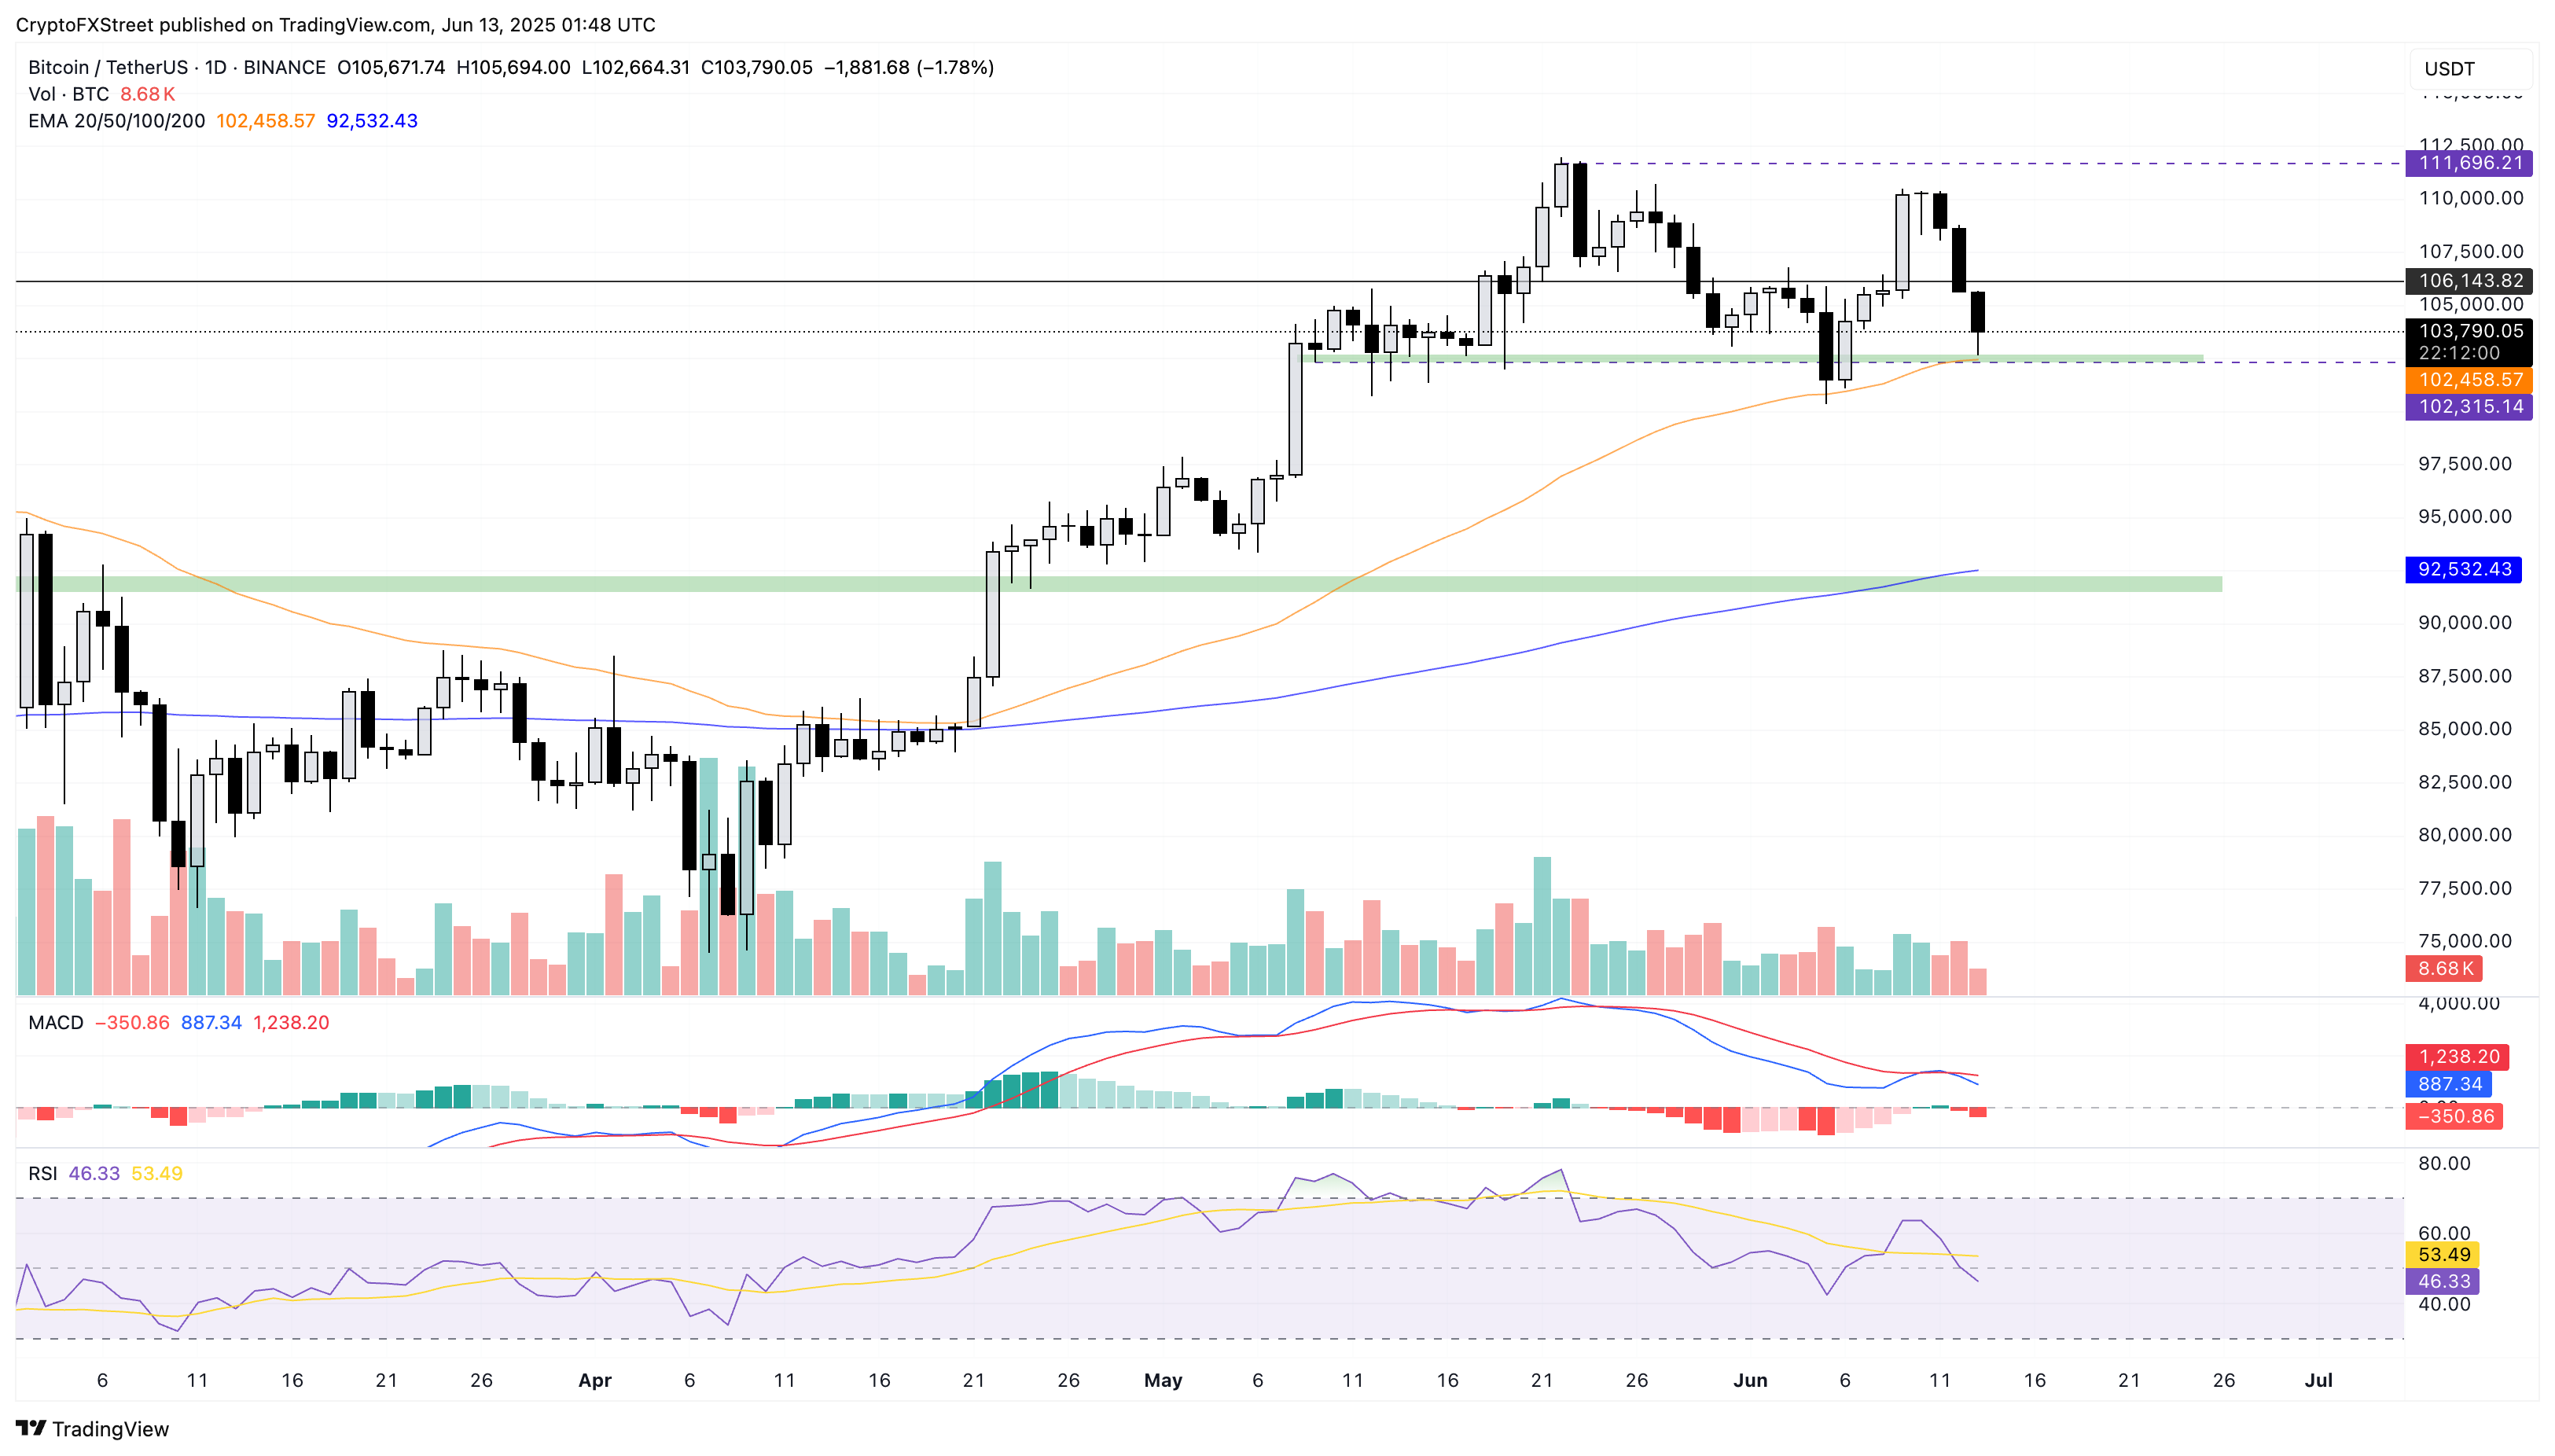
BTC/USDT daily price chart.
However, a recovery later in the day, as Bitcoin upholds the 50-day EMA, could result in a consolidation move before taking a recovery run towards the all-time high of $111,980.
Fartcoin marks its third consecutive bearish day, reversing from Wednesday’s high at $1.53. Crossing below its 50-day EMA at $1.13, the meme coin is down by over 10% to $1.09 at press time on Friday.
The momentum indicator suggests a sharp surge in bearish momentum as the RSI at 45 drops below the halfway line and the MACD nears crossing below its signal line.
The immediate support lies at $0.92, marked by the low on May 7, if it breaks below the $1 psychological support level.
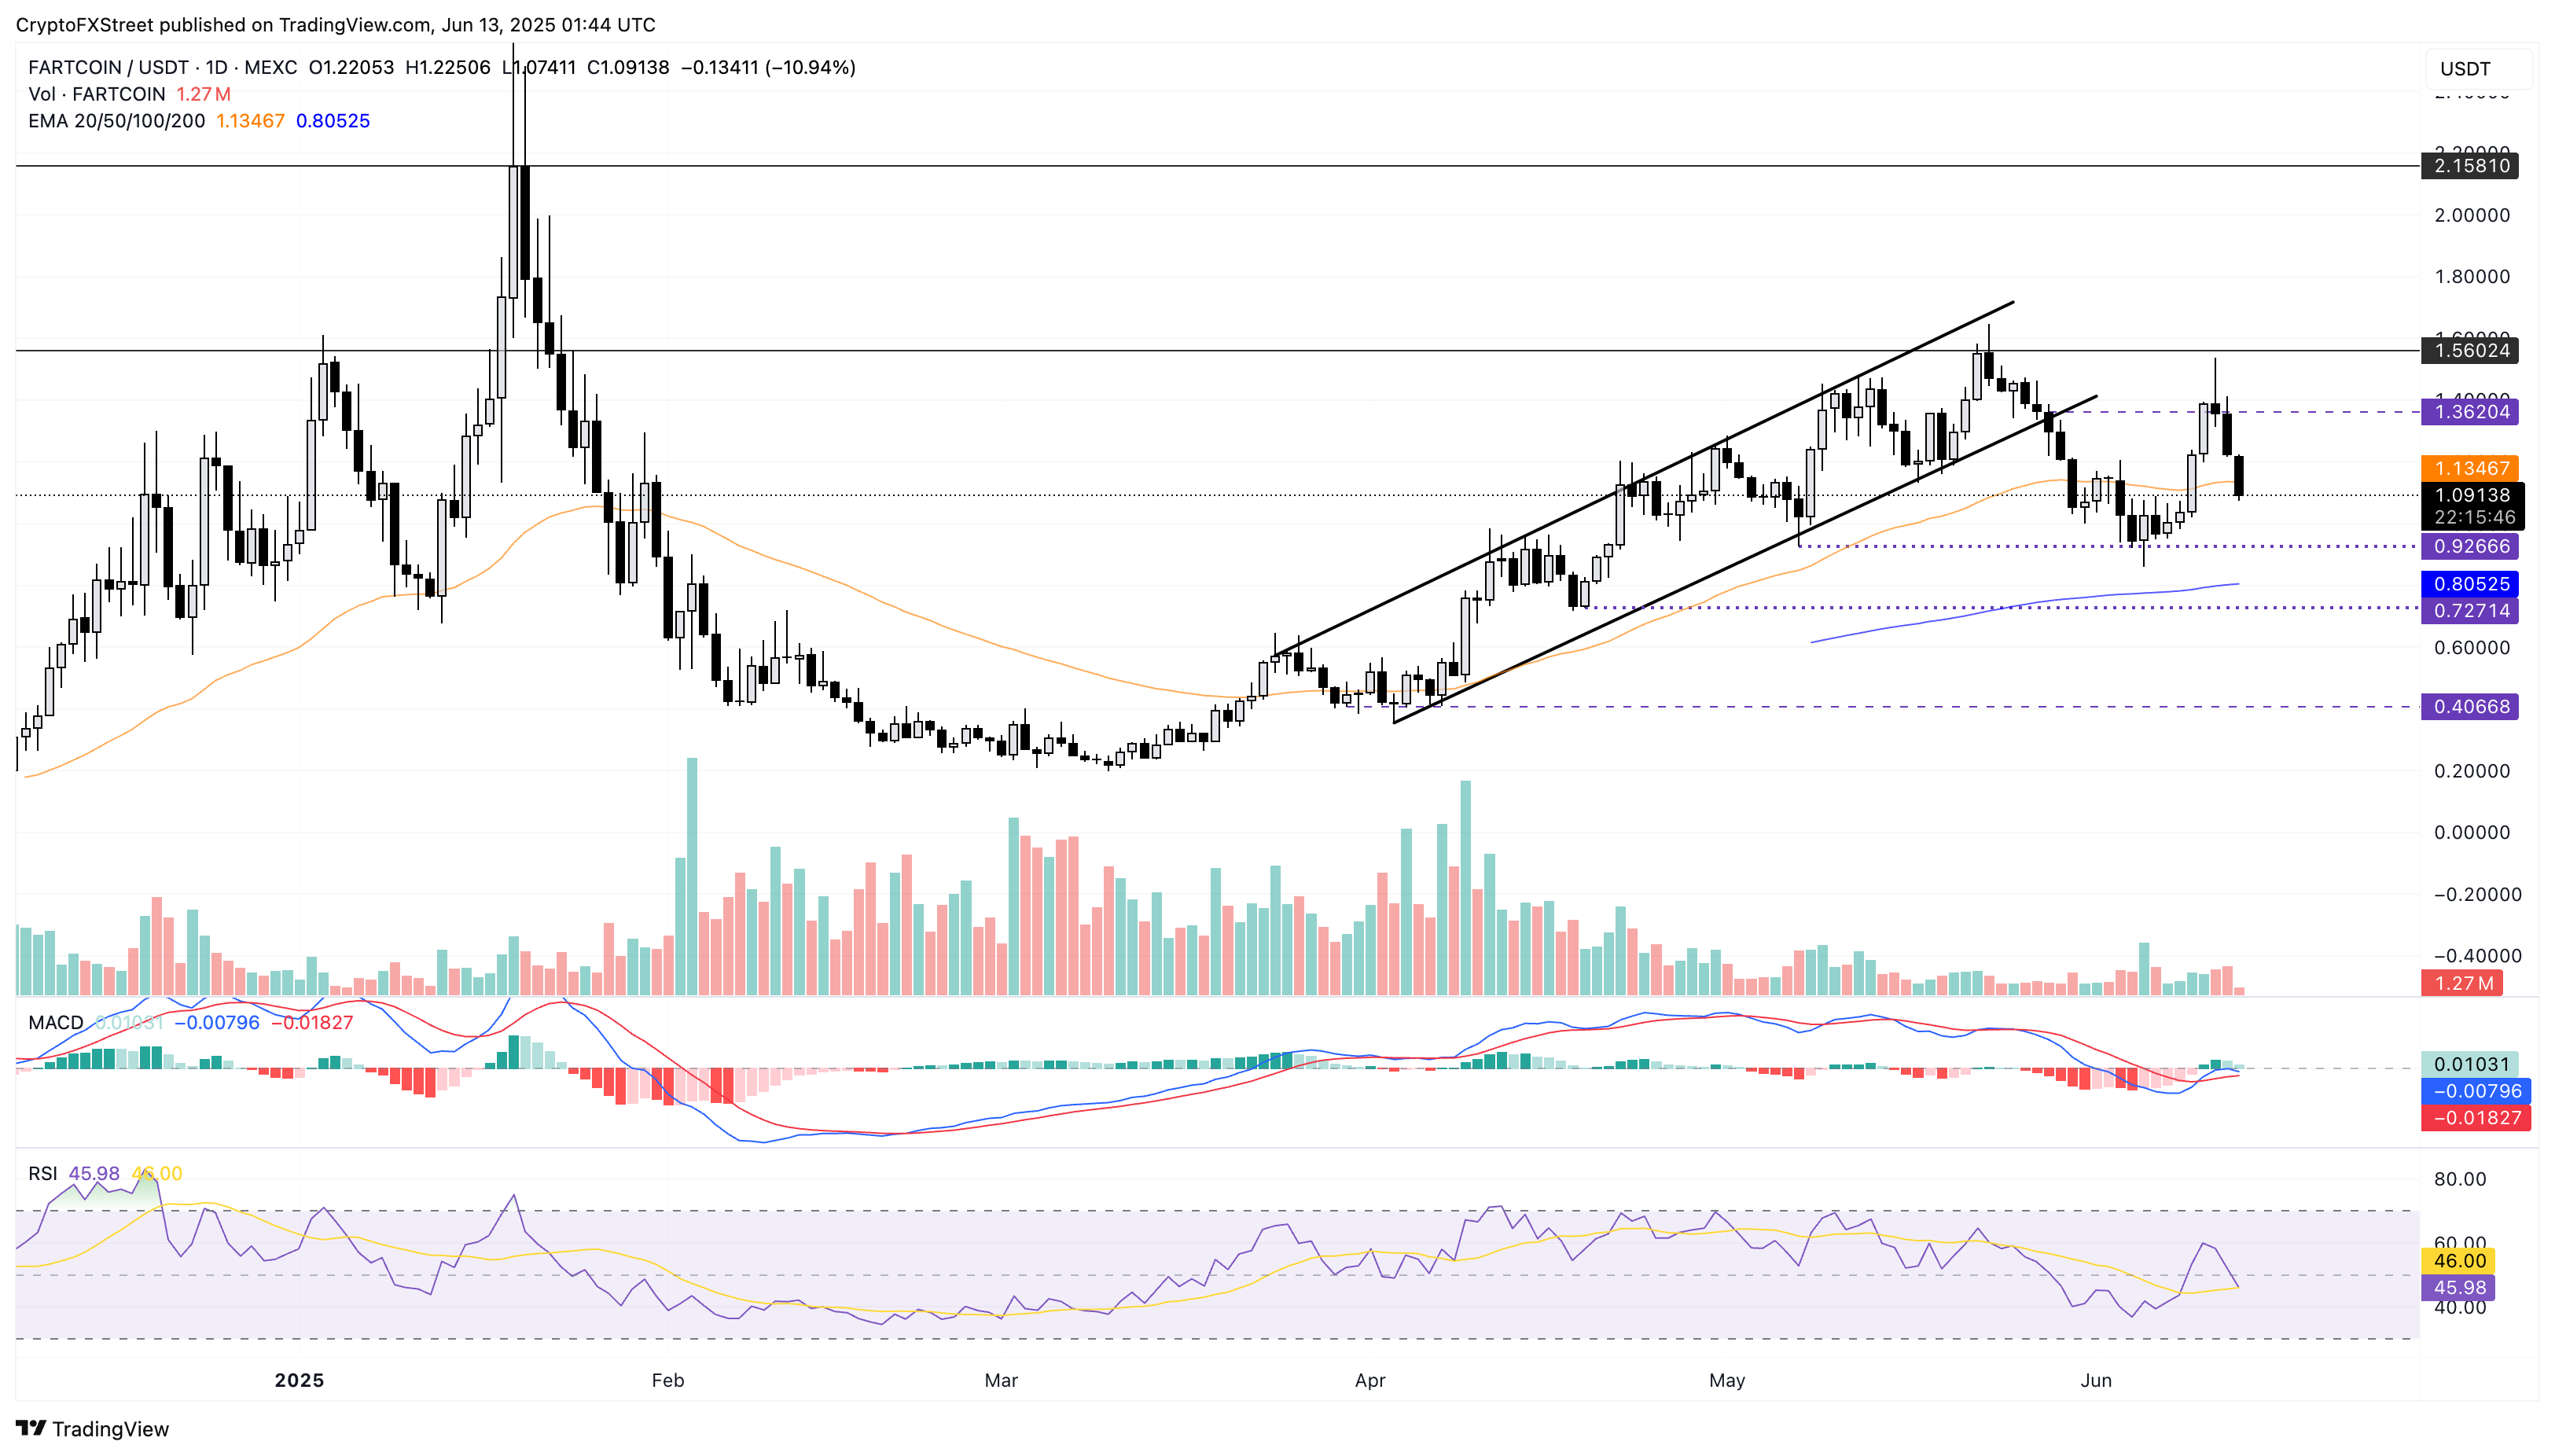
FARTCOIN/USDT daily price chart.
A reversal above $1.36 will nullify the downfall and could result in a surge towards the Wednesday high at $1.53.
Ethena prolongs the lower high trend with the recent reversal from $0.37 on Wednesday. With an over 20% drop in the last three days, ENA tests the support level at $0.28, marked by a low last Thursday.
The momentum indicators on the daily chart show a similar bearish momentum surge to other coins. The MACD indicator drops below its signal line while the RSI at 41 nears the oversold zone.
A closing below $0.28 could test the lowest 30-day trading price at $0.25.
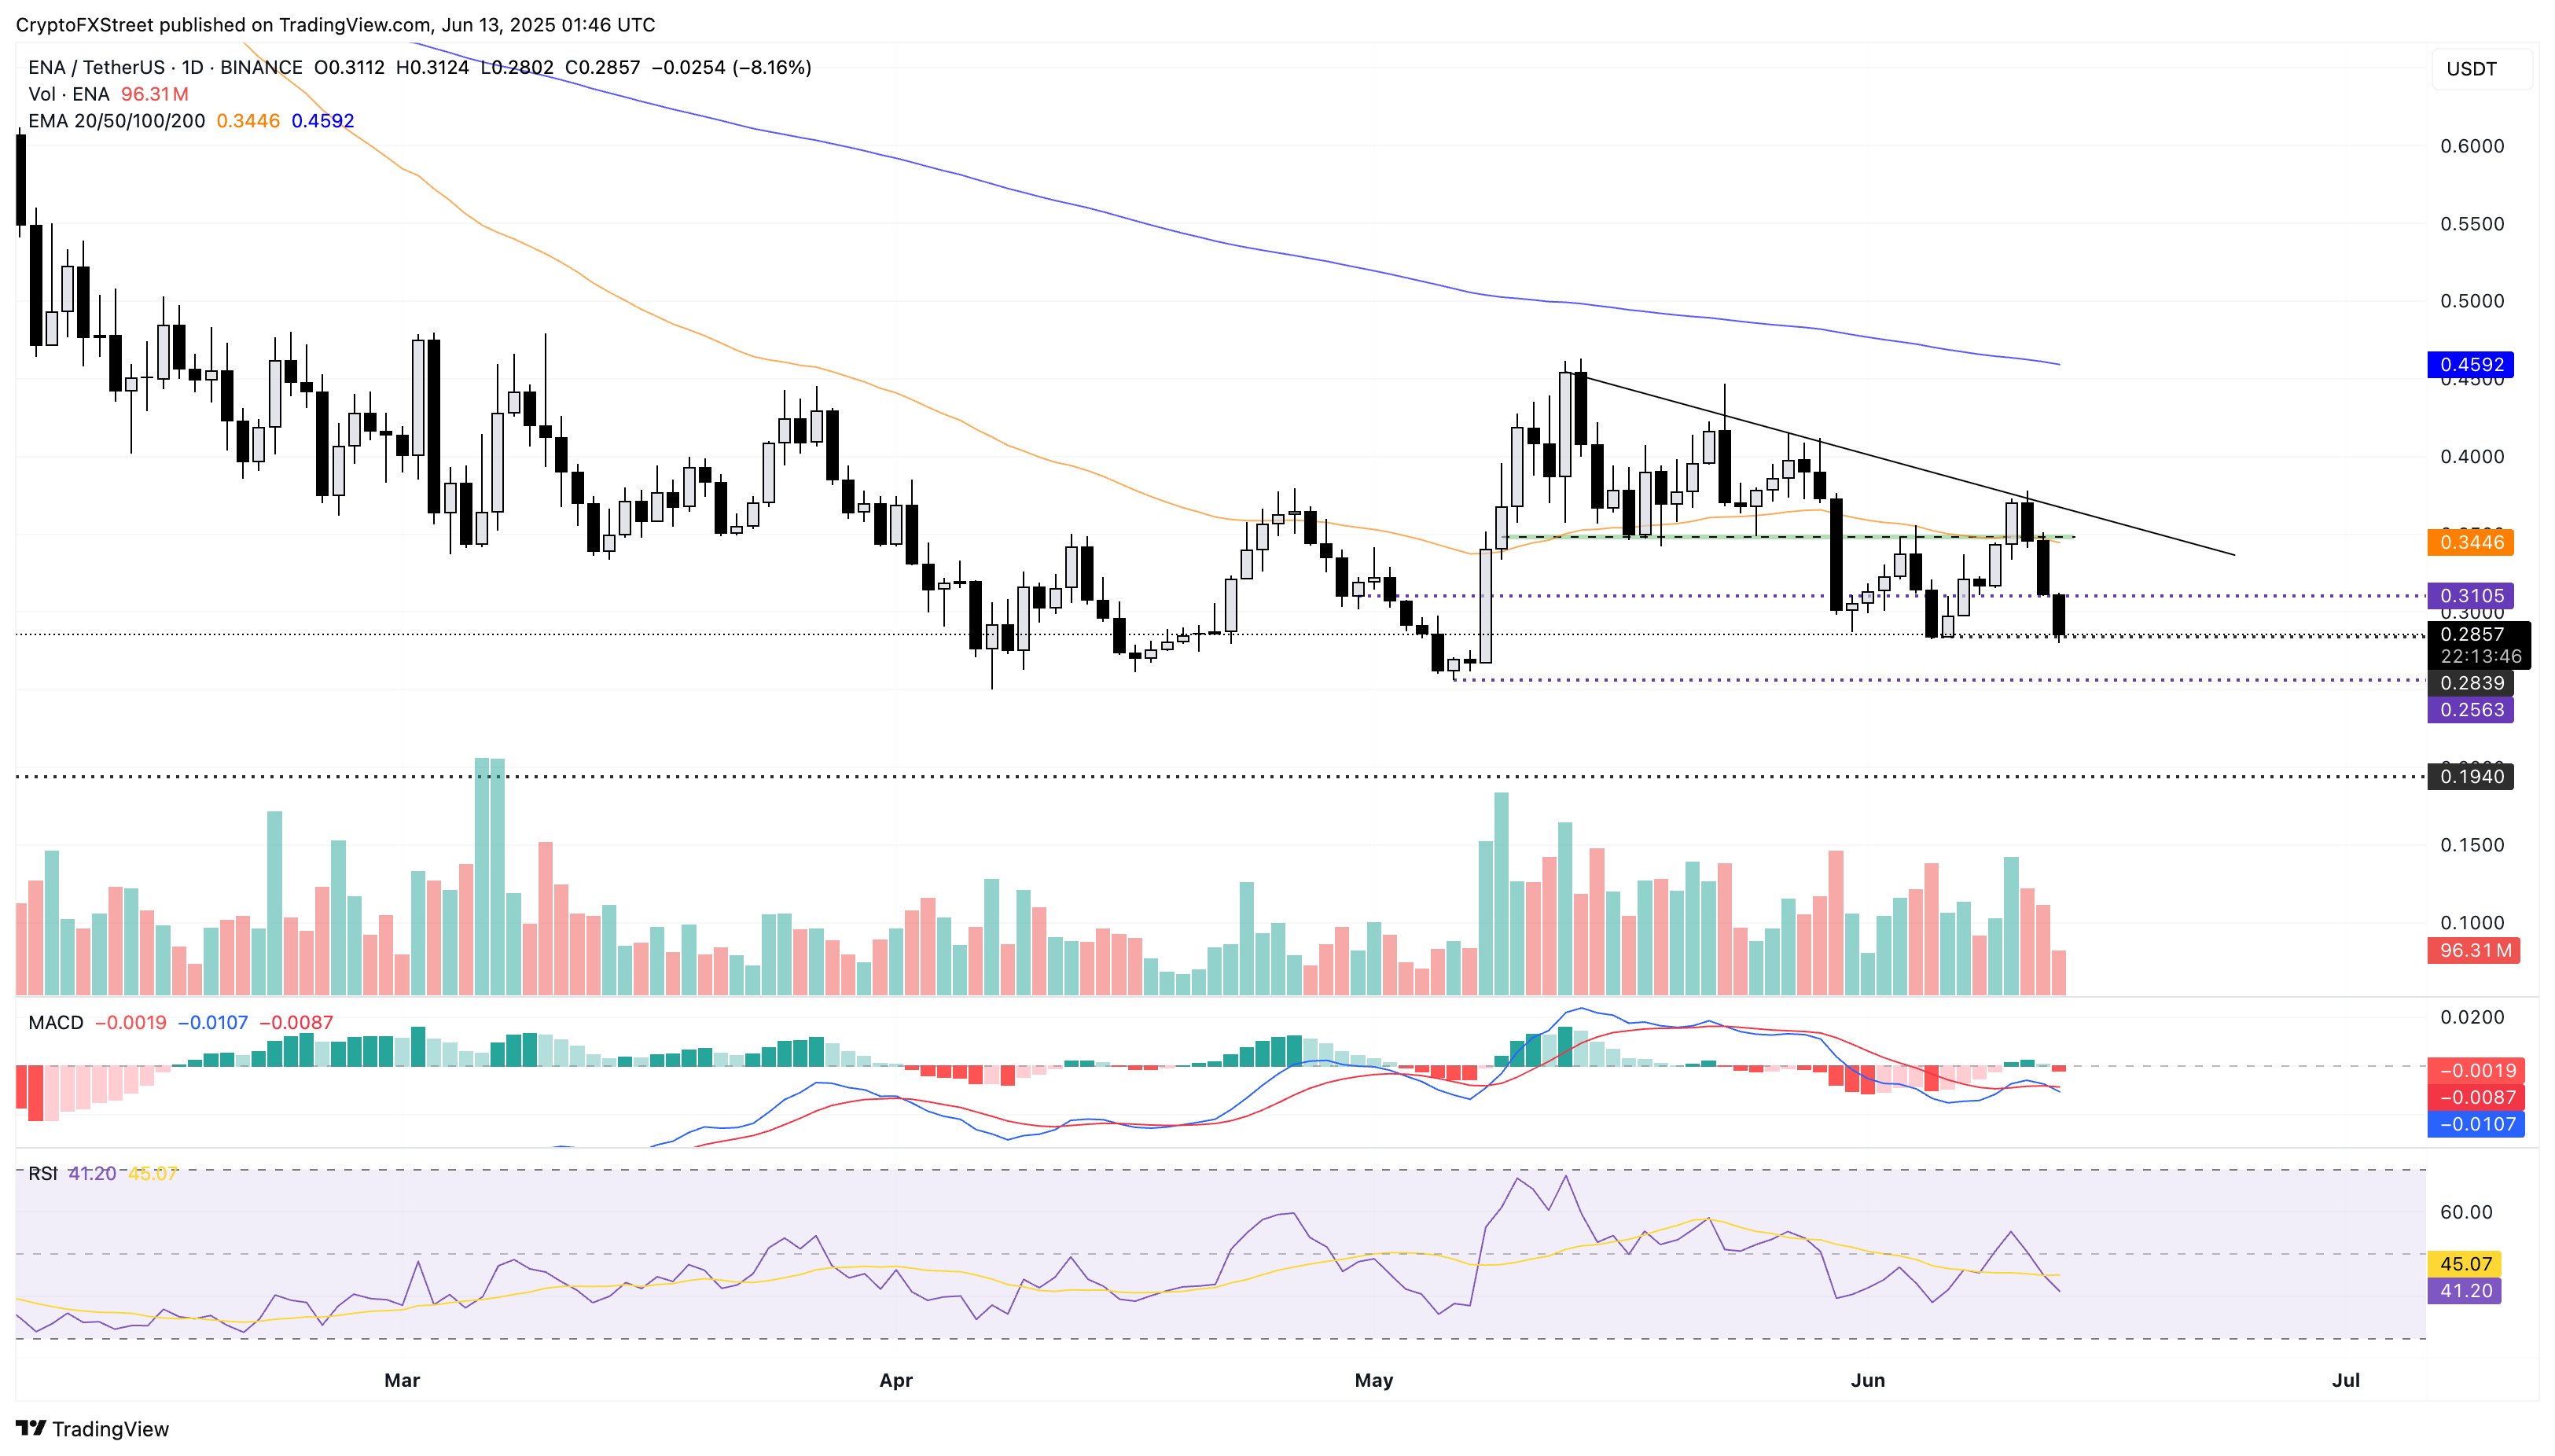
ENA/USDT daily price chart.
A reversal above $0.30 could pause the steep correction, potentially leading to a sideways trend.
LDO fails to close above the $1 psychological resistance level despite the breakout of a long-awaited resistance trendline in the daily chart. Closing below the 50-day EMA, the altcoin retests the broken trendline.
The MACD indicator drops towards its signal line for a bearish crossover as the bullish histograms decline. The RSI indicator drops under the halfway level at 44, projecting a sudden decline in bullish momentum.
If the downtrend extends, it could test the $0.74 support level marked by a low on May 6.
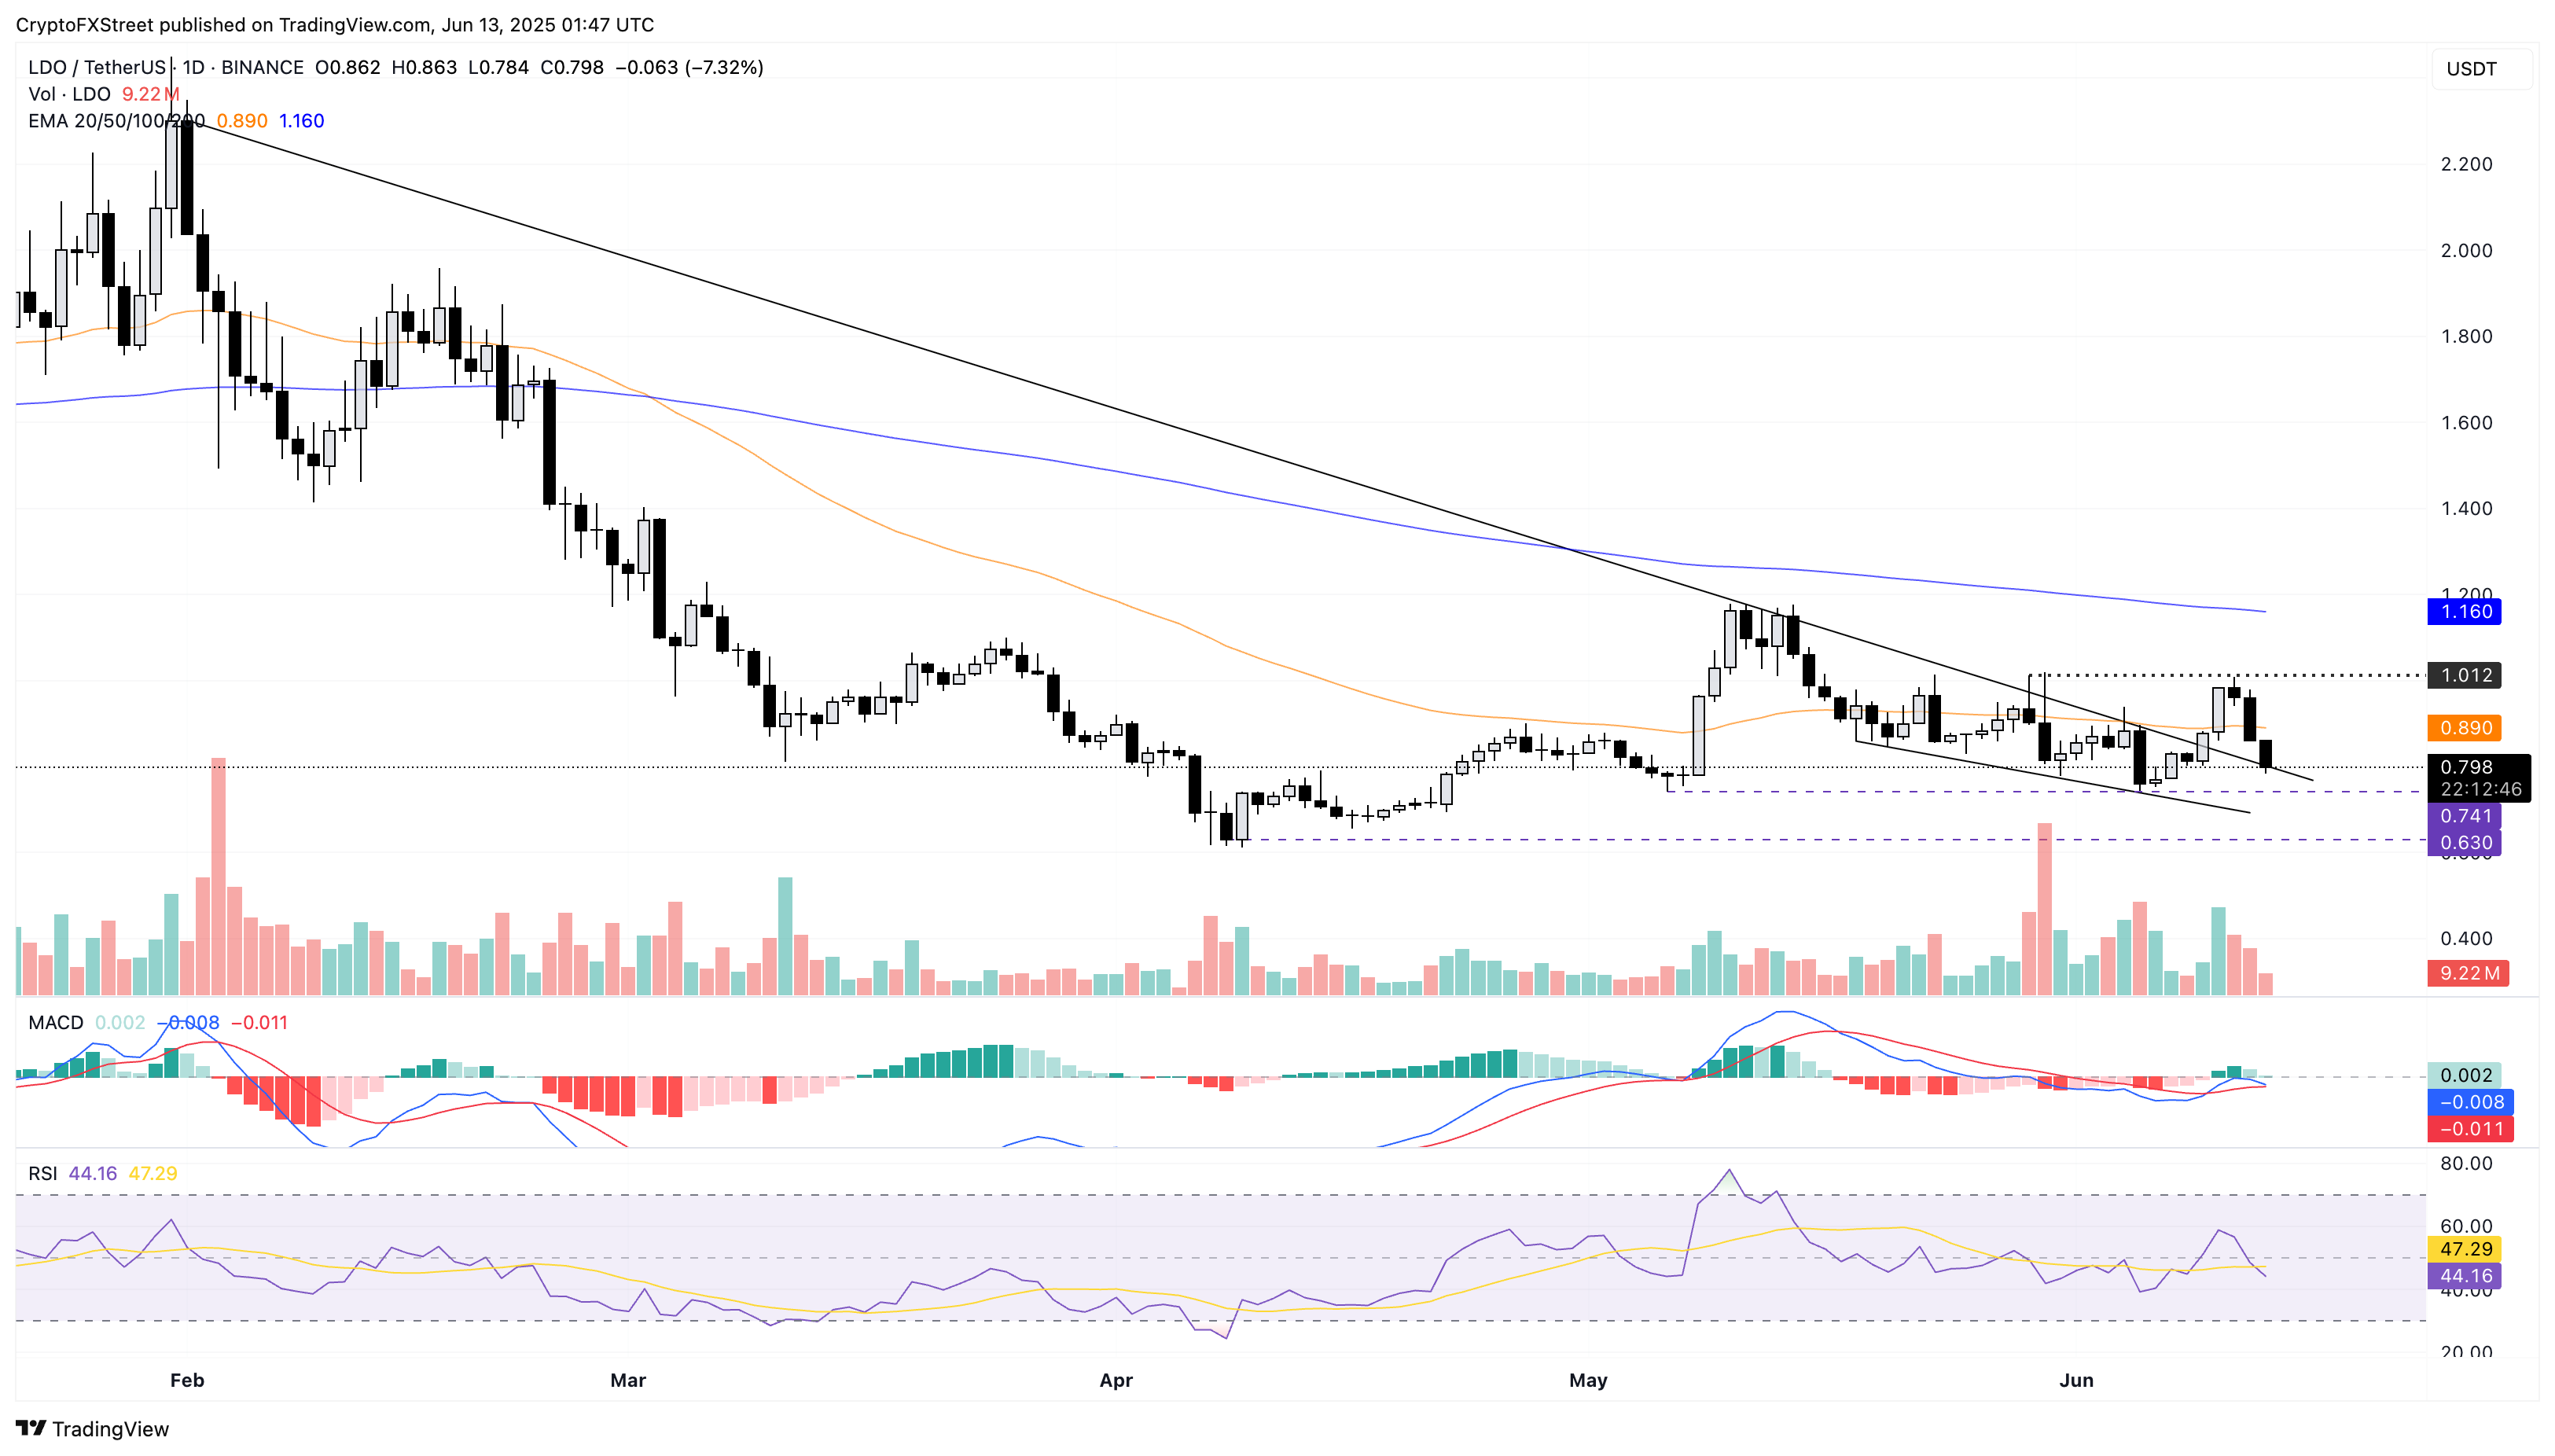
LDO/USDT daily price chart.
However, a reversal above could trend towards the $1 psychological level.
Information on these pages contains forward-looking statements that involve risks and uncertainties. Markets and instruments profiled on this page are for informational purposes only and should not in any way come across as a recommendation to buy or sell in these assets. You should do your own thorough research before making any investment decisions. FXStreet does not in any way guarantee that this information is free from mistakes, errors, or material misstatements. It also does not guarantee that this information is of a timely nature. Investing in Open Markets involves a great deal of risk, including the loss of all or a portion of your investment, as well as emotional distress. All risks, losses and costs associated with investing, including total loss of principal, are your responsibility. The views and opinions expressed in this article are those of the authors and do not necessarily reflect the official policy or position of FXStreet nor its advertisers. The author will not be held responsible for information that is found at the end of links posted on this page.
If not otherwise explicitly mentioned in the body of the article, at the time of writing, the author has no position in any stock mentioned in this article and no business relationship with any company mentioned. The author has not received compensation for writing this article, other than from FXStreet.
FXStreet and the author do not provide personalized recommendations. The author makes no representations as to the accuracy, completeness, or suitability of this information. FXStreet and the author will not be liable for any errors, omissions or any losses, injuries or damages arising from this information and its display or use. Errors and omissions excepted.
The author and FXStreet are not registered investment advisors and nothing in this article is intended to be investment advice.
Search
RECENT PRESS RELEASES
Related Post


