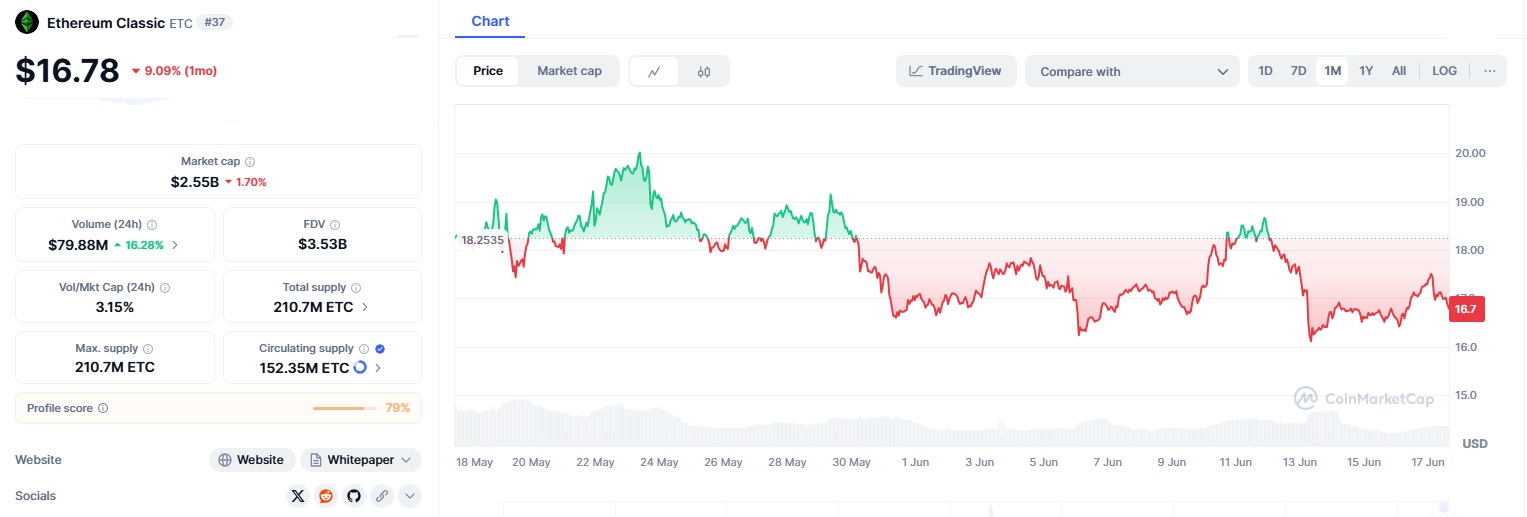
Is A Rally Coming? Ethereum Classic Price Chart Hints At Surge
June 17, 2025
The Ethereum Classic price chart is getting a lot of attention from crypto traders right now. Known as the original Ethereum blockchain that sticks to its promise of immutability, Ethereum Classic (ETC) has been showing some encouraging signs. Even though it took a little dip recently, the charts are hinting that a big move upward might be coming soon. With positive patterns forming and growing interest from the market, many are wondering if ETC is gearing up for a rally. Let’s take a look at what the latest chart trends and expert opinions are saying about ETC’s next move.
Decoding the Ethereum Classic Price Chart
Ethereum Classic is currently trading around $16.78, up about 2% in the last day according to Coinmarketcap (17 June 2025). But it’s had some ups and downs recently, dropping nearly 9% over the last month.
Looking at the daily price chart, ETC is forming a symmetrical triangle pattern basically, the price is squeezing between two lines coming closer together. This kind of pattern usually means a big move could be coming soon. If ETC breaks out upward, it could push prices toward $18.70, $21, or even $28.50.
Technical signals back this up. The Relative Strength Index (RSI) is at a neutral 45, so there’s still room for the price to rise without overheating. Plus, ETC recently broke out of a falling wedge pattern on the 6-hour chart, which some traders see as a bullish sign with targets around $21 to $30 if momentum keeps up. That said, if ETC can’t climb above $18.20, it might dip back to test support near $16.45. So, it’s an exciting time for ETC traders watching for that next big move.
Why a Rally Could Be Imminent
Several things point to a possible rally for Ethereum Classic (ETC):
-
Technical Signals: ETC’s price is showing strong patterns like a symmetrical triangle and a recent breakout from a falling wedge both signs that the price might be gearing up to move higher. In fact, past trends show ETC often jumps after these kinds of consolidations. Some experts even see it reaching $50.87, which would be a big gain!
-
Network Strength: Since Ethereum’s big merge, ETC has stood out by keeping its proof-of-work system, attracting miners and making its network more secure. This stability helps build long-term confidence in the coin.
-
Market Mood: The Fear & Greed Index is showing “Extreme Fear” right now, which often means the coin is undervalued a potential buying opportunity. Plus, with over $52 million traded in the last 24 hours, more people are paying attention.
-
Growing Community: ETC is actively investing in its future by funding projects and hosting hackathons, helping boost adoption and support for the coin.
All these factors combined make ETC an exciting coin to watch right now!
Expert Insights on Ethereum Classic Price Chart
Crypto experts and influencers are keeping a close eye on Ethereum Classic’s price chart, sharing a mix of excitement and caution about what’s next for ETC. As posted by a user on X, a trader, ETC broke out of a bullish falling wedge and said, “If momentum keeps up, we could see prices climb to $20.94, $22.21, $30.04, and even $35.00.”
Crypto enthusiasts have highlighted a symmetrical triangle pattern on the daily chart and expects a breakout to push ETC toward $18.70, $21, $24.50, and $28.50.
On the cautious side, some analysts note that ETC needs to stay above $17.50 to maintain bullish momentum, warning that a drop below $16.80 could slow progress. On the optimistic side, community supporters highlight ongoing hackathons and infrastructure grants as signs of strong development, with a goal of ETC eventually reaching one-tenth the value of Ethereum. All in all, there’s a lot of buzz around ETC, with plenty of reasons to be hopeful but also some key levels to watch.
Even though things look promising for Ethereum Classic, there are still some risks to keep in mind. If ETC can’t push above $18.20, it might drop back down to around $16.45 or even lower, as analyst Ali Martinez warns. Plus, since ETC often moves along with Bitcoin and Bitcoin recently dipped to about $101,095 that could put extra pressure on ETC’s price. On top of that, ongoing regulatory uncertainty in crypto could slow things down. That said, ETC’s strong track record gives it a bit of a safety net in uncertain times.
Is ETC Poised for a Surge?
The Ethereum Classic (ETC) price chart is looking exciting right now. Technical patterns like the symmetrical triangle and falling wedge suggest a possible rally. Price targets range from around $21 to $50, making traders feel optimistic. However, some experts advise keeping an eye on important support levels. For those closely monitoring, it’s crucial for ETC to stay above $17.50 to maintain its positive momentum. If it drops below $16.80, things might slow down. With increasing trading activity, a stable network, and ongoing development, ETC seems poised for a potential breakout. Will it deliver the rally everyone’s hoping for? The charts suggest it’s possible, and the market is definitely paying attention.
FAQs
- What does the Ethereum Classic Price Chart currently show?
The Ethereum Classic Price Chart indicates ETC trading at $17.06, with a symmetrical triangle pattern suggesting a potential breakout toward $18.70-$28.50. - Why does the Ethereum Classic Price Chart hint at a rally?
Bullish patterns like a falling wedge breakout and neutral RSI at 45, combined with increased trading volume, point to possible upward momentum. - What risks could affect the Ethereum Classic Price Chart?
A drop below $16.80 could delay the rally, and broader market volatility, tied to Bitcoin’s dip, may pressure ETC’s price. - How do fundamentals support the Ethereum Classic Price Chart?
ETC’s stable proof-of-work network and ecosystem growth through grants and hackathons bolster the bullish outlook on the Ethereum Classic Price Chart.
Search
RECENT PRESS RELEASES
Related Post


