Bitcoin Dip Nearing End? Data Shows Short-Term Sellers Losing Steam
June 19, 2025

Trusted Editorial content, reviewed by leading industry experts and seasoned editors. Ad Disclosure
Bitcoin (BTC) has dropped 4.4% over the past seven days, raising concerns that the top cryptocurrency by market cap may face a sharp price crash amid global macroeconomic uncertainty. However, fresh on-chain data suggests the current dip may be nearing its end.
Bitcoin Dip Inching Closer To Its End
According to a recent post on X by crypto analyst CryptoGoos, the ongoing Bitcoin dip appears to be losing momentum. The analyst shared the following chart, noting that short-term BTC sellers are “getting exhausted.”
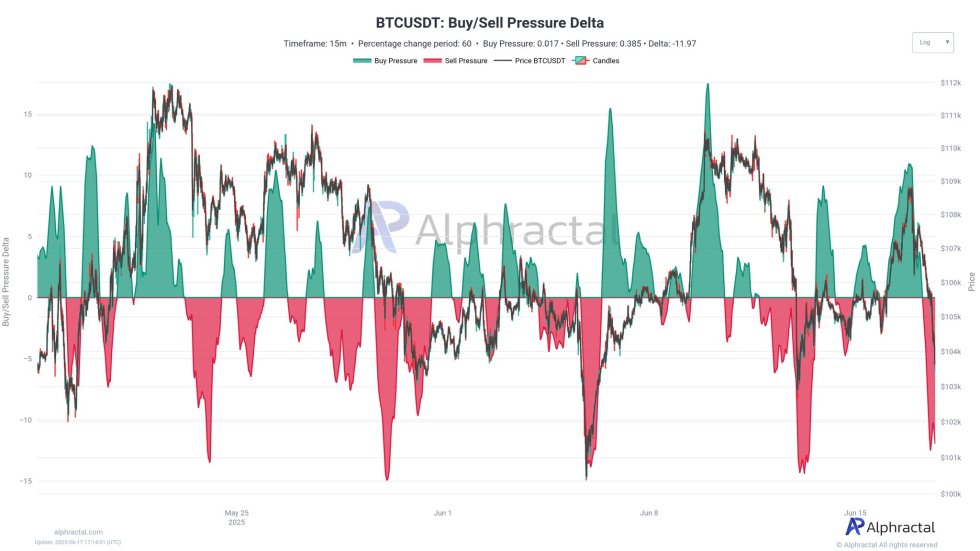
The chart illustrates the Bitcoin buy/sell pressure delta, which measures the difference between buying and selling activity on exchanges – typically using order book data or on-chain flows. A positive delta indicates stronger buying interest, while a negative delta suggests higher selling pressure.
Related Reading: Bitcoin Riding Global Liquidity Wave? Analyst Eyes $150,000 Target
A visible reduction in the intensity and frequency of red spikes – representing sell pressure – toward the right side of the chart suggests that selling pressure is weakening. At the same time, the increasing presence of green spikes reflects rising dominance of buy orders over sell orders.
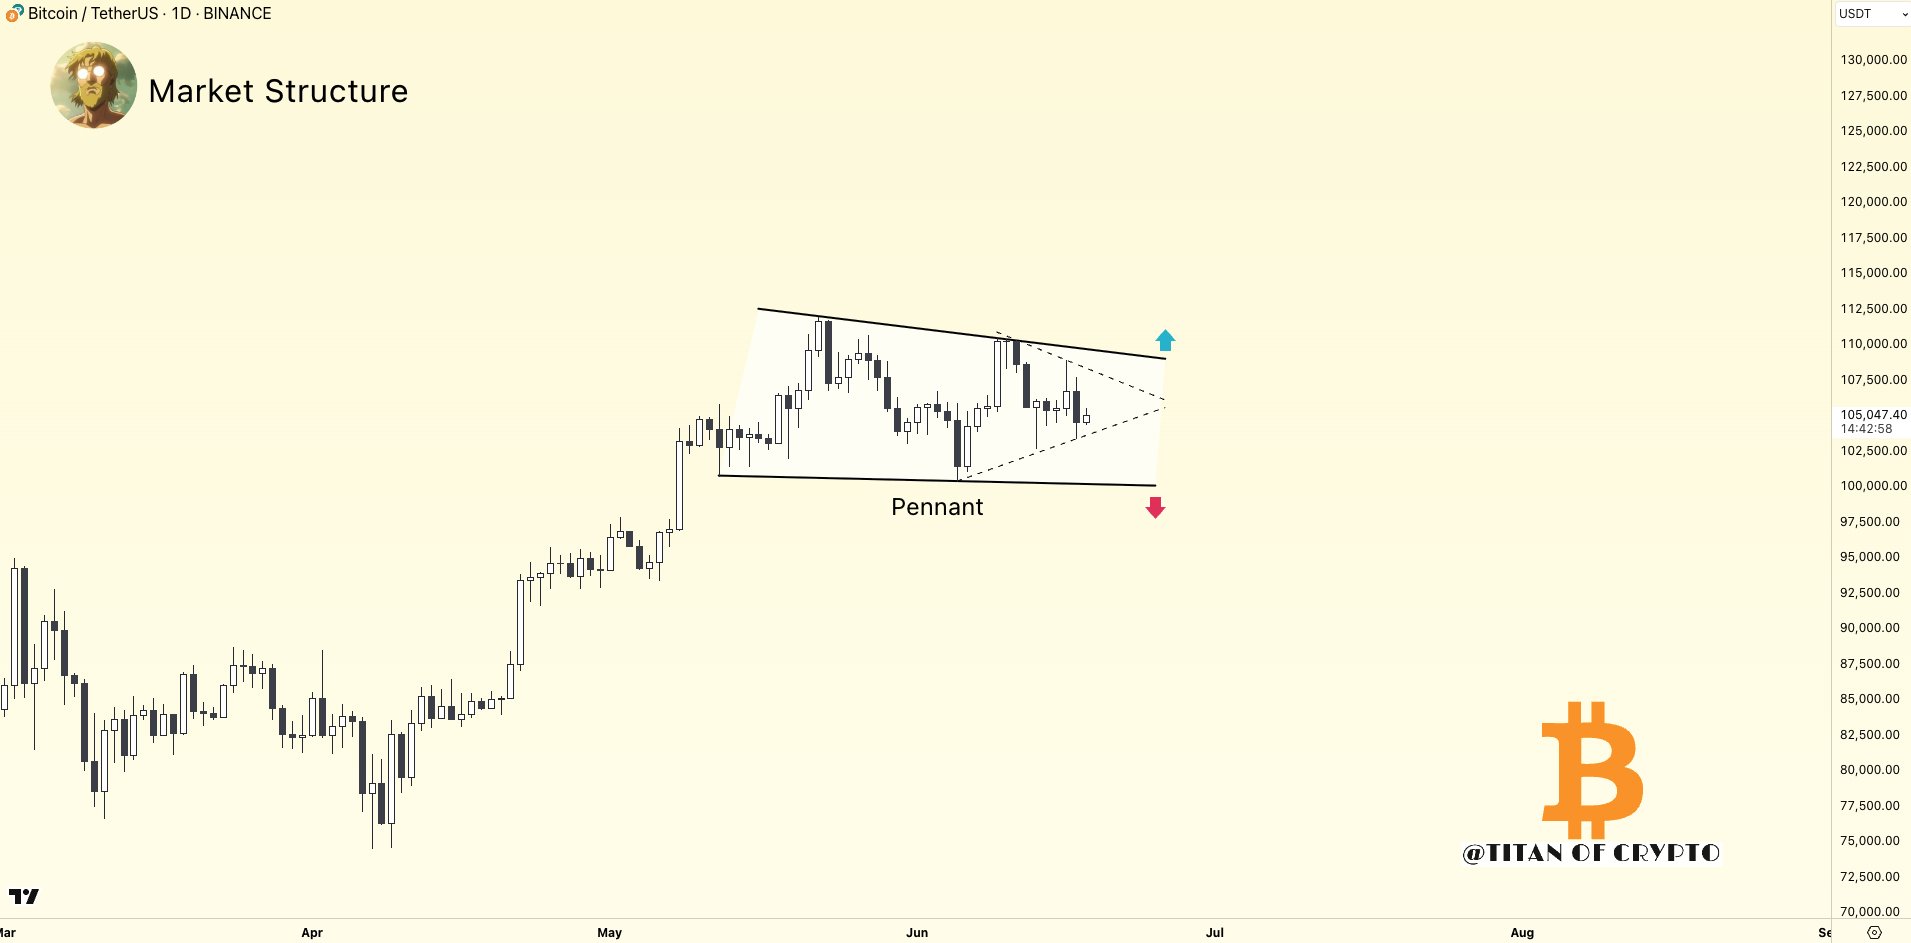
Meanwhile, crypto analyst Titan of Crypto pointed to a potential bullish pennant forming on the daily Bitcoin chart. He noted that the price’s next major move could depend on the upcoming US Federal Reserve’s FOMC (Federal Open Market Committee) meeting.
Similarly, crypto trader Merlijn The Trader shared a bullish outlook, noting that Bitcoin’s Moving Average Convergence Divergence (MACD) indicator has flipped green on the weekly chart while maintaining its current structure.
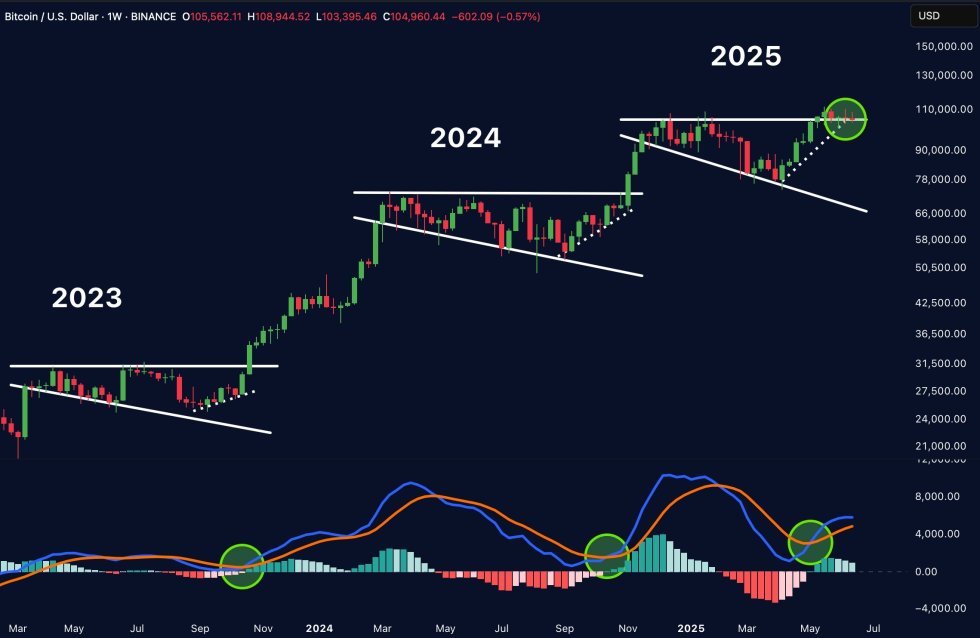
For the uninitiated, the MACD is a momentum indicator used to spot changes in the strength and direction of a trend in prices. It does this by comparing two moving averages of a price and shows signals when those lines cross, helping traders decide when to buy or sell.
BTC Must Defend This Support Level
In a separate X post, seasoned analyst Ali Martinez highlighted a critical support level that Bitcoin must hold to avoid a major correction. Citing the Market Value to Realized Value (MVRV) Pricing Bands, Martinez warned that if BTC falls below $102,044, it could drop as low as $82,570.
Related Reading: Bitcoin Shows Strength, But Binance Open Interest Divergence Flags Caution
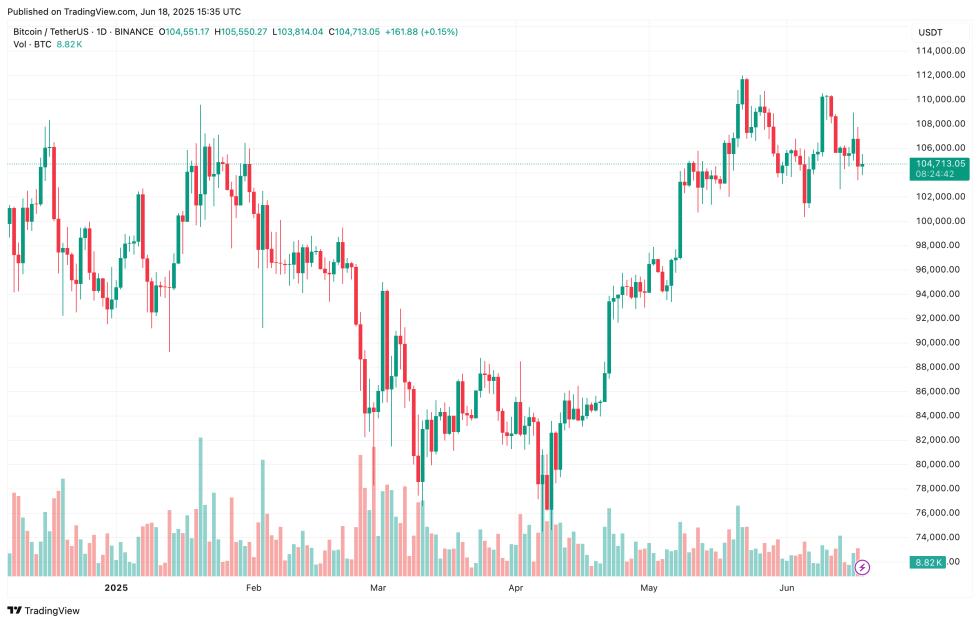
Further, fresh exchange data shows that Bitcoin trading activity has tumbled across all major trading platforms. Notably, BTC trading volumes across leading exchanges recently hit multi-year lows.
Despite this, the Puell Multiple suggests that there may still be some room to grow for BTC price. At press time, BTC trades at $104,713, up 0.4% in the past 24 hours.
Featured Image from Unsplash.com, charts from X and TradingView.com
Editorial Process for bitcoinist is centered on delivering thoroughly researched, accurate, and unbiased content. We uphold strict sourcing standards, and each page undergoes diligent review by our team of top technology experts and seasoned editors. This process ensures the integrity, relevance, and value of our content for our readers.
Search
RECENT PRESS RELEASES
Related Post


