Crypto Today: Bitcoin, Ethereum pare losses as XRP wobbles amid an unstable derivatives ma
June 19, 2025
- Bitcoin stays above critical support, provided by the 50-day EMA, as long and short positions face elevated risk.
- Ethereum’s downside vulnerability constrained by the 200-day EMA support, but gains remain elusive.
- XRP price fails to react to the approval of 3iQ, Purpose and Evolve spot ETFs in Canada.
Price action in the broader cryptocurrency market remains subdued following the Federal Reserve (Fed) decision on Wednesday, which met expectations leaving interest rates unchanged in the range of 4.25% to 4.50%.
Bitcoin (BTC) has stalled below $105,000, signaling prolonged indecision, while Ethereum pares losses around $2,536, holding near critical support. Meanwhile, Ripple’s (XRP) recovery remains elusive despite the approval of spot Exchange Traded Funds (ETFs) in Canada.
The Bitcoin futures contracts’ Open Interest (OI) has maintained an overall downtrend after peaking at $80 billion on May 23, shortly after reaching all-time highs of $111,980. CoinGlass shows the OI, which represents the value of all active futures and options contracts that have yet to be closed or settled, standing at $69 billion on Thursday.
A persistent downtrend in OI indicates a lack of conviction among traders and reduced trading activity. This has the potential to mitigate price increases, especially with liquidations remaining relatively high.
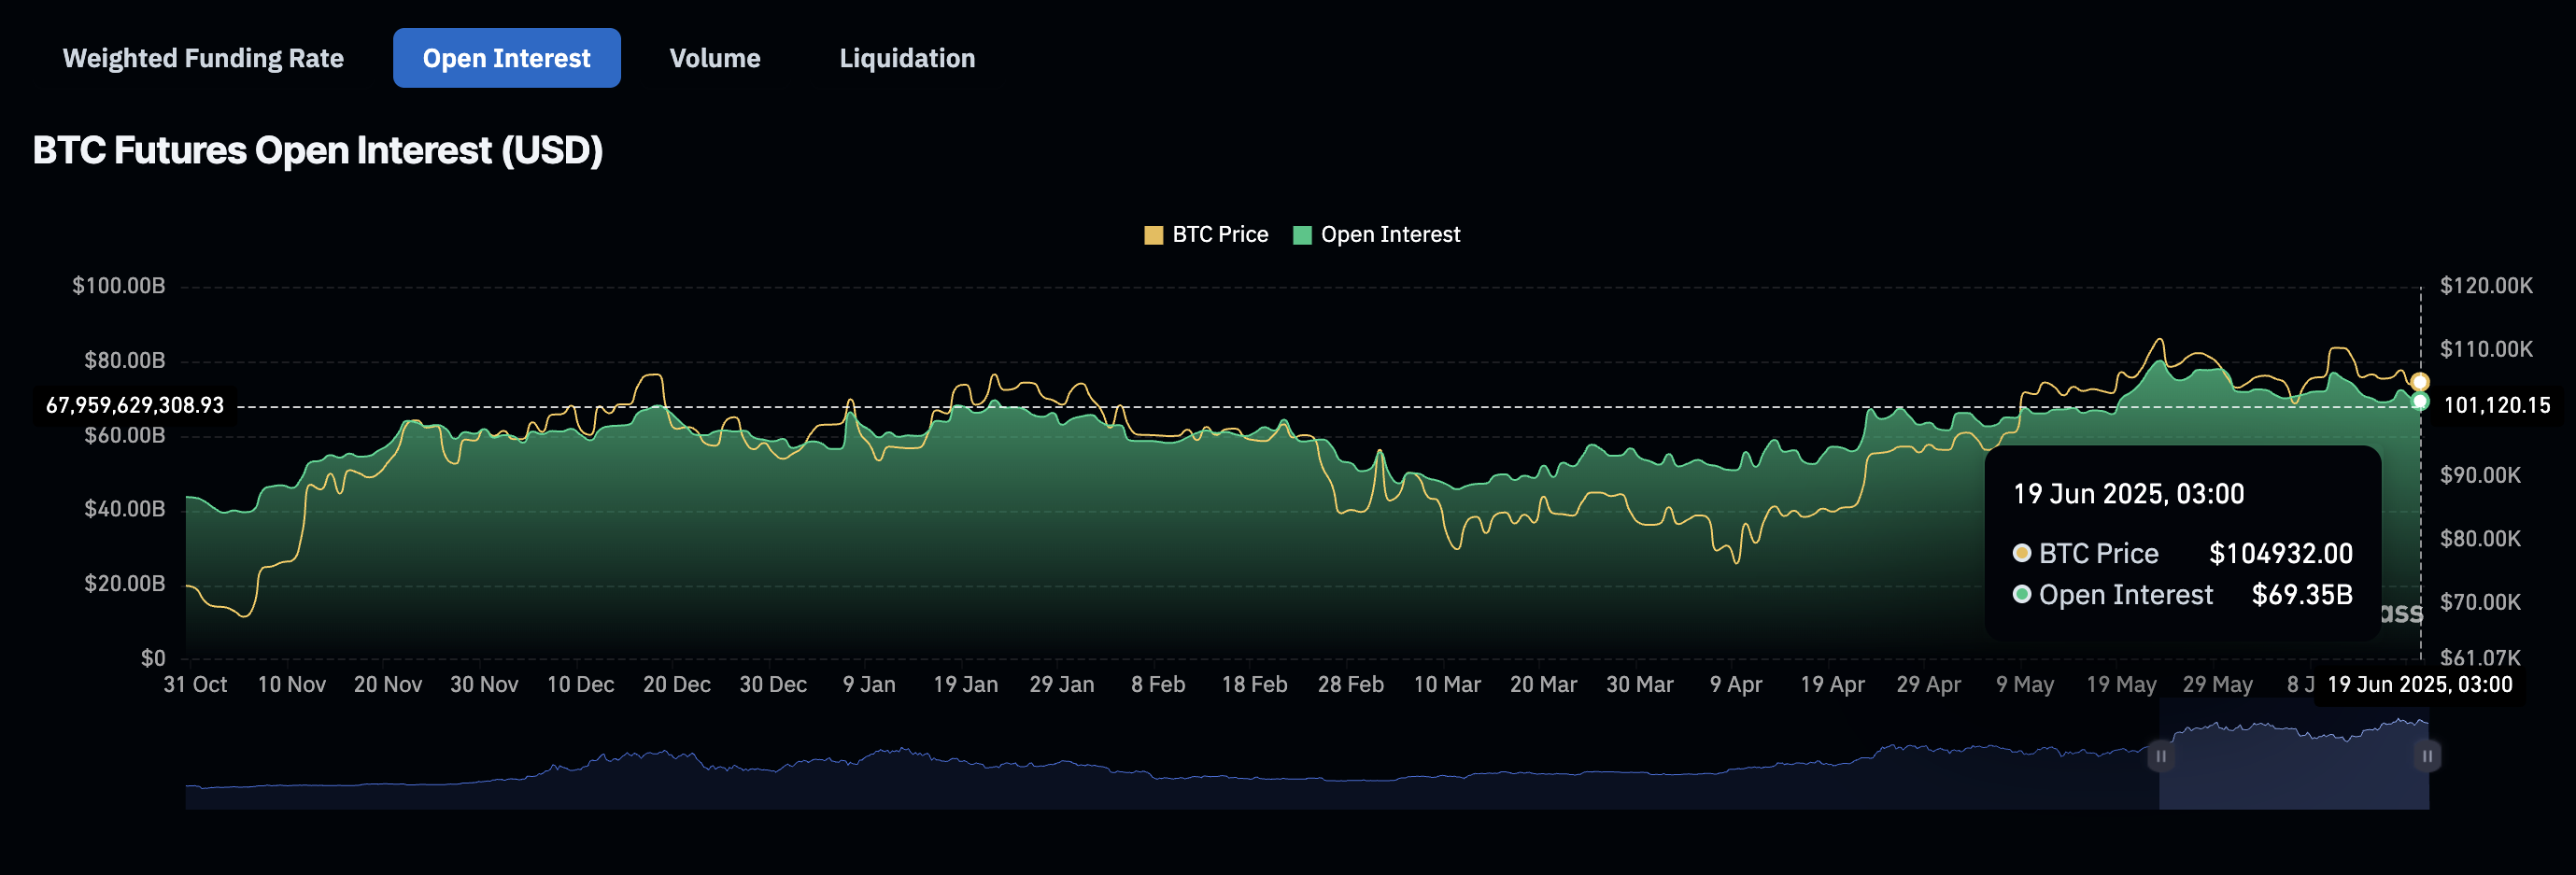
Bitcoin futures OI | Source: CoinGlass
The newly launched CoinGlass Derivatives Risk Index (CDRI) indicator, which measures the intensity of the crypto derivatives market using OI, funding rates, volatility and liquidation volume, shows that the derivatives market is entering an unstable zone. In other words, both long and short positions are facing elevated risk.
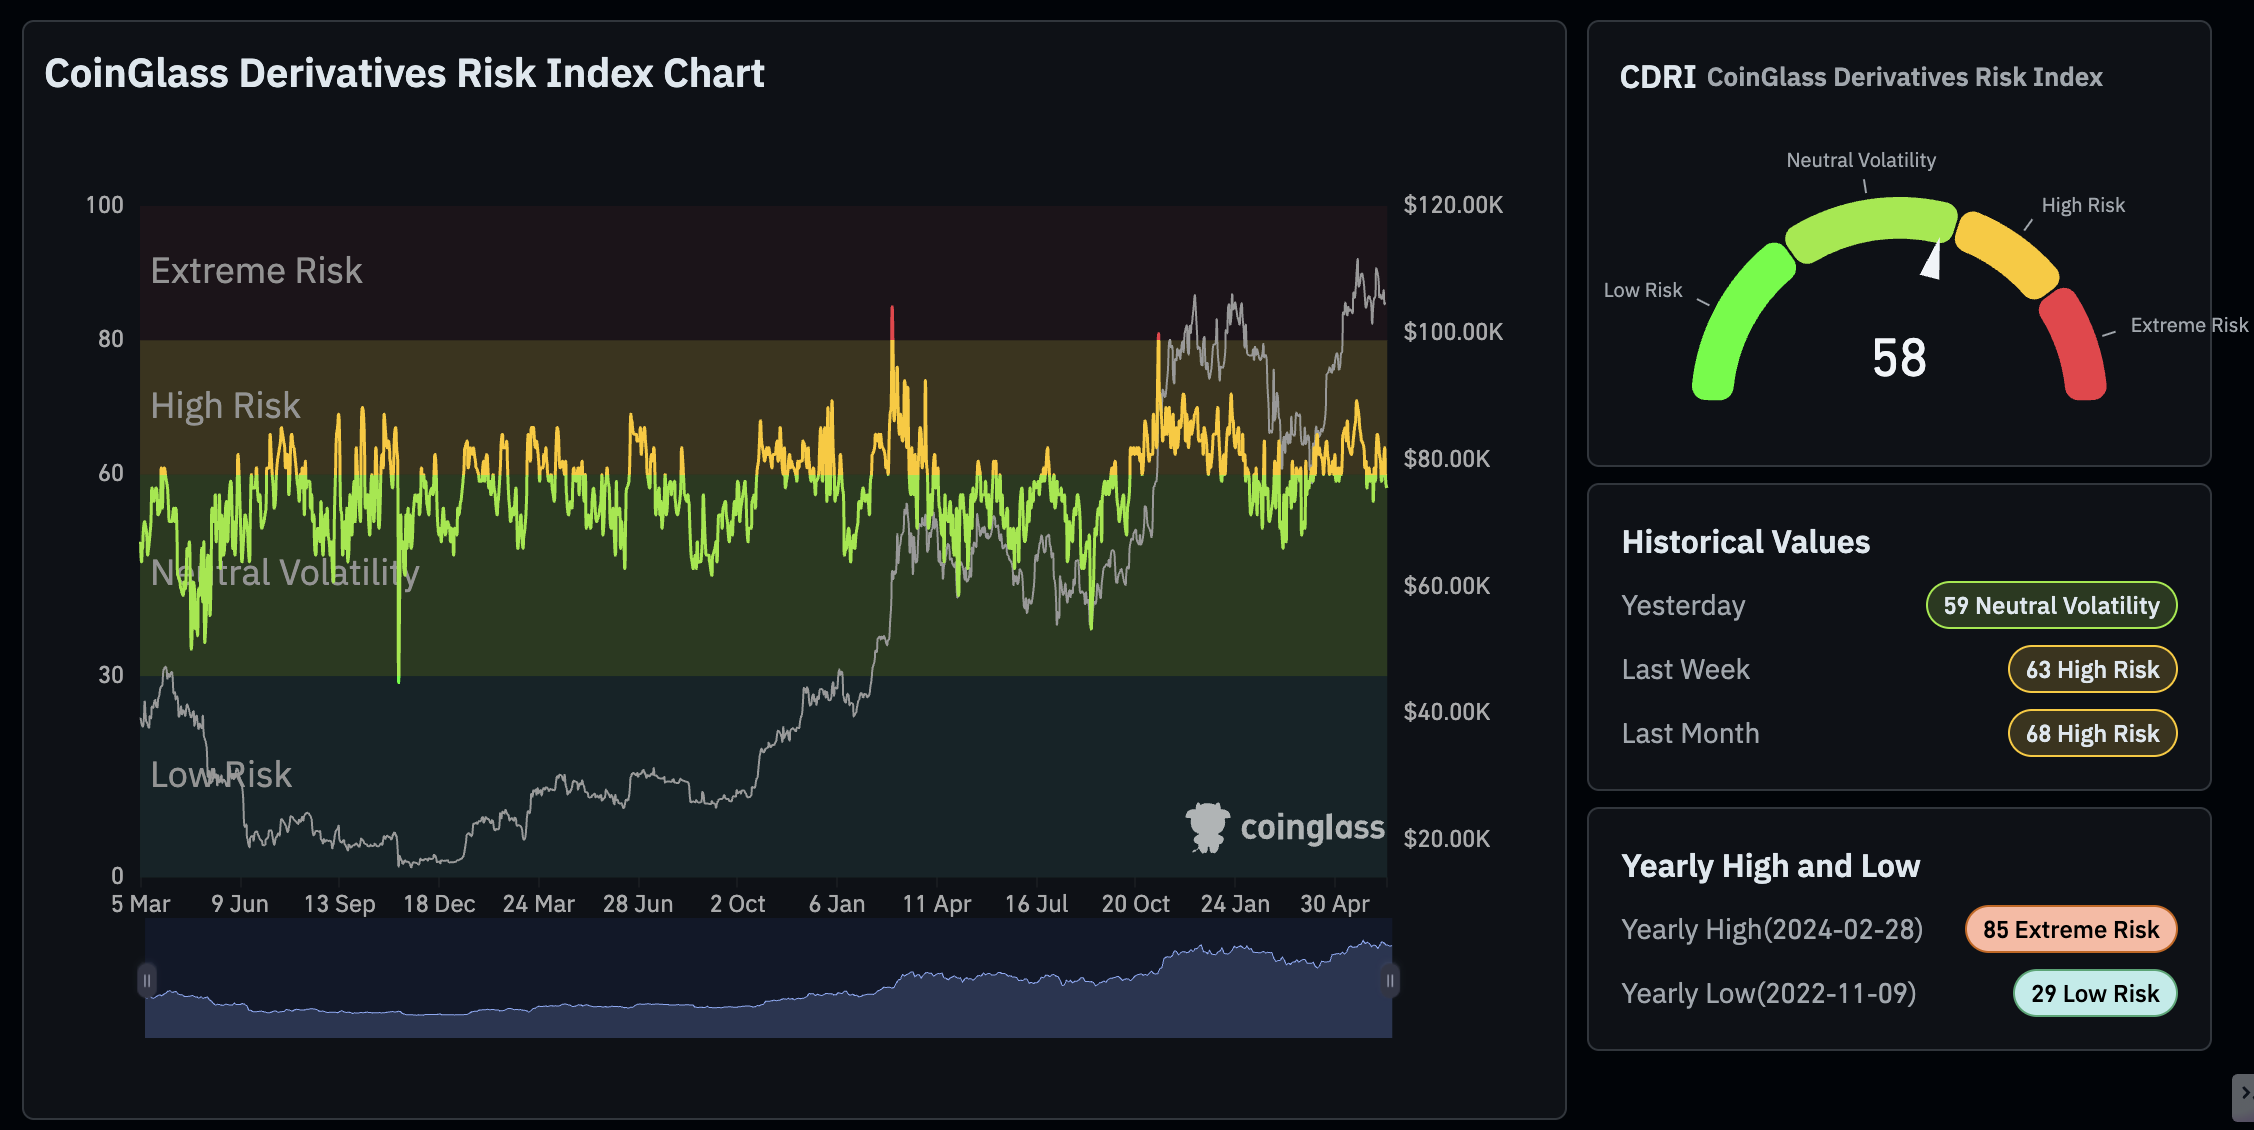
CoinGlass Derivatives Risk Index chart | Source: CoinGlass
Bitcoin spot ETFs attracted daily net inflows of $390 million on Wednesday, signaling interest in the asset as a store of value and a hedge against global market uncertainty amid tensions in the Middle East. BlackRock’s IBIT led with a $279 million inflow, followed by Fidelity’s FBTC with $104 million. Grayscale’s GBTC was the only product in the red with outflows of $16 million.
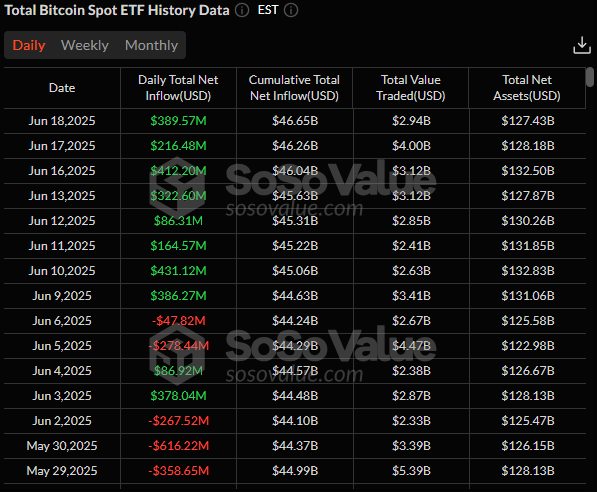
Bitcoin spot ETF stats | Source: SoSoValue
Ethereum spot ETFs experienced their third consecutive day of steady inflows, with $19 million streaming in on Wednesday, compared to $11 million on Tuesday. BlackRock’s ETHA led with $15 million in inflow volume, followed by Grayscale’s ETHE with $4 million in inflow volume.
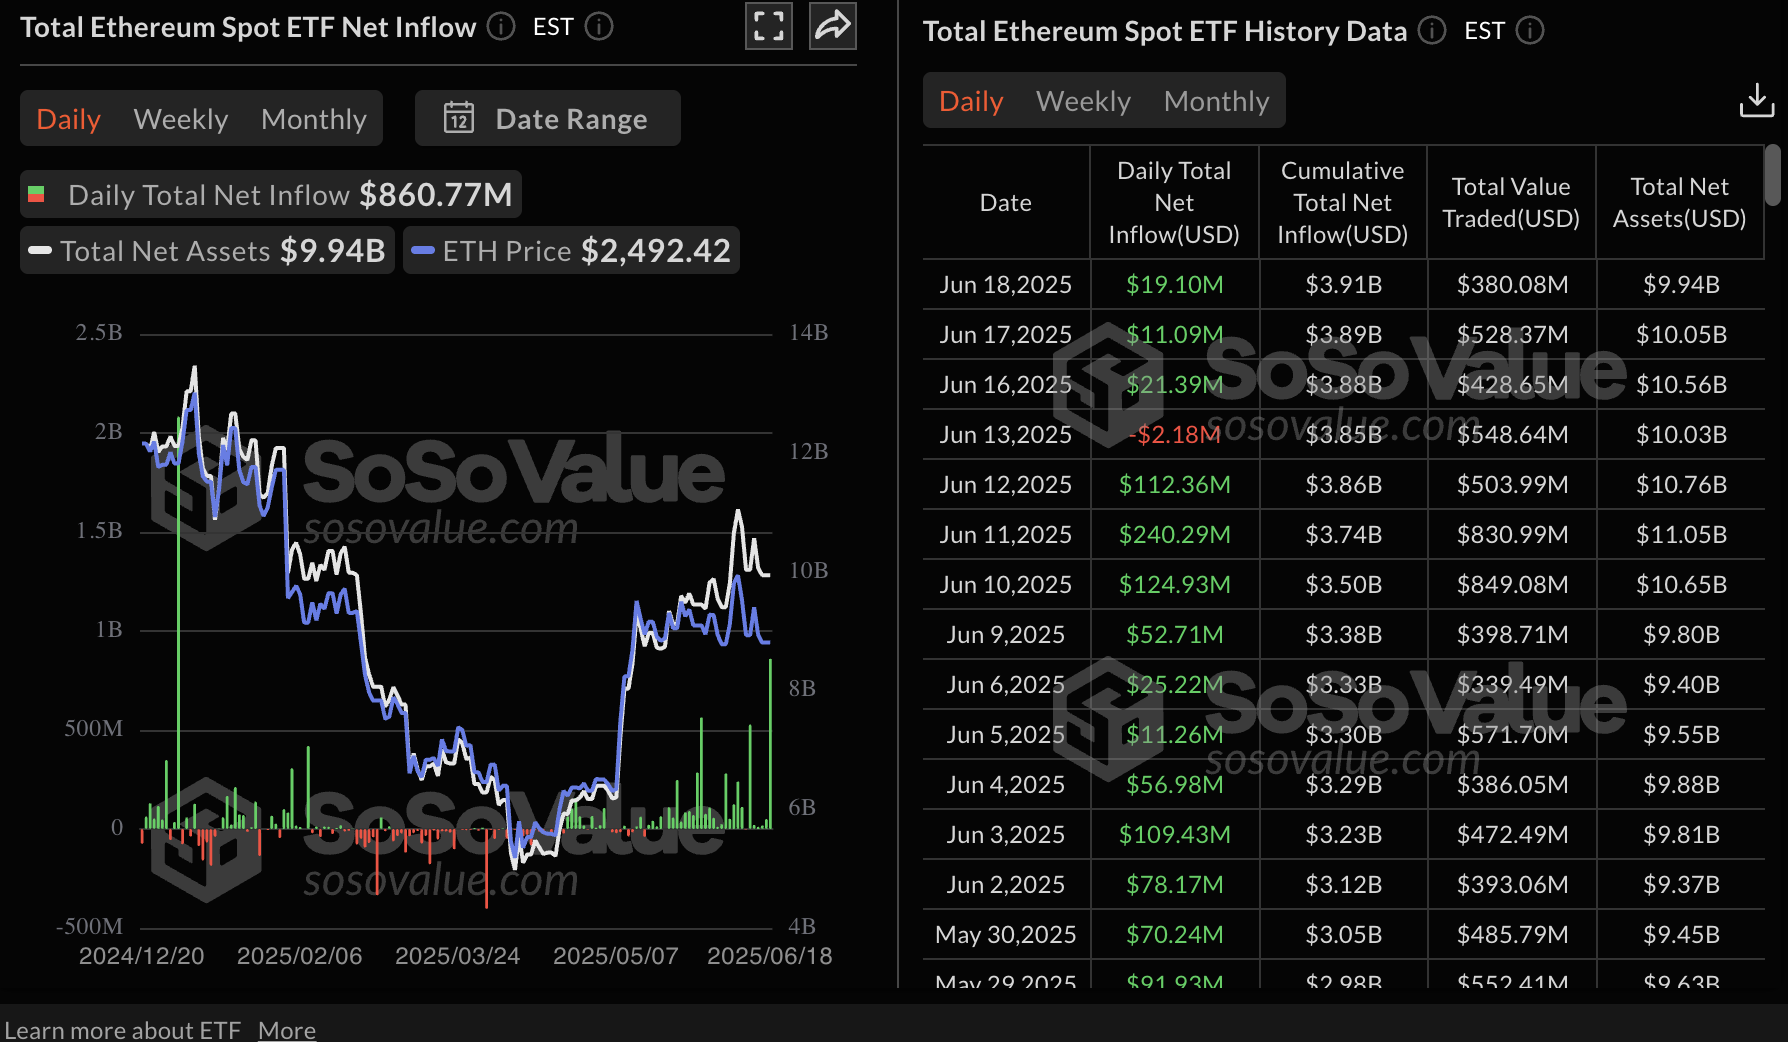
Ethereum spot ETF stats | Source: SoSoValue
Bitcoin’s price remains above a key support level, provided by the 50-day Exponential Moving Average (EMA), at approximately $103,146. Attempts to push to lower areas have left traders liquidated, with CoinGlass data showing $16 million wiped out on Thursday.
The Relative Strength Index (RSI) at 48 offers signs of a potential reversal above the 50 midline as bullish momentum builds.
Key areas of interest are the resistance at $107,000, which capped the BTC price in January and acted as resistance in May as well as $110,000, a psychological round number. On the contrary, beyond the 50-day EMA support, levels traders may want to monitor include the 100-day EMA at $98,991 and the 200-day EMA at $93,301.
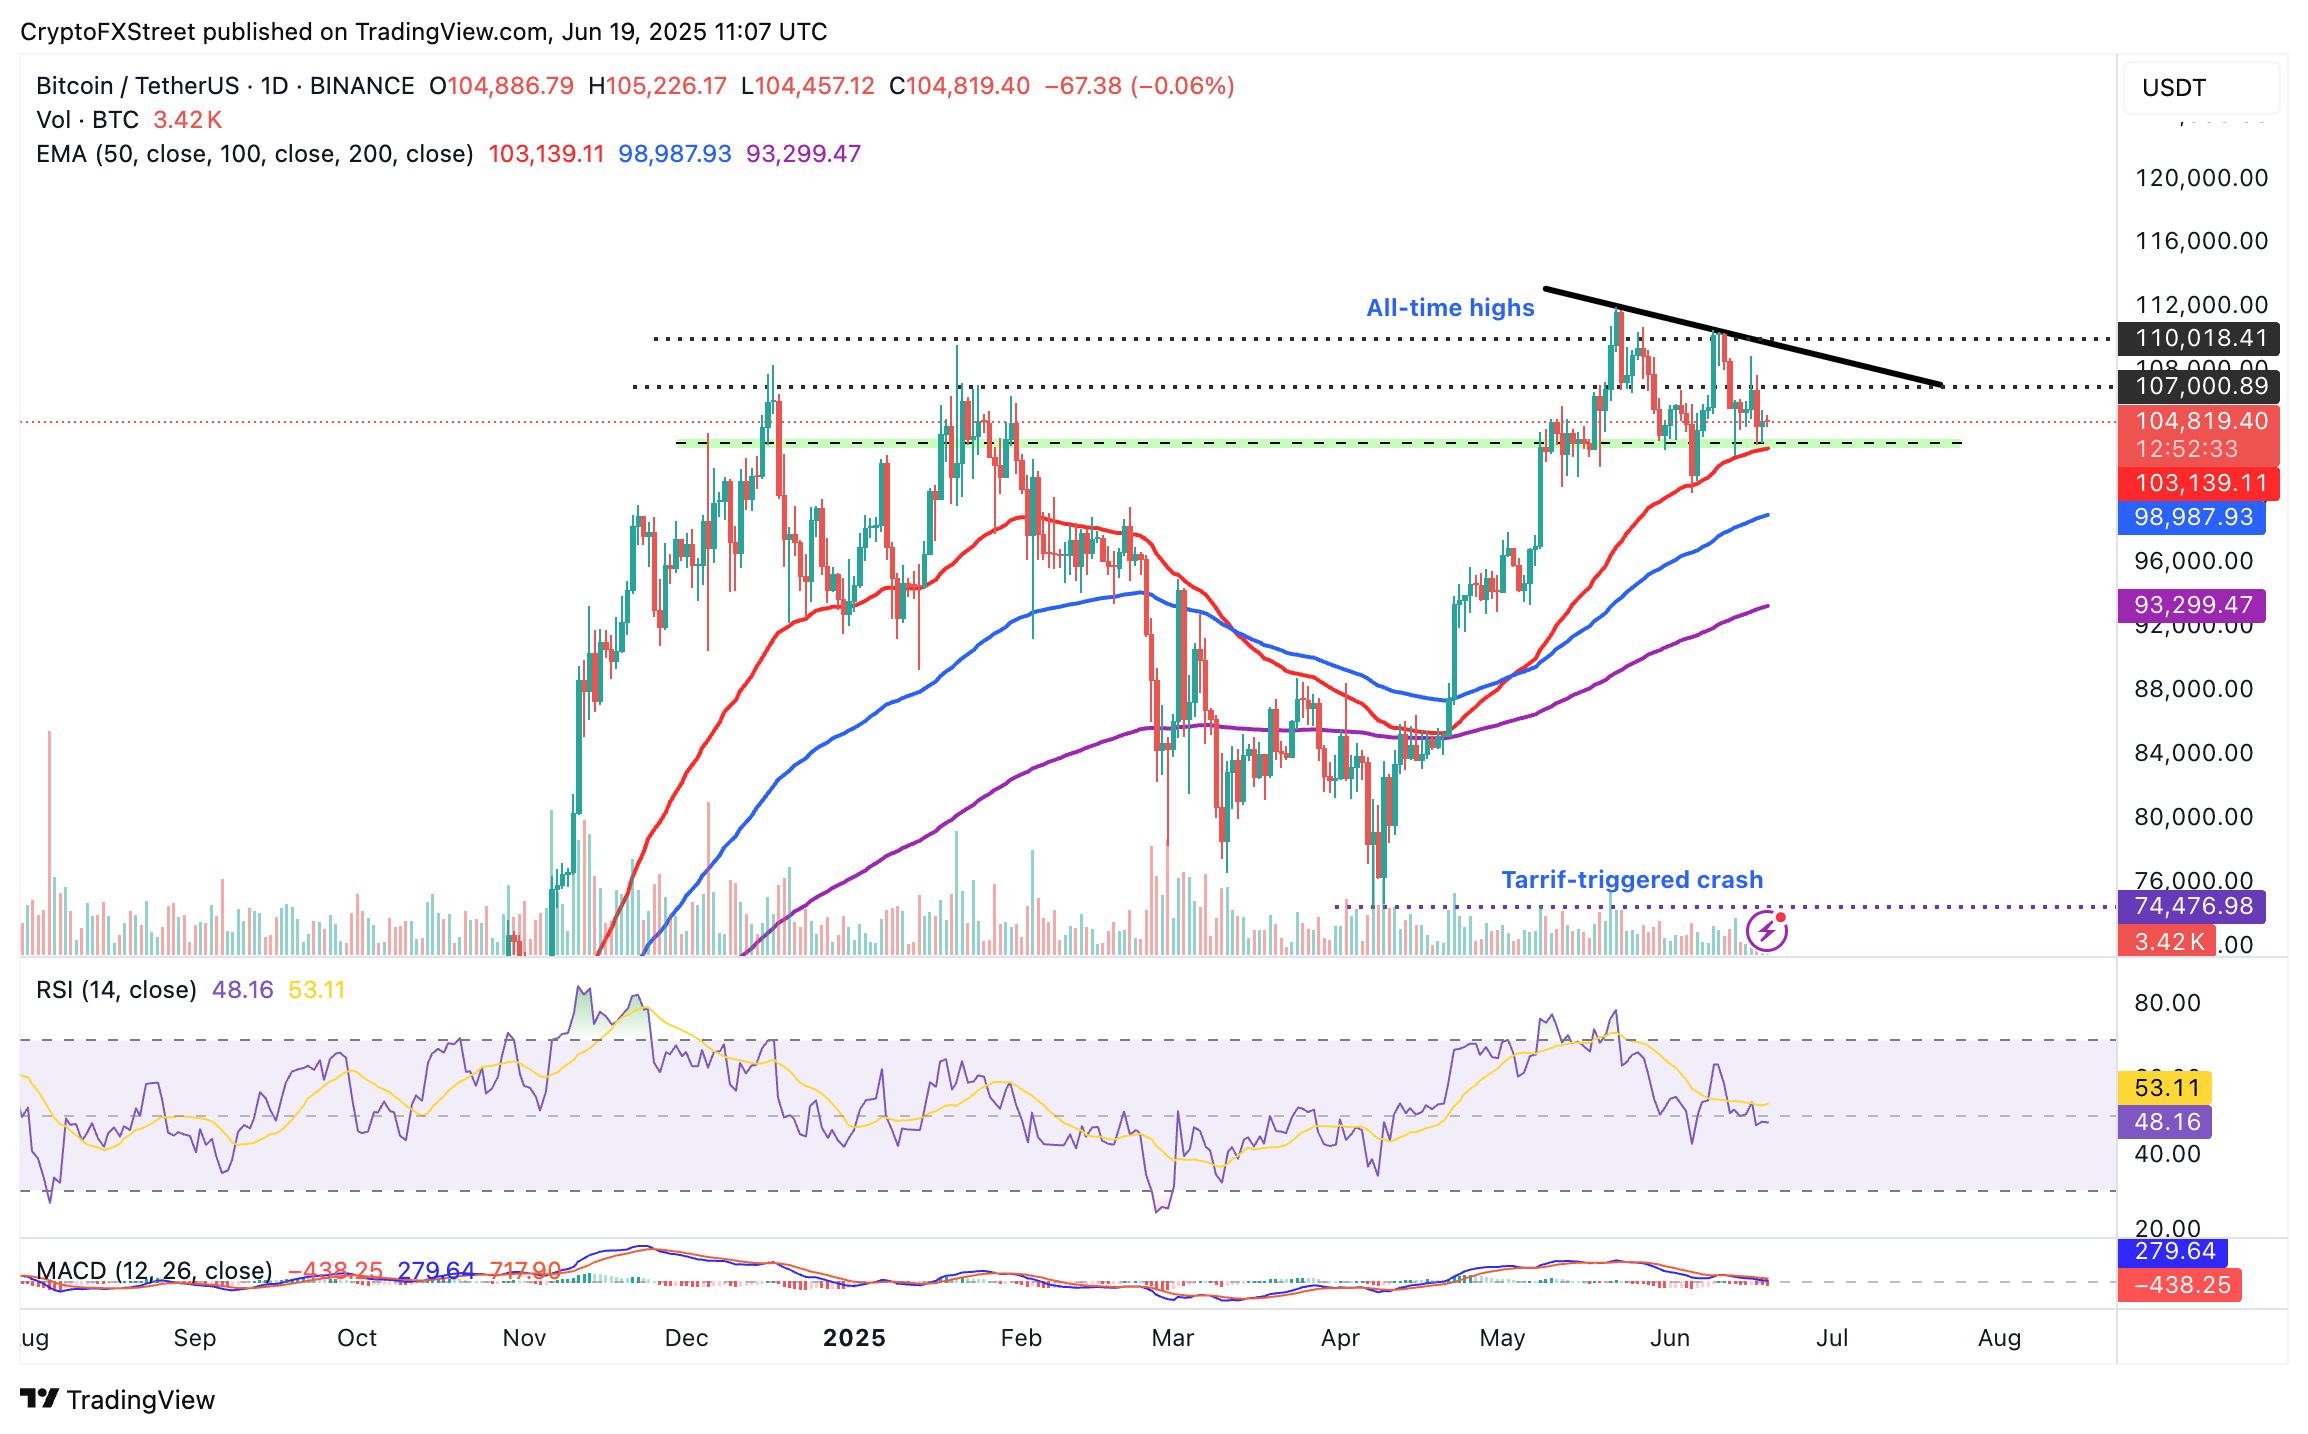
BTC/USDT daily chart
Ethereum’s price holds close to support provided by the 200-day EMA, currently at around $2,476 at the time of writing. Despite the widespread concerns about the conflict in the Middle East between Israel and Iran, recovery signs are still strong, with the RSI returning above the midline.
The path of least resistance could remain upward if the RSI sustains the uptrend. Key levels to watch out for include the recent range resistance at $2,876 and the coveted $3,000 round number. On the other hand, tentative support levels relevant to intraday traders are the 200-day EMA at $2,476, the 50-day EMA at $2,439 and the 100-day EMA at $2,372.
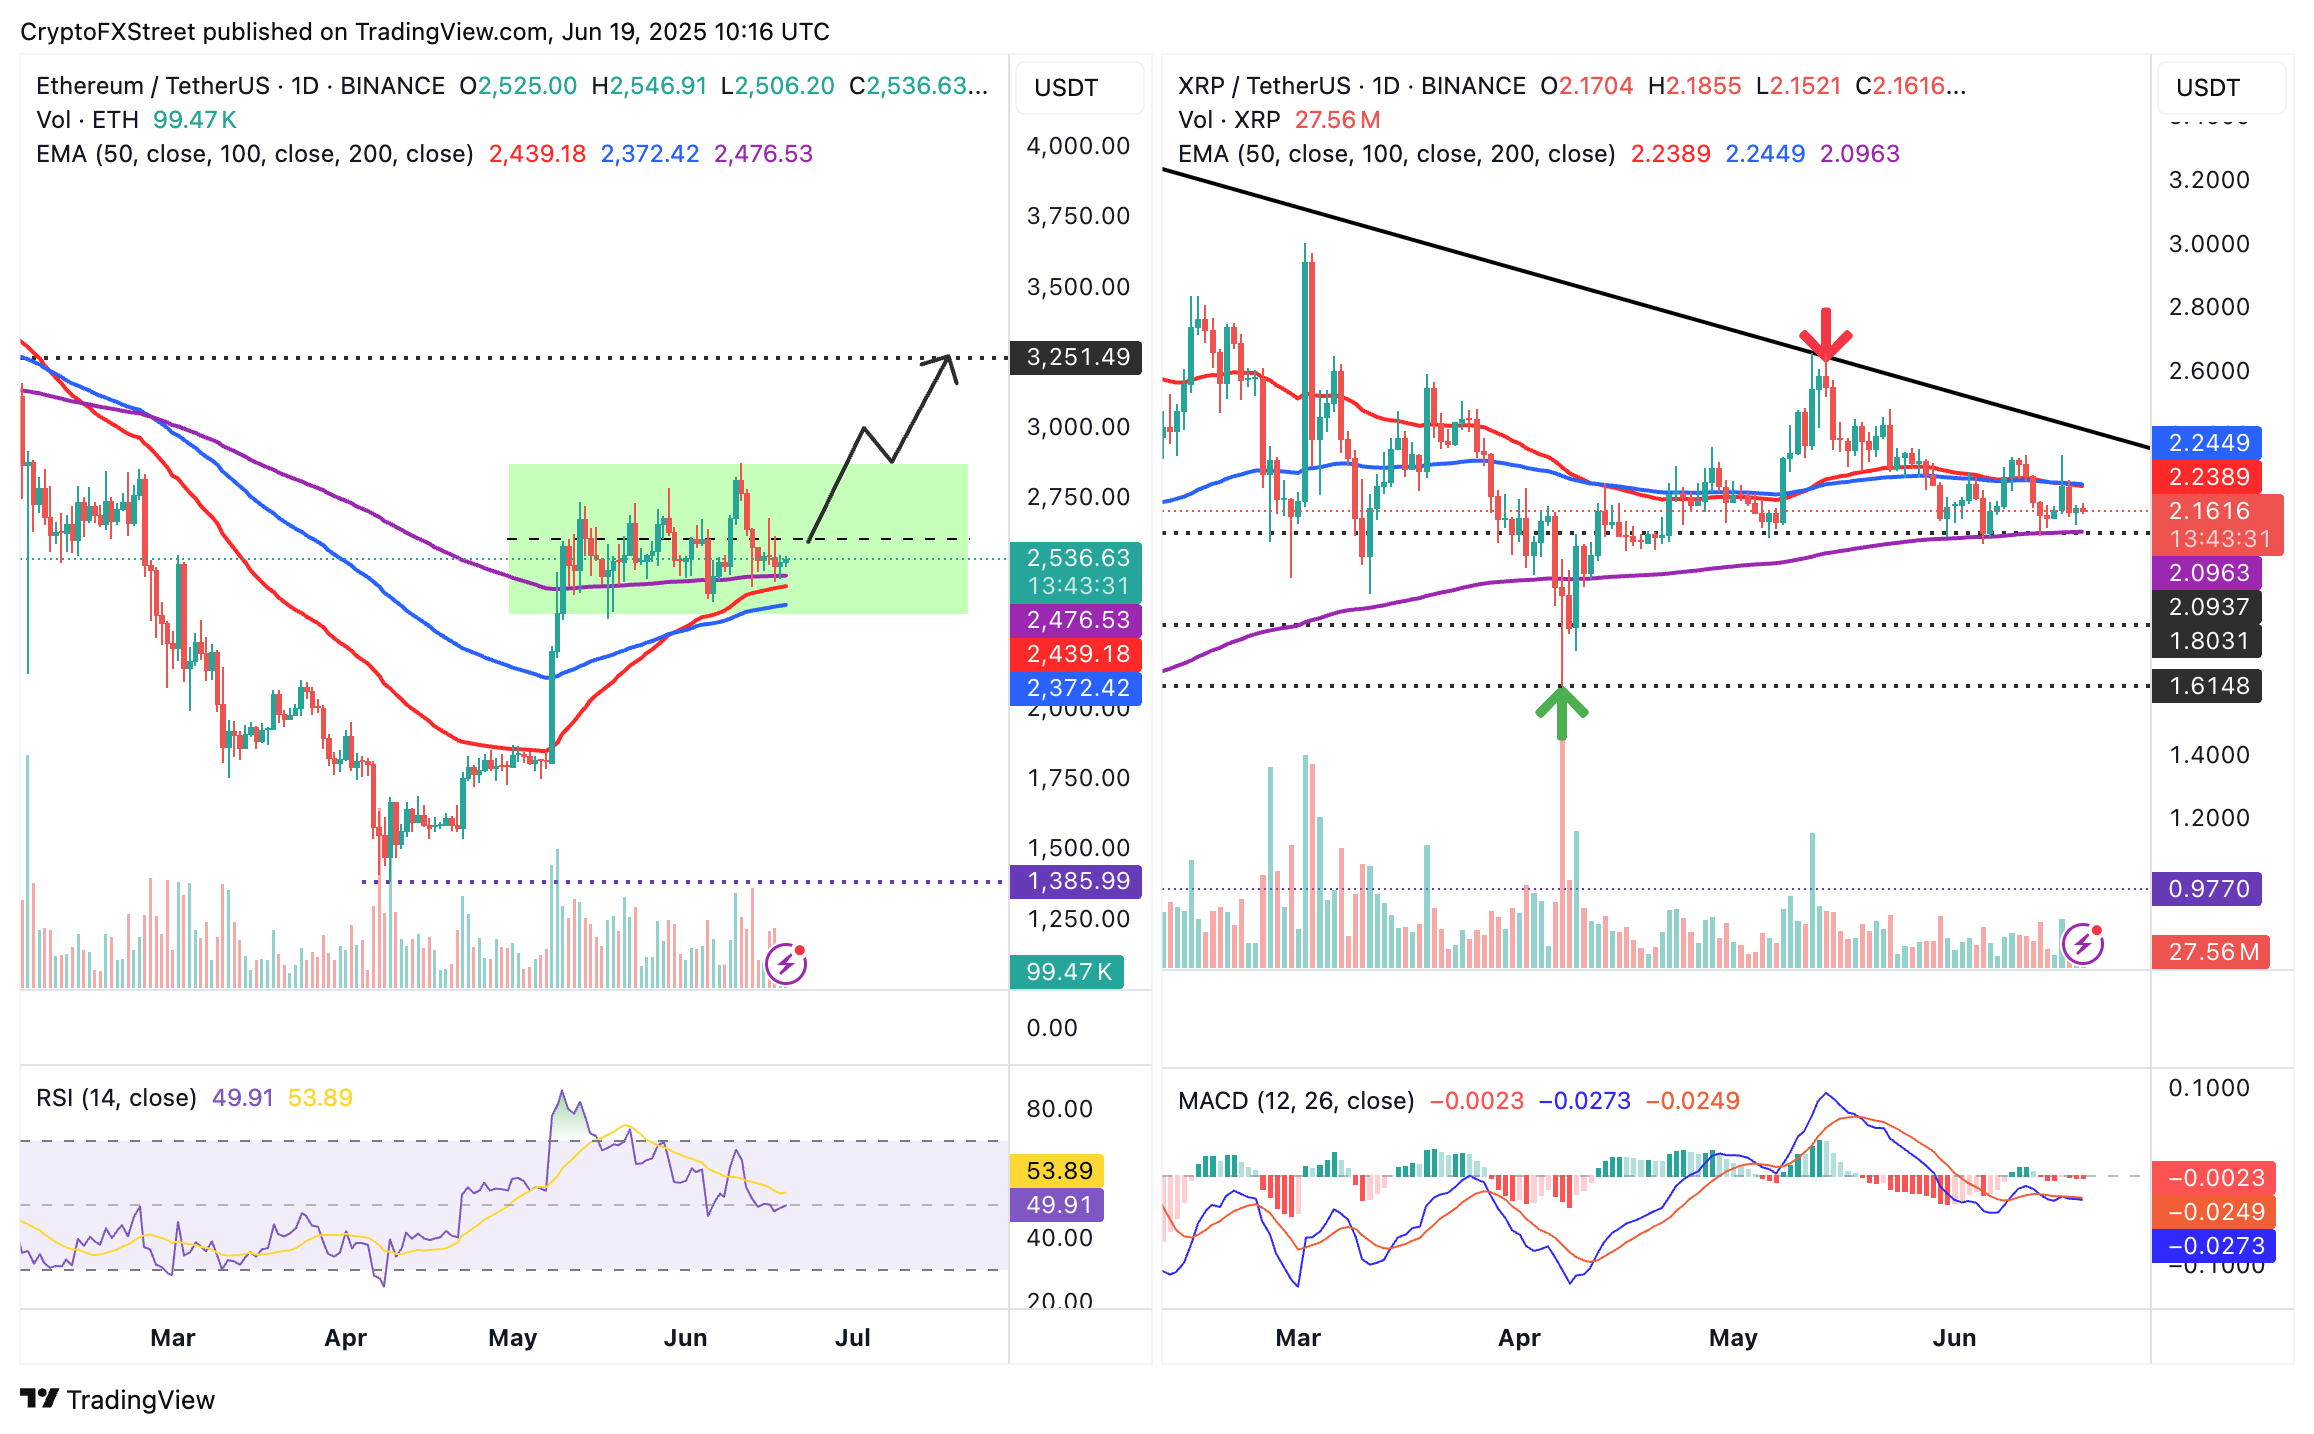
ETH/USDT & XRP/USDT daily charts
Meanwhile, XRP’s price action remains limited below the confluence resistance established by the 50-day EMA and the 100-day EMA at around $2.24, as well as support highlighted by the 200-day EMA at $2.09.
The Moving Average Convergence Divergence (MACD) indicator’s sell signal sustained from Friday suggests a prolonged downtrend if traders reduce their exposure to XRP. Movement on either side of the confluence resistance and the support at $2.09 would determine the direction the price of XRP could take in upcoming sessions.
The lethargic performance exhibited by XRP suggests a lack of interest and conviction in the uptrend despite the Canadian securities regulator’s approval of spot ETF products. Investors in the region now have access to 3iQ, Purpose and Evolve spot ETFs.
Higher Open Interest is associated with higher liquidity and new capital inflow to the market. This is considered the equivalent of increase in efficiency and the ongoing trend continues. When Open Interest decreases, it is considered a sign of liquidation in the market, investors are leaving and the overall demand for an asset is on a decline, fueling a bearish sentiment among investors.
Funding fees bridge the difference between spot prices and prices of futures contracts of an asset by increasing liquidation risks faced by traders. A consistently high and positive funding rate implies there is a bullish sentiment among market participants and there is an expectation of a price hike. A consistently negative funding rate for an asset implies a bearish sentiment, indicating that traders expect the cryptocurrency’s price to fall and a bearish trend reversal is likely to occur.
Information on these pages contains forward-looking statements that involve risks and uncertainties. Markets and instruments profiled on this page are for informational purposes only and should not in any way come across as a recommendation to buy or sell in these assets. You should do your own thorough research before making any investment decisions. FXStreet does not in any way guarantee that this information is free from mistakes, errors, or material misstatements. It also does not guarantee that this information is of a timely nature. Investing in Open Markets involves a great deal of risk, including the loss of all or a portion of your investment, as well as emotional distress. All risks, losses and costs associated with investing, including total loss of principal, are your responsibility. The views and opinions expressed in this article are those of the authors and do not necessarily reflect the official policy or position of FXStreet nor its advertisers. The author will not be held responsible for information that is found at the end of links posted on this page.
If not otherwise explicitly mentioned in the body of the article, at the time of writing, the author has no position in any stock mentioned in this article and no business relationship with any company mentioned. The author has not received compensation for writing this article, other than from FXStreet.
FXStreet and the author do not provide personalized recommendations. The author makes no representations as to the accuracy, completeness, or suitability of this information. FXStreet and the author will not be liable for any errors, omissions or any losses, injuries or damages arising from this information and its display or use. Errors and omissions excepted.
The author and FXStreet are not registered investment advisors and nothing in this article is intended to be investment advice.
Search
RECENT PRESS RELEASES
Related Post


