Ethereum Price Forecast: ETH drops briefly toward $2,400 as Middle East war tension linger
June 20, 2025
- Ethereum recorded a slight selling pressure, with 72,000 ETH exchange inflows on Friday, marking four consecutive days of net inflows totaling 285,000 ETH.
- Despite prices being subdued by Middle East war tensions in the short term, ETH still maintains structural demand beneath the surface.
- ETH eyes a breakout as it approaches the apex of a symmetrical triangle pattern.
Ethereum (ETH) trades around $2,420, down 3% on Friday and on track for another weekend loss, following an increase in selling pressure as Middle East war tensions linger.
With macro uncertainty from the Middle East crisis still looming over the market, Ethereum continued its sideways action on Friday after it saw another round of modest distribution.
ETH recorded 72,000 ETH in exchange net inflows on Friday, marking four consecutive days of net inflows totaling 285,000 ETH. Unlike exchange-traded funds (ETFs), the rise in crypto exchange net inflows signifies dominant selling pressure.
%20-%20All%20Exchanges%20(9)-1750452042592.png)
ETH Exchange Netflows. Source: CryptoQuant
The selling in the spot market was followed by a 720,000 ETH jump in Ethereum’s futures open interest (OI), per Coinglass data. However, prices quickly fell as OI rose, signaling that the new money entering the market potentially flowed toward the opening of short positions. As a result, ETH saw $163 million in liquidations in the past 24 hours. The total amount of long and short liquidations is $140.94 million and $22.42 million, respectively.
The move comes amid White House Press Secretary Caroline Leavitt confirming that President Donald Trump will decide on how to respond to Iran in the next two weeks.
Despite the market slightly tilting toward the downside in the short term, “structural demand remained resilient […] beneath the surface,” noted Binance Research’s Moulik Nagesh in a report on Friday.
Such demand can be seen in the balance on ETH accumulation addresses, which represent wallets with no record of selling activity, rising by a record 5 million ETH since the beginning of June, according to CryptoQuant’s data. Most of the accumulation has potentially flowed toward staking, with total ETH staked rising to a record high of 35.1 million ETH — over 500,000 ETH of that figure was added in the first half of June.
-1750452149543.png)
ETH Balance on Accumulation Addresses. Source: CryptoQuant
Additionally, new weekly addresses on Ethereum have risen to about 800K-1M since mid-May, according to Santiment data.
“Whether the familiar ‘panic-then-recover’ pattern re-emerges will hinge on how quickly the geopolitical narrative cools. For now, relatively modest price declines, stickiness of ETF inflows and the ongoing reduction in ETH’s tradable supply suggest that macro-driven pullbacks are still being treated as opportunities — not signs of a broader directional reversal,” added Nagesh.
Meanwhile, Nasdaq-listed BTCS announced that it purchased an additional 1,000 ETH to its treasury through a loan from the decentralized lending platform Aave. The acquisition has boosted its holdings to 14,600 ETH.
Ethereum is approaching the apex of a symmetrical triangle after a false breakout last week, during which its price briefly moved above $2,850 and then fell back toward the $2,450 level.
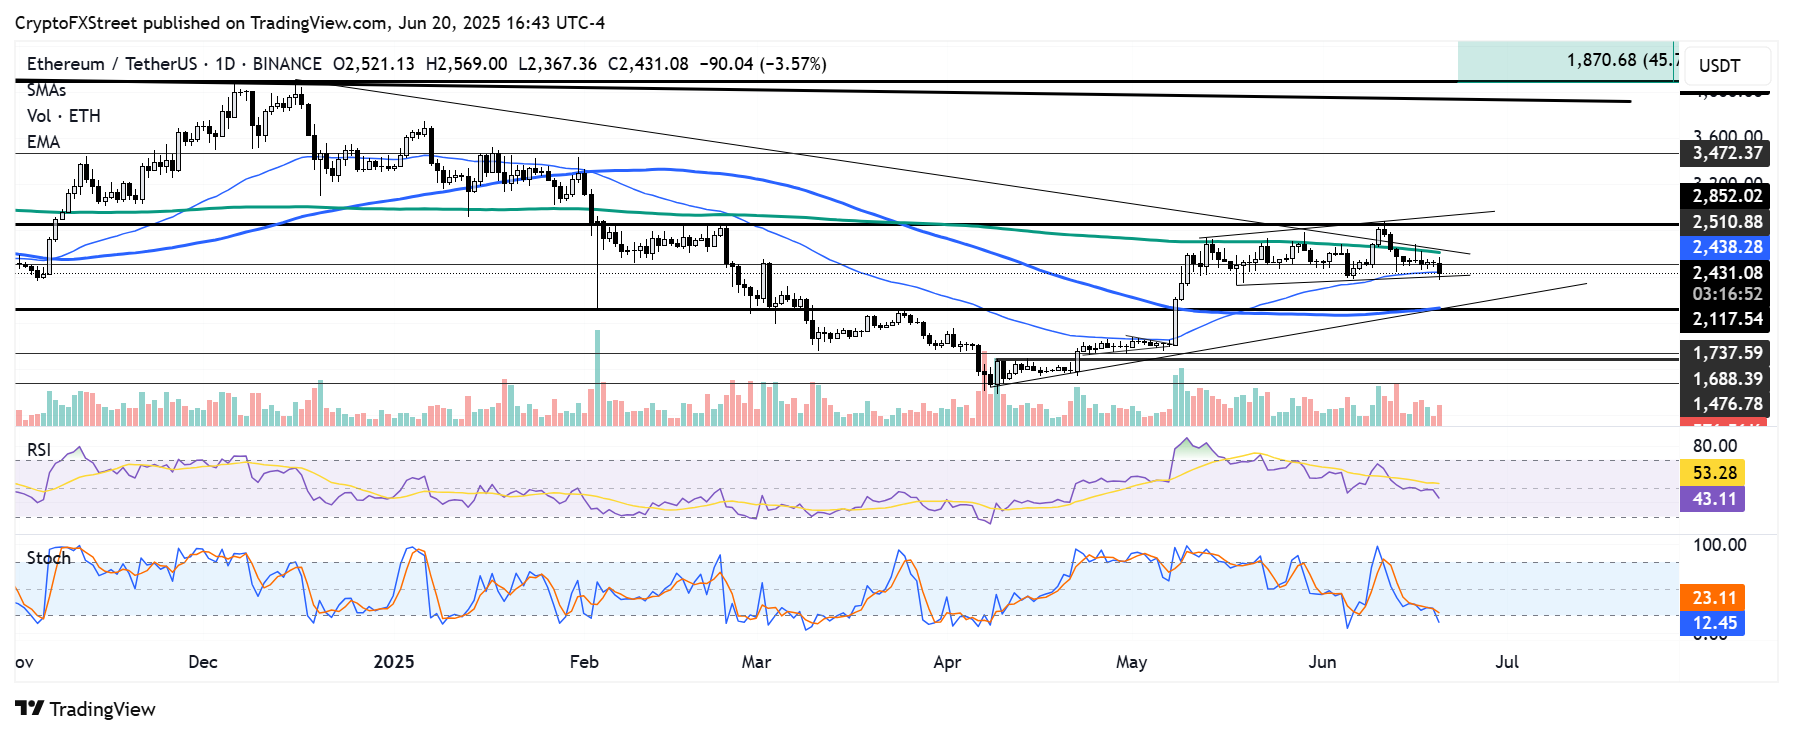
ETH/USDT daily chart
The triangle’s upper boundary is strengthened by the 200-day Simple Moving Average (SMA) — which has proved a critical resistance since May 13 — and the lower boundary is supported by the 50-day Exponential Moving Average (EMA).
A firm breakout on either side could see ETH rise to test the $2,850 key level or decline toward the broader triangle’s support near the 100-day SMA.
The Relative Strength Index (RSI) and Stochastic Oscillator (Stoch) are slightly below their neutral level and oversold region, respectively, indicating a rising bearish momentum.
Information on these pages contains forward-looking statements that involve risks and uncertainties. Markets and instruments profiled on this page are for informational purposes only and should not in any way come across as a recommendation to buy or sell in these assets. You should do your own thorough research before making any investment decisions. FXStreet does not in any way guarantee that this information is free from mistakes, errors, or material misstatements. It also does not guarantee that this information is of a timely nature. Investing in Open Markets involves a great deal of risk, including the loss of all or a portion of your investment, as well as emotional distress. All risks, losses and costs associated with investing, including total loss of principal, are your responsibility. The views and opinions expressed in this article are those of the authors and do not necessarily reflect the official policy or position of FXStreet nor its advertisers. The author will not be held responsible for information that is found at the end of links posted on this page.
If not otherwise explicitly mentioned in the body of the article, at the time of writing, the author has no position in any stock mentioned in this article and no business relationship with any company mentioned. The author has not received compensation for writing this article, other than from FXStreet.
FXStreet and the author do not provide personalized recommendations. The author makes no representations as to the accuracy, completeness, or suitability of this information. FXStreet and the author will not be liable for any errors, omissions or any losses, injuries or damages arising from this information and its display or use. Errors and omissions excepted.
The author and FXStreet are not registered investment advisors and nothing in this article is intended to be investment advice.
Search
RECENT PRESS RELEASES
Related Post


