Seasonal variations in ecological environment quality across different geomorphological re
July 21, 2025
Abstract
Understanding seasonal variations in ecological environment quality (EEQ) across diverse geomorphological regions is essential for accurately assessing ecosystem health and resilience amid climate change. However, systematic quantitative studies examining these fluctuations and their underlying climate response mechanisms remain scarce, particularly in regions with complex terrain. This study focused on Shaanxi Province, known for its diverse landforms and complex climate. Using the Google Earth Engine (GEE) platform, we systematically analyzed the spatiotemporal variations in EEQ across six geomorphic regions from 2002 to 2022. This analysis integrated the Remote Sensing Ecological Index (RSEI) with climatic factors to explore the region’s response mechanisms to climate change. The results revealed the following: (1) EEQ exhibited significant regional variation, with the Daba and Qinling Mountain regions recording the highest annual average RSEI (> 0.6) and the wind-sand transition zone the lowest (< 0.25). The Guanzhong Plain, marked by intense human activity, uniquely displayed fluctuating degradation. (2) Single-season RSEI evaluations (e.g., summer) tended to overestimate EEQ in arid regions and underestimate degradation risks in humid regions. Averaging RSEI across all four seasons provided a more accurate depiction of interannual ecosystem stability. (3) EEQ responses to climate change vary significantly across regions due to the constraints imposed by water-heat balance and geomorphological characteristics. Precipitation plays a dominant role in influencing EEQ in arid regions such as the Loess Plateau, whereas temperature exerts a more significant effect in humid regions like the Daba Mountains. Human activities, particularly in the Guanzhong Plain, markedly reduce climate sensitivity, highlighting the complex interplay between natural and anthropogenic drivers. Employing an innovative “seasonal fluctuation–geomorphological heterogeneity-climate response� framework, this study reveals biases in traditional single-season assessments and delivers scientific evidence for tailored ecological restoration and climate adaptation strategies.
Introduction
Global climate change significantly alters the structure and function of ecosystems, producing distinct spatiotemporal effects in regions with geomorphic heterogeneity1,2,3. Ecosystems, such as mountains, plains, and basins, show considerable variations in vulnerability and resilience in response to seasonal climate fluctuations 4,5, yet the underlying spatiotemporal drivers remain underexplored. Shaanxi Province, situated at the climate transition zone between northern and southern China and marked by geomorphic diversity, features a distinct stepped distribution of ecological landscapes. These include, from north to south, the wind-sand transition zone, Loess Plateau, Guanzhong Plain, Qinba Mountains, and Hanjiang Basin6. The region’s complex topography and water-heat coupling conditions shape its ecosystems’ varying vulnerability and resilience, thus influencing their response to climate change7. This area serves not only as a core component of national ecological security barriers—such as the northern sand prevention zone and the Loess Plateau soil and water conservation area—but also as a crucial support zone for high-quality socioeconomic development8. In the face of rapid urbanization and climate change, the ecological quality of this region exhibits significant spatiotemporal variation, necessitating the identification of seasonal fluctuation patterns and climate drivers to inform sustainable development decisions.
Seasonal variations significantly influence ecosystem services by regulating water and heat resources, as summer precipitation drives vegetation growth while winter droughts heighten vulnerability9,10,11. Within the context of climate change, research highlights distinct ecological sensitivities across regions12,13,14. In arid ecosystems, such as those on the Loess Plateau, vegetation recovery and ecosystem stability are highly sensitive to precipitation fluctuations15, aligning with the “water limitation hypothesis�, where even slight rainfall changes can trigger substantial impacts. In contrast, humid regions exhibit stronger responses to shifts in temperature and solar radiation, which play a dominant role in shaping vegetation dynamics16. These contrasting patterns emphasize the need to consider the complex interplay between water and heat resources and geomorphic features when evaluating ecological responses across diverse landscapes.
Recently, the Remote Sensing Ecological Index (RSEI)17, an essential tool for comprehensive EEQ assessment, has been widely used in multi-scale ecological monitoring and evaluation18,19,20. By integrating various remote sensing data, RSEI effectively reflects the spatial distribution of ecological factors such as vegetation cover, soil moisture, and water body changes, making it a key indicator for assessing ecological quality21. Previous studies have demonstrated a linear relationship between climate factors (e.g., precipitation and temperature) and vegetation cover and have validated the positive effects of ecological restoration projects on RSEI in typical geomorphic regions like the Loess Plateau22,23. However, existing studies have notable limitations: First, most research focuses on interannual or multi-year changes, often relying on data from a single season (e.g., summer), which overlooks the systematic biases in interannual ecological quality representations caused by seasonal fluctuations24,25. For example, a brief peak in vegetation cover during summer may obscure the ecological degradation risks during winter and spring, and an assessment framework relying solely on summer data cannot fully capture the seasonal vulnerability and threshold changes of ecosystems. Seasonal changes notably impact ecological indicators such as vegetation cover and soil moisture, particularly in climate-sensitive regions26,27. These impacts on regional ecological environments require more comprehensive investigation through the synergistic analysis of multi-seasonal data. Additionally, existing models often simplify “geomorphic units� into homogeneous spaces28,29,30, neglecting the regulatory role of geomorphic heterogeneity in climate response mechanisms of ecosystems, which results in a partial and limited understanding of climate impact mechanisms.
To address the aforementioned limitations, this study developed an integrated analytical framework—“seasonal fluctuation–geomorphological heterogeneity–climate response�—to systematically investigate the spatiotemporal dynamics of EEQ and its responses to climate change from 2002 to 2022. The research aimed to achieve three main objectives: (1) to identify the seasonal fluctuation patterns and spatial heterogeneity of EEQ across different geomorphic units; (2) to analyze the ecological response pathways under the combined influence of water-heat conditions and geomorphological constraints; (3) to evaluate the limitations of using single-season data for ecological assessments and propose a multi-season integrated analysis framework. Through an in-depth exploration of spatiotemporal variation, this study provides new insights into the impacts of seasonal and climate changes on ecological environments across diverse geomorphic regions, offering valuable theoretical foundations and practical guidance for environmental protection, climate adaptation, and sustainable development planning.
Materials and methods
Study area
Shaanxi Province (Fig. 1) is located in central China, with geographic coordinates ranging from 105° 29′ E to 111° 15′ E and 31° 42′ N to 39° 35′ N, covering an area of approximately 20.57 million square kilometers31. The province’s unique geomorphology is divided into six major regions from north to south: the wind-sand transition zone (I), Loess Plateau (II), Guanzhong Plain (III), Qinling Mountains (IV), Hanjiang Basin (V), and Daba Mountains (VI), showcasing a rich diversity of landforms. This varied geomorphic structure leads to a gradual climate transition from north to south, shifting from temperate to warm temperate and then to the northern subtropical zone. Annual precipitation increases significantly from north to south, ranging from 340 to 1240 mm, while the average annual temperature fluctuates between 7 and 16 °C32. Vegetation types also transition from desert grasslands in the north to broadleaf forests in the south, reflecting a clear ecological gradient. The spatial heterogeneity of both geomorphology and climate provides an ideal setting for studying seasonal changes in EEQ. Seasonal ecological changes, defined as shifts in vegetation, soil moisture, and ecosystem stability driven by climatic variations, are particularly critical in Shaanxi’s diverse landforms due to their impact on ecological vulnerability and resilience. Additionally, as an important energy base and ecological functional region, Shaanxi faces considerable environmental pressures and climate change challenges. The ecological vulnerability resulting from geomorphic differentiation and varying human activity intensities makes Shaanxi a key case for exploring seasonal changes in EEQ and their response mechanisms to climate change across different geomorphic regions.
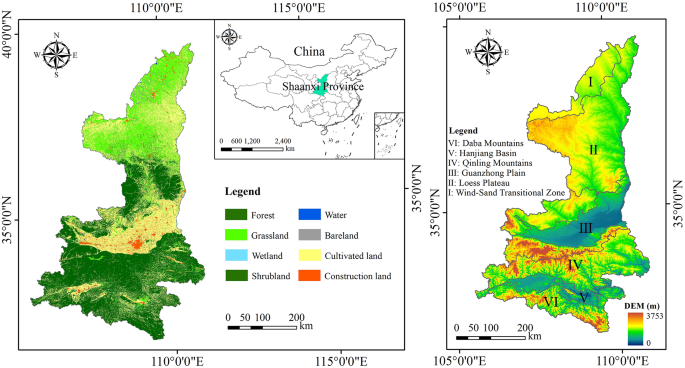
The locations of the study areas. The map was generated by geospatial analysis of ArcGIS software (version ArcGIS 10.3; http://www.esri.com/software/arcgis/arcgis-for-desktop).
Data
This study utilized the MOD09A1, MOD11A2, and MOD13A1 datasets from 2002 to 2022, each containing 504 images, to compute the four components of RSEI: Wetness (WET), Normalized Difference Bare Soil Index (NDBSI), Land Surface Temperature (LST), and Normalized Difference Vegetation Index (NDVI). Specifically, MOD09A1 was used to calculate WET and NDBSI, MOD11A2 for LST, and MOD13A1 for NDVI. To enhance the accuracy of RSEI estimation, all images were processed on the GEE platform33 using maximum value compositing and cloud masking, and water bodies were masked using the Modified Normalized Difference Water Index (MNDWI) before computing each component. For climate variables, we employed 1 km resolution monthly temperature and precipitation datasets from Peng Shouzhang’s research team34,35,36,37, with 252 images per dataset, to calculate annual average temperature and precipitation. These datasets were derived through downscaling of CRU TS data and have been rigorously validated across China, including Shaanxi Province, confirming their reliability for the study area38,39. Additionally, administrative boundary data from the Resource and Environmental Science Data Platform was used to accurately delineate the geomorphic units within the study area. Temperature and precipitation rasters were resampled to 500 m resolution via bilinear interpolation40, and all datasets were processed at this scale to ensure analytical consistency and reliability. For analyses of EEQ responses to climate change, EEQ was defined by seasonal mean RSEI values, temperature by annual mean monthly temperatures, and precipitation by total annual rainfall. All datasets were temporally aligned at the interannual scale to ensure synchrony across variables. Detailed data information is provided in Table 1.
Methodologies
Figure 2 outlines the process for analyzing seasonal variations in EEQ and its response to climate change across different geomorphic regions of Shaanxi Province. This includes: (1) examining seasonal fluctuations in EEQ; (2) assessing geomorphic heterogeneity in EEQ across different seasons; and (3) investigating the spatiotemporal characteristics of seasonal average EEQ and its response to climate change.
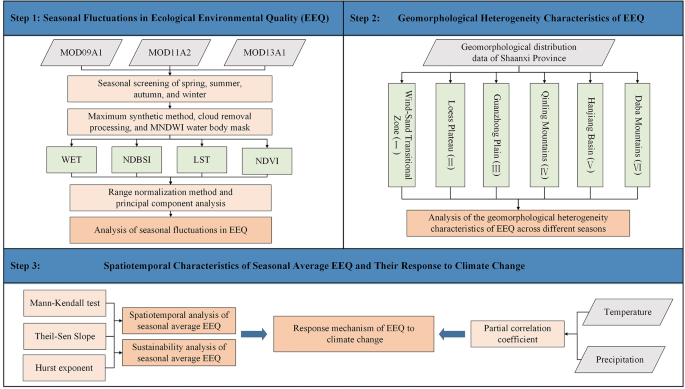
Technology roadmap.
Estimation process of RSEI
The RSEI17 is a comprehensive metric based on remote sensing technology, designed to assess and monitor EEQ. RSEI comprises four key components: NDVI, WET, LST, and NDBSI. By integrating multiple ecological factors, this index minimizes errors from subjective judgment, thereby enhancing the objectivity and accuracy of ecological quality assessments. The specific calculation methods for these indices are as follows:
In the equation, (rho_Red), (rho_Green), (rho_Blue), (rho_NIR), (rho_SWIR1) and (rho_SWIR2) represent the reflectance values of MODIS images in the red, green, blue, near-infrared, short-wave infrared 1, and short-wave infrared 2 bands, respectively, while (DN_S) denotes the grayscale value of the image. Additionally, SI and IBI represent the soil index and the built-up index, respectively. Raster values for each component were generated programmatically on the GEE platform using their respective calculation algorithms.
Due to differences in calculation standards for each index, this study applied a range normalization method to standardize the data41. Subsequently, Principal Component Analysis (PCA) was used to conduct a comprehensive analysis of the standardized data and constructed the RSEI. Higher RSEI values correspond to better EEQ. Based on RSEI classification standards42, EEQ was categorized into five levels: worst (0–0.2), poor (0.2–0.4), moderate (0.4–0.6), good (0.6–0.8), and excellent (0.8–1).
Mann–Kendall trend test
The Mann–Kendall trend test is a quantitative, non-parametric statistical method commonly used to assess the significance of trends in time series data43. It is particularly advantageous for ecological studies due to its robustness to outliers and missing values, which may occur in long-term remote sensing datasets. The calculation formula is as follows:
Theil–Sen slope estimation method
The Theil–Sen slope estimation44 complements the Mann–Kendall test by providing a robust, non-parametric estimate of trend magnitude. It is effective for time series with missing data or uneven distributions, as it calculates the median slope across all pairs of data points. The calculation formula is as follows:
where, (textIndex_i) and (textIndex_j) represent the indicator values at the (i)-th and (j)-th time points in the sequence, while (textMedian) refers to the median function. The sign of the (textSen) value indicates the direction of the trend, and its absolute value reflects the intensity of the change. Larger absolute values of (textSen) correspond to more significant changes, whereas smaller values suggest more gradual shifts. By combining the Mann–Kendall trend test with the Theil–Sen slope analysis, the significance of changes in EEQ can be thoroughly assessed (Table 2). Based on literature precedents45, sensitivity analyses, and regional calibration, the Sen’s slope threshold was defined as ± 5 × 10�4.
Correlation analysis
Correlation analysis is employed to examine the strength and direction of relationships between different variables46. This pixel-based approach ensures that every pixel within the study area is analyzed, eliminating the need for sample selection. To isolate the effect of one climatic factor, the other was controlled: for instance, when examining the relationship between RSEI and precipitation, temperature was held constant, and vice versa. The formula for the correlation coefficient is as follows:
where, (overlinex) and (overliney) represent the average values of the two variables over (n) years, (R_xy) is the simple correlation coefficient between the two variables, and (n) is the sample size.
where, (R_xy,z) represents the partial correlation coefficient between the dependent variable (x) and the independent variable (y), while controlling for the independent variable (z).
To assess the significance of the partial correlation coefficient, a (t)-test was applied. The calculation formula is as follows:
where, (n) denotes the number of study years, and (m) is the number of independent variables.
Results
Analysis of seasonal fluctuations in EEQ
From 2002 to 2022, the six geomorphic regions displayed significant seasonal variations in EEQ. The RSEI rankings and fluctuation patterns differed by season, reflecting the distinct response mechanisms of each region to seasonal climate change (Fig. 3 and Fig. 4). Overall, the Daba Mountains and Qinling Mountains consistently maintained high average RSEI values (> 0.6) across all four seasons, indicating stable and superior ecological quality. The Hanjiang Basin region exhibited RSEI values (~ 0.50–0.60), with relatively stable RSEI values in the summer and autumn. The Loess Plateau and Guanzhong Plain regions had relatively low average RSEI values (~ 0.30–0.50), reflecting poor to moderate ecological conditions. Both regions showed the largest fluctuations in RSEI values across years, with the Loess Plateau surpassing the Guanzhong Plain in certain years. The Loess Plateau is heavily impacted by soil and water erosion47, while the Guanzhong Plain is primarily affected by high human activity intensity and land use changes48. The wind-sand transition zone maintained the lowest average RSEI value (< 0.25) year-round, with greater variability in spring and winter and relatively stable values in summer and autumn. With the exception of the Guanzhong Plain, the other regions showed a fluctuating upward trend in their average RSEI values, suggesting a gradual improvement in ecological quality.
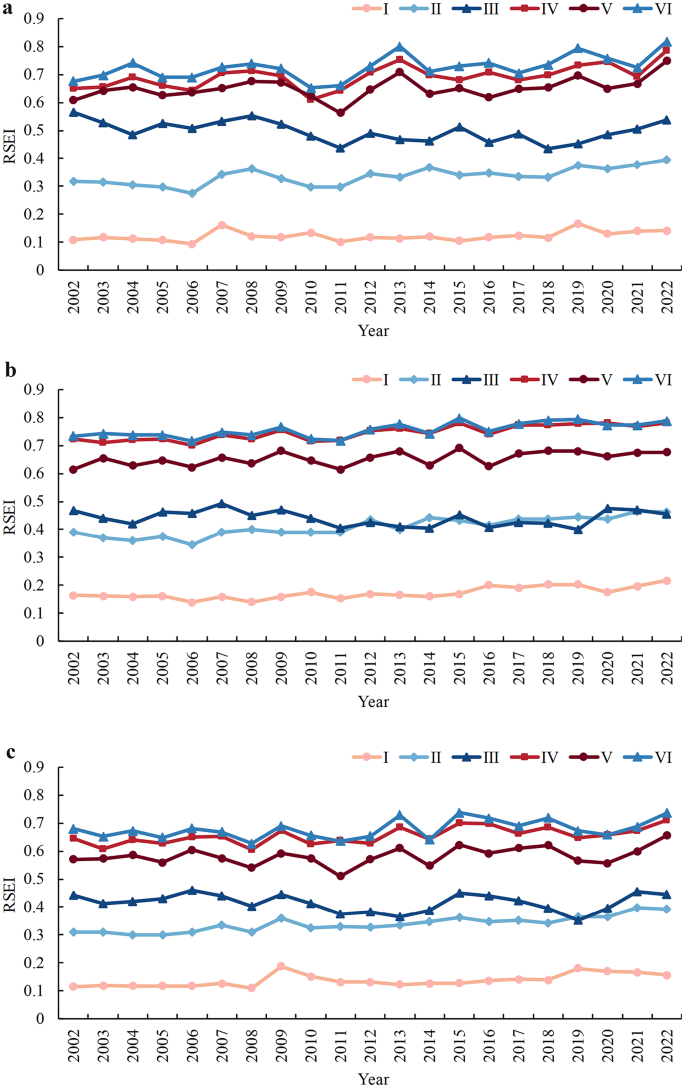
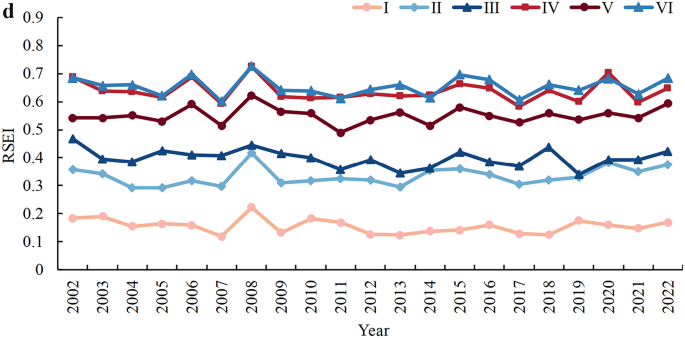
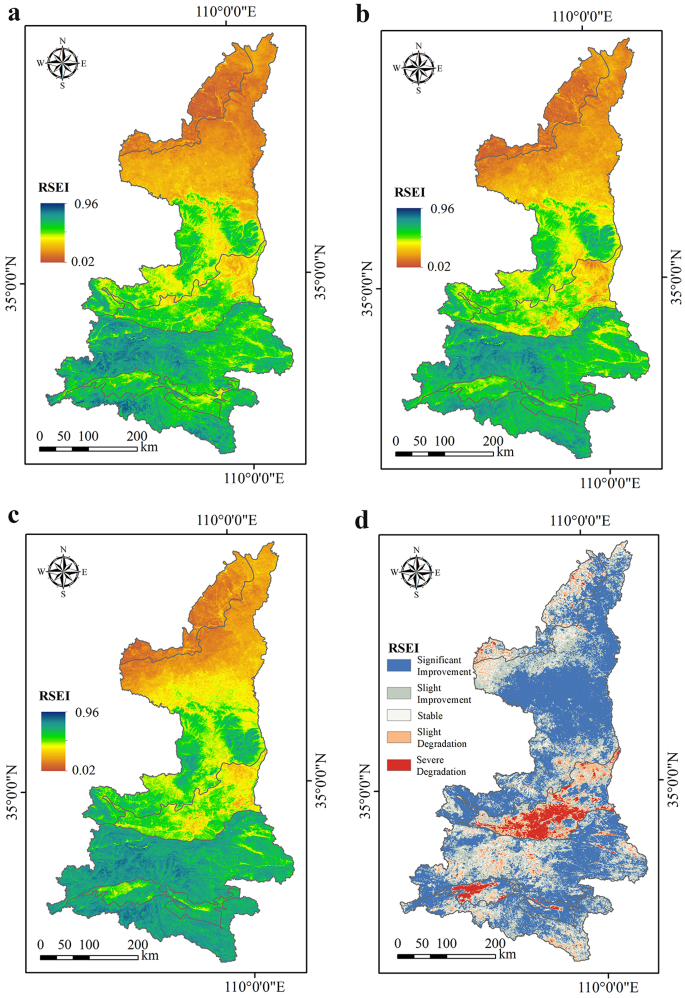
(a–d) Represent the changes in the average RSEI of different geomorphic regions in Shaanxi Province for spring, summer, autumn, and winter from 2002 to 2022.
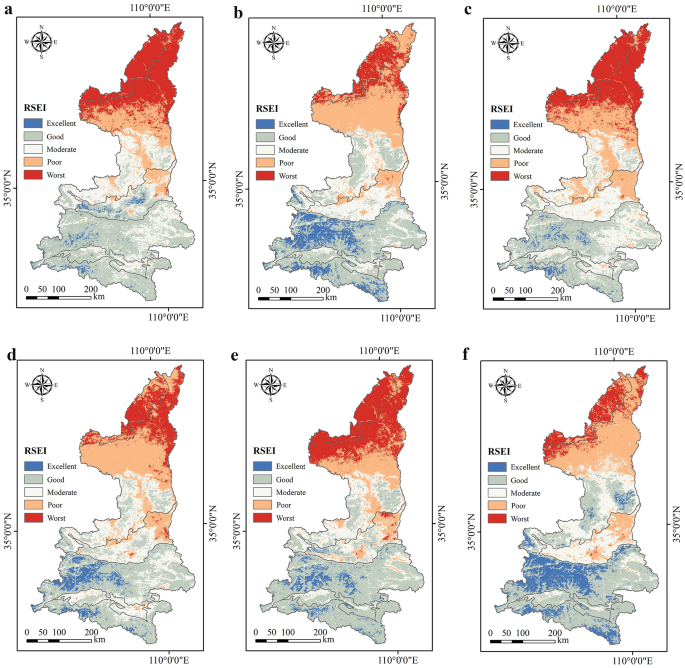
(a–d), (e–h), and (i–l) show the spatial distribution of RSEI classifications for spring, summer, autumn, and winter in 2002, 2012, and 2022, respectively.
Analysis of geomorphic heterogeneity in EEQ across seasons
From 2002 to 2022, EEQ across different geomorphic regions generally showed an improving trend, though significant spatial distribution and variation differences existed across seasons (Fig. 4). In spring, the wind-sand transition zone consistently exhibited the poorest ecological quality, with the worst level predominating, particularly reaching 96.68% in 2002. By 2022, the ecological quality in this region improved, with the proportion of the worst level reduced to 83.94%, although it still faced significant challenges. The Loess Plateau showed notable improvement, with the proportion of the worst level dropping from 34.10% in 2002 to 21.26% in 2022. While the proportion of excellent quality remained low, it increased. The Guanzhong Plain saw a significant rise in moderate quality, from 32.68% in 2002 to 45.22% in 2022, though the proportion of good quality decreased from 39.12% to 32.34%. The Qinling and Daba Mountains demonstrated high ecological quality in spring, with a significant increase in excellent quality, reflecting excellent ecological protection efforts. The Hanjiang Basin saw a dramatic improvement, with the proportion of excellent quality rising from 0.36% in 2002 to 39.76% in 2022.
In summer, ecological quality was generally better than in spring. In the wind-sand transition zone, the proportion of the worst quality decreased significantly from 70.71% in 2002 to 43.72% in 2022, though the proportion of good quality and above remained very low, indicating ongoing ecological restoration pressures. The Loess Plateau showed an increase in moderate and good quality, with the proportion of moderate quality rising from 22.39 to 32.54%, indicating improved ecological quality. The Guanzhong Plain remained relatively stable in summer, with a high proportion of moderate quality. The Qinling and Daba Mountains maintained high ecological quality throughout the summer, with no areas in the worst quality level and a very low proportion in the poor quality level. By 2022, both regions had over 96% of areas in good or better quality. The Hanjiang Basin saw significant improvement, particularly in the proportion of good quality, which rose from 60.60 to 75.55%.
In autumn, the wind-sand transition zone remained in a relatively degraded state but showed some improvement compared to spring, with the worst level decreasing from 95.60% in 2002 to 78.87% in 2022. The Loess Plateau showed improvement, with the proportion of the worst level dropping from 30.88% in 2002 to 12.16% in 2022, although the proportion of good quality remained low. The Guanzhong Plain exhibited fluctuations in ecological quality, with the proportion of moderate quality decreasing from 62.53% in 2002 to 46.50% in 2012, before slightly recovering to 63.30% in 2022. The Qinling and Daba Mountains maintained excellent ecological quality in autumn. The Hanjiang Basin showed continuous improvement, with the proportion of excellent quality areas reaching 73.76% in 2022, a significant increase from 2002.
In winter, the wind-sand transition zone showed a deteriorating trend with fluctuations, with the worst level still predominating, rising from 64.97% in 2002 to 93.39% in 2012, then decreasing to 75.83% in 2022. The Loess Plateau showed a fluctuating stable trend, with ecological quality levels similar between 2002 and 2022. The Guanzhong Plain continued to deteriorate in winter, with the proportion of good quality dropping from 18.78% in 2002 to 4.64% in 2022. The Qinling and Daba Mountains were less affected by seasonal changes, maintaining high ecological quality in winter, although the proportion of excellent quality declined. The Hanjiang Basin showed a fluctuating upward trend, with the proportion of good quality decreasing from 26.22% in 2002 to 19.56% in 2012, then sharply increasing to 56.93% in 2022.
In conclusion, EEQ in different geomorphic regions exhibited significant spatial heterogeneity and unique seasonal patterns. Given the varying magnitudes and trends of EEQ changes across seasons, relying on data from a single season may not fully capture the overall ecological condition of a geomorphic region. Therefore, considering the average value across all four seasons provides a more accurate long-term assessment of EEQ. This approach is particularly applicable to regions with substantial seasonal climatic differences, such as the wind-sand transition zone and the Loess Plateau, where the ecological quality gap between winter and summer is significant. By calculating the average ecological quality across all seasons, a more accurate depiction of the region’s ecological status can be achieved, offering a scientific basis for effective ecological protection strategies.
Spatiotemporal characteristics of seasonal average EEQ
From 2002 to 2022, EEQ in all geomorphic regions, except for the Guanzhong Plain, exhibited a fluctuating upward trend (Fig. 5). The overall ranking of EEQ across different geomorphic regions was as follows: Daba Mountains > Qinling Mountains > Hanjiang Basin > Guanzhong Plain > Loess Plateau > Wind-sand transition zone. The Daba Mountains and Qinling Mountains consistently maintained high ecological quality with minimal fluctuation. The Hanjiang Basin saw the greatest improvement, with the average RSEI rising by 0.09, from moderate to good quality. The Loess Plateau also showed improvement, with the RSEI increasing from 0.34 in 2002 to 0.41 in 2022. However, despite this improvement, the region’s ecological quality remains relatively low due to factors such as terrain, climate, and historical economic activities, resulting in a slow recovery process. The wind-sand transition zone showed only gradual improvement, with a 0.03 increase in RSEI, but it remained at the lowest quality level, facing significant ecological restoration challenges. In contrast, the Guanzhong Plain experienced fluctuating ecological quality decline, with the most pronounced fluctuations. The RSEI decreased from 0.49 in 2002 to 0.47 in 2022, reflecting ecological degradation driven by rapid urbanization, agricultural expansion, and industrial development pressures.
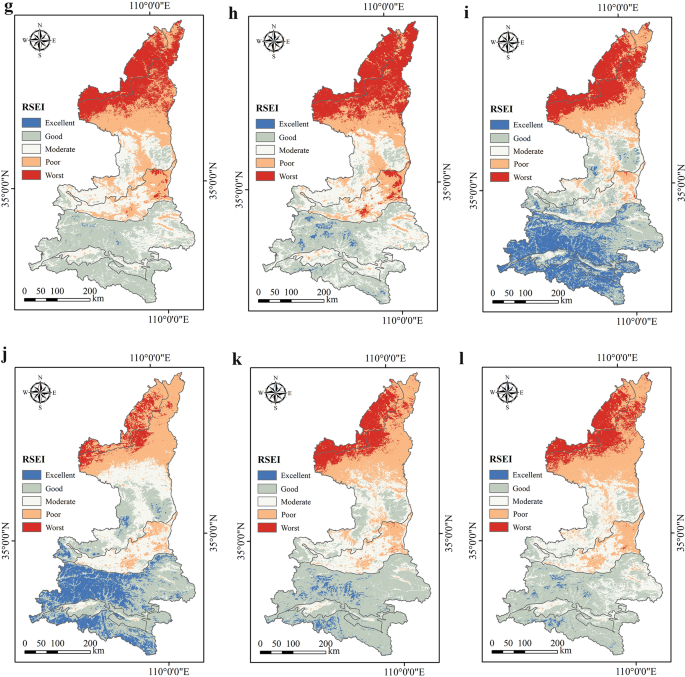
Changes in the average RSEI from 2002 to 2022.
Shaanxi Province exhibited significant spatial heterogeneity in EEQ, with a stepped spatial distribution pattern alternating between low and high values from north to south (Fig. 6a–c), Table 3). High-quality ecological areas were concentrated in the southern Loess Plateau, western Guanzhong Plain, Qinling Mountains, central Hanjiang Basin, and Daba Mountains, where RSEI values generally exceeded 0.6. Low-quality ecological areas were primarily found in the wind-sand transition zone, northern Loess Plateau, and central and eastern Guanzhong Plain.
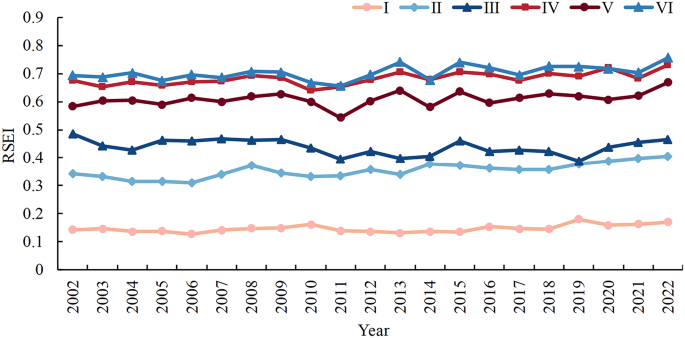
(a–c) Spatial distribution of RSEI for 2002, 2012, and 2022, respectively. (d) Trend of RSEI changes in Shaanxi Province from 2002 to 2022.
To quantify the spatiotemporal evolution of EEQ, this study combined the Mann–Kendall trend test and Theil–Sen slope estimation method to analyze the spatial trends of the RSEI dataset from 2002 to 2022 (Fig. 6d, Table 4). The results revealed that 49.37% of the land area showed a significant improvement in ecological quality, with the Loess Plateau exhibiting the most notable improvement (63.69%). Severely degraded areas accounted for only 4.60%, with significant spatial clustering in economically active regions, such as the central Guanzhong Plain and western Hanjiang Basin. Slightly degraded areas (14.67%) were mainly located around severely degraded areas, while stable areas (14.00%) and slightly improved areas (27.36%) exhibited dispersed spatial patterns.
Response of EEQ to climate change in different geomorphic regions
From 2002 to 2022, both annual precipitation and temperature in Shaanxi Province exhibited a generally fluctuating upward trend (Fig. 7). To further investigate the response mechanisms of EEQ to climate change across different geomorphic regions, partial correlation coefficients between EEQ, precipitation, and temperature for the period 2002–2022 were calculated at the pixel level, and their significance was assessed via t-tests (Fig. 8). The results reveal significant spatial heterogeneity in the response of EEQ to climate factors, with notable differences in sensitivity to fluctuations in precipitation and temperature.
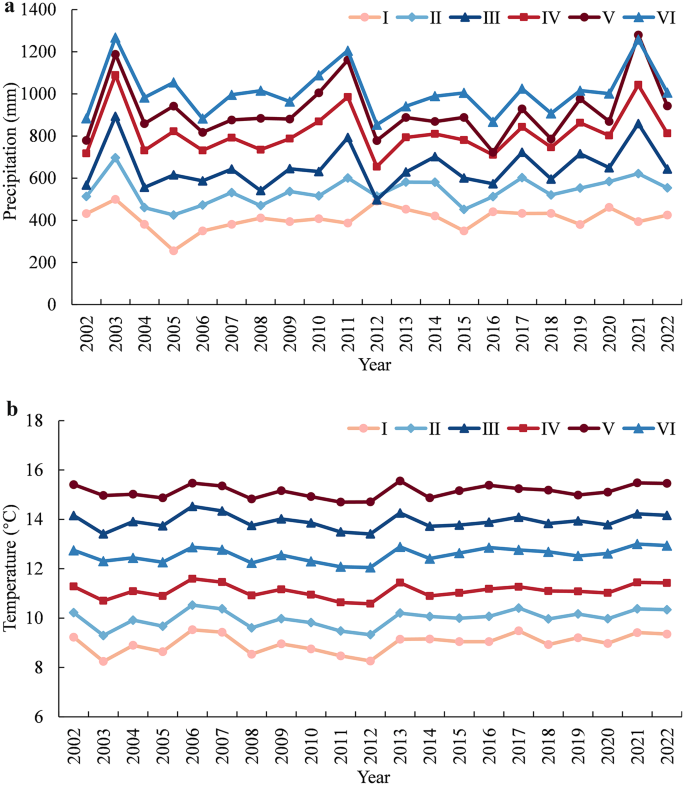
Changes in annual precipitation and temperature in Shaanxi Province from 2002 to 2022.
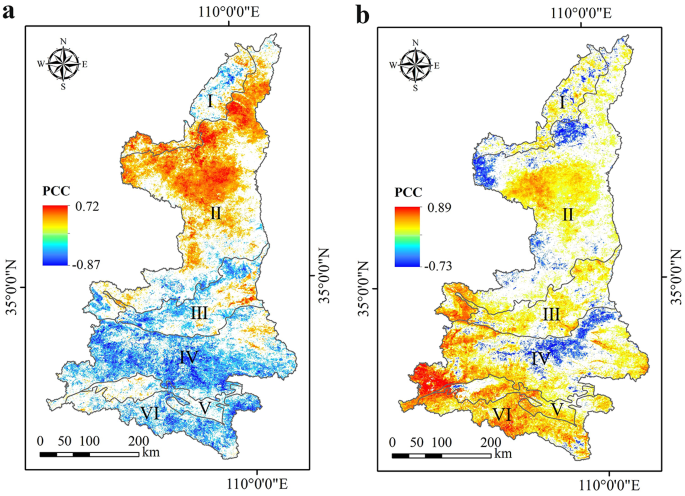
Partial correlation coefficients between RSEI and climatic factors in Shaanxi Province from 2002 to 2022 (p < 0.05).
Regarding spatial distribution, the correlation between EEQ and precipitation showed clear regional variations, following a north-positive, south-negative pattern. The proportions of positive and negative correlations were similar, at 49.25% and 50.75%, respectively. Positive correlations were primarily concentrated in the southwestern wind-sand transition zone, northern and central Loess Plateau, eastern Guanzhong Plain, and western Hanjiang Basin. The Loess Plateau exhibited the highest proportion of positive correlations, at 92.18%, with 23.61% of the area having values exceeding 0.4. This phenomenon may be attributed to regional water-limiting mechanisms: the high porosity of Loess parent material weakens soil water retention, making precipitation a key constraint for vegetation growth. This effect is particularly pronounced following the implementation of the Grain for Green program, where the establishment of artificial vegetation communities has likely increased the ecosystem’s sensitivity to precipitation fluctuations. Negative correlations were mainly observed in the northeastern wind-sand transition zone, southern Loess Plateau, central and western Guanzhong Plain, central and eastern Hanjiang Basin, Qinling Mountains, and Daba Mountains. Notably, the negative correlations were most pronounced in the Qinling and Daba Mountain regions, both exceeding 95%. As areas with high precipitation in Shaanxi, excessive rainfall in these regions may enhance surface runoff, exacerbating soil erosion. Additionally, the attenuation of photosynthetically active radiation due to cloudy weather, combined with insufficient soil moisture replenishment from rapid surface water infiltration in karst regions, may jointly reduce the positive ecological effects of increased precipitation.
The relationship between EEQ and temperature was predominantly positive (86.19%), primarily concentrated in the central wind-sand transition zone, central Loess Plateau, Guanzhong Plain, western and southeastern Qinling Mountains, central and eastern Hanjiang Basin, and Daba Mountains. Negative correlations were mainly found in the northeastern and western wind-sand transition zone, northern and southern Loess Plateau, central and northeastern Qinling Mountains, and western Hanjiang Basin. The most pronounced positive correlation was observed in the Daba Mountain region, with a value of 98.49%. Temperature increases typically enhance photosynthetic efficiency in plants, promoting vegetation growth and improving EEQ49. In the Daba Mountains, the rise in temperature contributes to the stability of the local ecosystem, with positive correlations particularly evident. However, in certain areas, especially the northeastern wind-sand transition zone and northern Loess Plateau, excessively high temperatures may intensify evaporation, leading to rapid soil moisture loss and a decline in EEQ.
Discussions
Differences between summer and seasonal average EEQ
The results of this study both align with and differ from existing research on the seasonal variations in EEQ. Many studies have highlighted the significant impact of seasonal changes on EEQ, particularly the direct influence of fluctuations in temperature and precipitation on ecological quality50,51. Additionally, some studies have found a significant positive correlation between vegetation cover and ecological quality in summer, suggesting that summer is the optimal period for assessing regional ecological quality52,53. However, this study underscores the advantages of integrating data from all four seasons rather than relying solely on a single season. This approach is especially critical in climate-sensitive regions, such as the wind-sand transition zone and the Loess Plateau, where seasonal variability is pronounced. Relying on data from only one season risks introducing systematic bias, as it may fail to capture the region’s overall ecological condition.
Further analysis suggests that the differences between summer and the annual average ecological quality may be driven by a combination of regional climate and geomorphological features. In water-limited areas like the wind-sand transition zone and the Loess Plateau, transient summer precipitation peaks temporarily stimulate vegetation activity, leading to a short-term increase in the RSEI54. For example, in 2022, the summer RSEI in the wind-sand transition zone (0.22) was 29.41% higher than the annual average (0.17). However, drought stress and wind-sand activity during winter and spring substantially lower the yearly average. This quantification indicates that relying solely on summer data in arid regions tends to overestimate EEQ. Conversely, in regions with more favorable water and heat conditions, such as the Qinling and Daba Mountains, seasonal fluctuations in RSEI are considerably smaller (less than 20%), with no significant difference between summer and annual averages. This pattern supports the “buffer effect� hypothesis, which posits that ecosystems with high biodiversity mitigate seasonal climatic stress through functional redundancy55. In other words, species- and functionally-rich ecosystems maintain greater stability during adverse seasons56. Therefore, in regions characterized by significant climatic and geomorphological heterogeneity, averaging RSEI across all four seasons offers a more comprehensive representation of interannual ecosystem stability. This finding highlights a key innovation of the “seasonal fluctuation–geomorphological heterogeneity–climate response� framework: by averaging across seasons, ecosystem conditions that may be missed by single-season assessments (e.g., summer only) can be captured. Exclusive reliance on summer data may underestimate ecological degradation risks associated with harsher seasons.
Response mechanisms of EEQ to climate change
To further elucidate the response mechanisms of EEQ to climate change, evaluation units were established by spatially overlaying 107 county-level administrative divisions with geomorphic regions in Shaanxi Province. A bivariate mapping approach was subsequently applied to analyze the spatial relationships among the RSEI, precipitation, and temperature (Fig. 9). Integrating the analysis from Sect. 4.4 revealed that both precipitation and temperature exhibit ecological response thresholds and influence EEQ through complex nonlinear interactions, with their dominant effects varying considerably across regions. In the wind-sand transition zone and northern Loess Plateau, EEQ demonstrates a strong positive correlation with precipitation in most areas, consistent with the “water limitation hypothesis�57. The high porosity of the loess parent material diminishes soil water retention capacity, rendering precipitation a critical factor for vegetation recovery58. Since the implementation of the Grain-for-Green program, increased evapotranspiration demands from artificial forests and grassland communities have heightened ecosystem sensitivity to precipitation variability59,60. In other words, afforestation has augmented atmospheric water loss, thereby increasing vegetation dependency on rainfall in these regions61. Conversely, EEQ in the Qinba Mountains and Hanjiang Basin shows a significant negative correlation with precipitation. This pattern likely results from two mechanisms: (1) excessive rainfall on steep slopes promotes surface runoff and soil erosion, reducing vegetation cover; and (2) prolonged cloudy and rainy conditions reduce photosynthetically active radiation, thereby limiting carbon assimilation62,63. These processes suggest that beyond a certain threshold, increased precipitation may adversely affect ecological quality in mountainous areas.
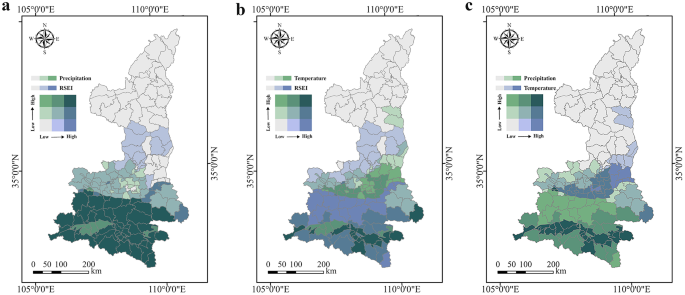
Spatial relationships between precipitation and RSEI (a), temperature and RSEI (b), and precipitation and temperature (c).
In water–heat synergistic zones, such as the Daba Mountains and western Qinling Mountains, rising temperatures substantially improve ecological quality. For example, temperature increases in the Daba Mountains extend the growing season and enhance photosynthetic enzyme activity, markedly promoting vegetation growth64. The positive correlation ratio in this region reaches 98.49%, indicating that ecological quality benefits from warming associated with climate change. However, in water-limited areas such as the northeastern wind-sand transition zone and northern Loess Plateau, increased temperatures exacerbate soil evaporation and intensify water stress, resulting in a significant negative correlation between EEQ and temperature61,65. The ecological benefits of warming are thus highly contingent on regional moisture availability, and ecosystem vulnerability in arid regions may be further exacerbated under climate warming scenarios66. Notably, the central and northeastern Qinling Mountains, characterized by lower elevations and reduced mountain barrier effects compared to the western parts, are more sensitive to temperature fluctuations. From 2002 to 2022, these areas experienced a fluctuating downward trend in temperature. Declining temperatures reduce evaporation rates and enhance soil moisture retention, potentially creating favorable conditions for plant growth67, which manifests as a negative correlation between temperature and EEQ.
Systematic comparisons reveal distinct regional response patterns: EEQ in arid regions such as the Loess Plateau is more sensitive to precipitation changes, whereas temperature exerts a greater influence in humid regions like the Qinling and Daba Mountains. The relatively weak climatic sensitivity of RSEI in the Guanzhong Plain and western Hanzhong Basin further indicates that anthropogenic factors are primary drivers of EEQ. Between 2002 and 2022, urbanization rates in both the Guanzhong Plain and Hanjiang Basin increased by over 20%68,69. Urban expansion has elevated impervious surface coverage, diminishing evapotranspiration cooling effects and intensifying urban heat island phenomena70. Intensive human activities alter surface energy balances and hydrological cycles, restructuring ecosystem responses to climate change71. Consequently, EEQ trends become decoupled from natural climatic drivers, reducing the apparent climate sensitivity of ecosystems in these regions. Furthermore, extreme climate events exert significant impacts on ecological environments and warrant particular attention. Prolonged droughts, heavy rainfall, heatwaves, and other extremes frequently exceed normal seasonal variations, drastically impairing vegetation health and exacerbating regional ecological stress72,73. For example, the severe drought in 2011 markedly lowered vegetation coverage in Shaanxi Province compared to other years, reflecting the acute short-term impacts of extreme climate events. Such extremes not only increase ecosystem vulnerability but may also cause anomalous inter-seasonal fluctuations in ecological quality, thereby undermining regional ecological stability and resilience. Accordingly, future studies should enhance dynamic monitoring and mechanistic understanding of extreme events.
This study has certain limitations. The spatial resolution of RSEI and climate datasets may obscure fine-scale ecological heterogeneity. Additionally, focusing solely on precipitation and temperature may neglect other influential climatic drivers. Future research should incorporate higher spatial resolution remote sensing data (e.g., Sentinel-2), integrate additional climatic variables such as evapotranspiration and solar radiation, and extend this framework to other regions to evaluate its general applicability.
Conclusions
This study, utilizing the GEE platform and multi-source spatial data, systematically examined the seasonal fluctuations in EEQ and its response mechanisms to climate change across six geomorphic regions of Shaanxi Province from 2002 to 2022. The findings were as follows: (1) EEQ showed significant geomorphic differentiation and seasonal variations. The Daba Mountains and Qinling Mountains consistently maintained high RSEI values (RSEI > 0.6) throughout the year, indicating strong ecological stability, while the wind-sand transition zone remained at very low levels (RSEI < 0.25) year-round. The Guanzhong Plain, impacted by intensified human activity, was the only region where ecological quality fluctuated and degraded. (2) The average RSEI across all four seasons provided a more comprehensive reflection of ecological quality than data from a single season. This was particularly true for climate-sensitive areas (e.g., the wind-sand transition zone and the Loess Plateau), where relying on data from a single season (e.g., summer) may have overestimated EEQ in arid regions and underestimated degradation risks in humid regions. (3) EEQ responses to climate change varied significantly due to water-heat balance and geomorphological constraints. Precipitation was the primary driver in arid regions like the Loess Plateau (positive correlation in 92.18% of the area), while temperature had a greater influence in humid regions like the Daba Mountains (positive correlation in 98.49% of the area). In areas with high human activity, such as the Guanzhong Plain, climate sensitivity was markedly reduced, highlighting anthropogenic influences. By developing an integrated “seasonal fluctuation-geometric heterogeneity-climate response� analytical framework, this study addressed the systematic biases of traditional single-season assessments and offered new insights for ecological risk early-warning in climate-sensitive regions. The results provide a theoretical basis for regionally differentiated ecological restoration strategies and have significant practical implications for sustainable regional development and achieving dual-carbon goals.
Future research should aim to incorporate higher-resolution remote sensing and climate data to better capture fine-scale ecological variations. Additionally, further exploration of how human activities influence ecological quality, particularly in urbanizing areas, is essential. Developing predictive models for ecological quality could also enhance the applicability of these findings, supporting more effective ecological management and climate adaptation efforts.
Data availability
The data supporting the results of this study can be accessed via the download links provided in in Table 1.
References
-
Lin, S. et al. Underestimated interannual variability of terrestrial vegetation production by terrestrial ecosystem models. Glob. Biogeochem. Cycles. https://doi.org/10.1029/2023gb007696 (2023).
-
Shi, S. et al. Analysis of ecological environment quality heterogeneity across different landform types in Myanmar and its driving forces. Ecol. Indic. https://doi.org/10.1016/j.ecolind.2024.112755 (2024).
-
Wessely, J. et al. Climate warming may increase the frequency of cold-adapted haplotypes in alpine plants. Nat. Clim. Change 12, 77–82. https://doi.org/10.1038/s41558-021-01255-8 (2022).
-
Zhang, M. et al. Application of the optimal parameter geographic detector model in the identification of influencing factors of ecological quality in Guangzhou, China. Land 11, 1303 (2022).
-
Beigaite, R. et al. Identifying climate thresholds for dominant natural vegetation types at the global scale using machine learning: Average climate versus extremes. Glob. Change Biol. 28, 3557–3579. https://doi.org/10.1111/gcb.16110 (2022).
-
Li, J. et al. Evaluation of geomorphological classification uncertainty using rough set theory: A case study of Shaanxi Province, China. Earth Surf. Processes Landf. 49, 4532–4548 (2024).
-
Liu, D., Chen, H., Zhang, H., Geng, T. & Shi, Q. Spatiotemporal evolution of landscape ecological risk based on geomorphological regionalization during 1980–2017: A case study of Shaanxi Province, China. Sustainability 12, 941 (2020).
-
Zhu, L., Li, Z., Su, H. & Wang, X. Temporal and spatial distribution of ancient sites in Shaanxi Province using geographic information systems (GIS). Herit. Sci. 9, 1–10 (2021).
-
Kattel, G. R. Climate warming in the Himalayas threatens biodiversity, ecosystem functioning and ecosystem services in the 21st century: Is there a better solution?. Biodivers. Conserv. 31, 2017–2044 (2022).
-
Balist, J., Malekmohammadi, B., Jafari, H. R., Nohegar, A. & Geneletti, D. Detecting land use and climate impacts on water yield ecosystem service in arid and semi-arid areas. A study in Sirvan River Basin-Iran. Appl. Water Sci. 12, 1–14 (2022).
-
Wang, L. et al. Urban warming increases the temperature sensitivity of spring vegetation phenology at 292 cities across China. Sci. Total Environ. 834, 155154–155154. https://doi.org/10.1016/j.scitotenv.2022.155154 (2022).
-
Gampe, D. et al. Increasing impact of warm droughts on northern ecosystem productivity over recent decades. Nat. Clim. Change 11, 772–779 (2021).
-
Haile, G. G. et al. Projected impacts of climate change on drought patterns over East Africa. Earth’s Future https://doi.org/10.1029/2020ef001502 (2020).
-
Xiong, Y. et al. Influence of human activities and climate change on wetland landscape pattern—A review. Sci. Total Environ. 879, 163112 (2023).
-
Su, B., Su, Z. & Catena, Z. Trade-off analyses of plant biomass and soil moisture relations on the loess Plateau. CATENA 197, 104946–104946. https://doi.org/10.1016/j.catena.2020.104946 (2020).
-
Li, Y. et al. Biophysical impacts of earth greening can substantially mitigate regional land surface temperature warming. Nat. Commun. 14, 121 (2023).
-
Xu HanQiu, X. H. A remote sensing index for assessment of regional ecological changes (2013).
-
Zhang, H. et al. Combing remote sensing information entropy and machine learning for ecological environment assessment of Hefei-Nanjing-Hangzhou Region, China. J. Environ. Manag. https://doi.org/10.1016/j.jenvman.2022.116533 (2022).
-
Zhang, H., Ma, C. & Liu, P. Dynamic evaluation of the ecological evolution and quality of arid and semi-arid deserts in the Aibugai River Basin based on an improved remote sensing ecological index. Ecol. Inform. 82, 102727 (2024).
-
Zhang, L., Liu, Q., Wang, J., Wu, T. & Li, M. Constructing ecological security patterns using remote sensing ecological index and circuit theory: A case study of the Changchun-Jilin-Tumen region. J. Environ. Manag. 373, 123693 (2025).
-
Du, Z. et al. Ecological health assessment of Tibetan alpine grasslands in Gannan using remote sensed ecological indicators. 1–19 (2024).
-
Zenghui, S. et al. Effects of large-scale land consolidation projects on ecological environment quality: A case study of a land creation project in Yan’an, China. Environ. Int. 183, 108392 (2024).
-
Chen, S. et al. Vegetation change and eco-environmental quality evaluation in the loess plateau of China from 2000 to 2020. Remote Sens. https://doi.org/10.3390/rs15020424 (2023).
-
Yang, Y. & Li, H. Spatiotemporal dynamic decoupling states of eco-environmental quality and land-use carbon emissions: A case study of Qingdao City, China. Ecol. Inform. 75, 101992 (2023).
-
Sun, C. et al. Ecological quality assessment and monitoring using a time-series remote sensing-based ecological index (ts-RSEI). GIScience Remote Sens. 59, 1793–1816 (2022).
-
Liu, S. et al. Spatial-temporal changes in vegetation cover in a typical semi-humid and semi-arid region in China: Changing patterns, causes and implications. Ecol. Indic. 98, 462–475 (2019).
-
Zhou, T. et al. Seasonal dynamics of soil water content in the typical vegetation and its response to precipitation in a semi-arid area of Chinese Loess Plateau. J. Arid Land 13, 1015–1025 (2021).
-
Wang, B. & Cheng, W. Geomorphic influences on land use/cover diversity and pattern. CATENA 230, 107245 (2023).
-
Xu, H. et al. Effects of geomorphic spatial differentiation on vegetation distribution based on remote sensing and geomorphic regionalization. Remote Sens. 16, 1062 (2024).
-
Zhou, Q., Luo, Y., Zhou, X., Cai, M. & Zhao, C. Response of vegetation to water balance conditions at different time scales across the karst area of southwestern China—A remote sensing approach. Sci. Total Environ. 645, 460–470 (2018).
-
Fei, L., Ya, L. & Shuang, M. Regional difference of grain production potential change and its influencing factors: A case-study of Shaanxi Province, China. J. Agric. Sci. 157, 1–11 (2019).
-
Liu, S. & Yao, S. The effect of precipitation on the cost-effectiveness of Sloping land conversion program: A case study of Shaanxi Province, China. Ecol. Indic. 132, 108251 (2021).
-
Gorelick, N. et al. Google earth engine: Planetary-scale geospatial analysis for everyone. Remote Sens. Environ. 202, 18–27 (2017).
-
Shouzhang, P. (ed Center National Tibetan Plateau Data) (National Tibetan Plateau Data Center, 2020).
-
Peng, S., Gang, C., Cao, Y. & Chen, Y. Assessment of climate change trends over the Loess Plateau in China from 1901 to 2100. Int. J. Climatol. 38, 2250–2264 (2018).
-
Peng, S. et al. Spatiotemporal change and trend analysis of potential evapotranspiration over the Loess Plateau of China during 2011–2100. Agric. For. Meteorol. 233, 183–194 (2017).
-
Peng, S., Ding, Y., Liu, W. & Li, Z. 1 km monthly temperature and precipitation dataset for China from 1901 to 2017. Earth Syst. Sci. Data 11, 1931–1946 (2019).
-
Shui, J., Ren, J., Peng, S. & Zhan, X. A dataset of 1 km-spatial-resolution monthly mean temperature and monthly precipitation in the loess plateau from 1901 to 2014. Sci. Data Bank 4, 133–142 (2019).
-
Liu, L., Chen, Y., Peng, S. & Han, Q. J. E. I. Improving forest carbon sequestration through thinning strategies under soil conservation constraints: A case study in Shaanxi Province, China. Ecol. Indic. 166, 112291 (2024).
-
Wang, R. et al. Mapping 30-m resolution bioclimatic variables during 1991–2020 climate normals for Hubei province, the Yangtze river middle reaches. IEEE J. Sel. Top. Appl. Earth Obs. Remote Sens. 17, 4646–4662 (2024).
-
Zheng, Z., Wu, Z., Chen, Y., Guo, C. & Marinello, F. Instability of remote sensing based ecological index (RSEI) and its improvement for time series analysis. Sci. Total Environ. 814, 152595 (2022).
-
Gong, C., Lyu, F. & Wang, Y. Spatiotemporal change and drivers of ecosystem quality in the Loess Plateau based on RSEI: A case study of Shanxi, China. Ecol. Indic. 155, 111060 (2023).
-
Mallick, J. et al. Analysing the trend of rainfall in Asir region of Saudi Arabia using the family of Mann-Kendall tests, innovative trend analysis, and detrended fluctuation analysis. Theor. Appl. Climatol. 143, 823–841 (2021).
-
Zhou, J., Deitch, M. J., Grunwald, S. & Screaton, E. Do the Mann-Kendall test and Theil-Sen slope fail to inform trend significance and magnitude in hydrology?. Hydrol. Sci. J. 68, 1241–1249 (2023).
-
Long, Y., Jiang, F., Deng, M., Wang, T. & Sun, H. Spatial-temporal changes and driving factors of eco-environmental quality in the Three-North region of China. J. Arid Land 15, 231–252 (2023).
-
Ren, Z., Tian, Z., Wei, H., Liu, Y. & Yu, Y. Spatiotemporal evolution and driving mechanisms of vegetation in the Yellow River Basin, China during 2000–2020. Ecol. Indic. 138, 108832 (2022).
-
Wang, K. et al. Sustainability of eco-environment in semi-arid regions: Lessons from the Chinese Loess Plateau. Environ. Sci. Policy 125, 126–134 (2021).
-
Song, Y. et al. Land space change process and its eco-environmental effects in the Guanzhong Plain urban agglomeration of China. Land 11, 1547 (2022).
-
Hussain, S. et al. Photosynthesis research under climate change. Photosynthesis Res. 150, 5–19 (2021).
-
Yuan, B. et al. Spatiotemporal change detection of ecological quality and the associated affecting factors in Dongting Lake Basin, based on RSEI. J. Clean. Prod. 302, 126995 (2021).
-
Abbass, K. et al. A review of the global climate change impacts, adaptation, and sustainable mitigation measures. Environ. Sci. Pollut. Res. 29, 42539–42559 (2022).
-
Fang, Q. et al. Effects of climatic disturbance on the trade-off between the vegetation pattern and water balance based on a novel model and accurately remotely sensed data in a Semiarid Basin. Remote Sens. 16, 2132 (2024).
-
Naif, S., Mahmood, D. & Al-Jiboori, M. (2020).
-
Shi, S. et al. Quantitative contributions of climate change and human activities to vegetation changes over multiple time scales on the loess plateau. Sci. Total Environ. 755, 142419–142419. https://doi.org/10.1016/j.scitotenv.2020.142419 (2021).
-
Oliveira, B. F., Moore, F. C. & Dong, X. Biodiversity mediates ecosystem sensitivity to climate variability. Commun. Biol. https://doi.org/10.1038/s42003-022-03573-9 (2022).
-
Aguirre-Gutiérrez, J. et al. Functional susceptibility of tropical forests to climate change. Nat. Ecol. Evol. 6, 878–889 (2022).
-
Pan, Z., Gao, G. & Fu, B. Spatiotemporal changes and driving forces of ecosystem vulnerability in the Yangtze River Basin, China: Quantification using habitat-structure-function framework. Sci. Total Environ. 835, 155494 (2022).
-
Huang, L. Advances and perspectives on soil water research in China’s Loess Plateau. Earth-Sci. Rev. 199, 102962 (2019).
-
Liu, Z., Wang, J., Wang, X. & Wang, Y. Understanding the impacts of ‘grain for green’ land management practice on land greening dynamics over the loess plateau of China. Land Use Policy 99, 105084–105084. https://doi.org/10.1016/j.landusepol.2020.105084 (2020).
-
Song, W., Feng, Y. & Wang, Z. Ecological restoration programs dominate vegetation greening in China. Sci. Total Environ. 848, 157729 (2022).
-
Jiang, F. et al. Loess plateau evapotranspiration intensified by land surface radiative forcing associated with ecological restoration. Agric. For. Meteorol. 311, 108669–108669. https://doi.org/10.1016/j.agrformet.2021.108669 (2021).
-
Zhang, S. et al. Using the geodetector method to characterize the spatiotemporal dynamics of vegetation and its interaction with environmental factors in the Qinba mountains, China. Remote Sens. 14, 5794 (2022).
-
Wang, Q. et al. Enhancing resilience against geological hazards and soil erosion through sustainable vegetation management: A case study in Shaanxi Province. J. Clean. Prod. 423, 138687 (2023).
-
Liu, X. et al. Vegetation dynamics in Qinling-Daba Mountains in relation to climate factors between 2000 and 2014. J. Geograph. Sci. 26, 45–58 (2016).
-
Su, J., Fan, L., Yuan, Z., Wang, Z. & Wang, Z. Vegetation dynamics and their response patterns to drought in Shaanxi province, China. Forests 14, 1528 (2023).
-
Seddon, N. et al. Getting the message right on nature-based solutions to climate change. Glob. Change Biol. 27, 1518–1546 (2021).
-
Wang, B. et al. Vegetation dynamics and their relationships with climatic factors in the Qinling Mountains of China. Ecol. Indic. 108, 105719 (2020).
-
Gu, L., Yan, J., Li, Y. & Gong, Z. Spatial–temporal evolution and correlation analysis between habitat quality and landscape patterns based on land use change in Shaanxi Province, China. Ecol. Evol. 13, e10657 (2023).
-
Zhao, G., Liang, R., Li, K., Wang, Y. & Pu, X. Study on the coupling model of urbanization and water environment with basin as a unit: A study on the Hanjiang Basin in China. Ecol. Indic. https://doi.org/10.1016/j.ecolind.2021.108130 (2021).
-
Wardeh, Y. et al. Review of the optimization techniques for cool pavements solutions to mitigate Urban Heat Islands. Build. Environ. 223, 109482 (2022).
-
Albert, J. S. et al. Human impacts outpace natural processes in the Amazon. Science 379, eabo5003 (2023).
-
Jiang, R. et al. Spatiotemporal variability of extreme precipitation in Shaanxi province under climate change. Theor. Appl. Climatol. 130, 831–845 (2017).
-
Cao, S. et al. Spatiotemporal characteristics of drought and its impact on vegetation in the vegetation region of Northwest China. Ecol. Indic. 133, 108420 (2021).
Acknowledgements
We would like to express our heartfelt appreciation to everyone who contributed to the success of this research. Our deepest gratitude goes to the institutions and individuals who provided invaluable data support, without which this study would not have been achievable. The data they provided played a crucial role in advancing this work, and we are truly appreciative of their assistance. This research was supported by the Technology Innovation Center for Land Engineering and Human Settlements, Shaanxi Land Engineering Construction Group Co., Ltd. and Xi’an Jiaotong University (2024WHZ0238 and 2024WHZ0237), the Enterprise Innovation and Youth Talent Support Program of Shaanxi Association for Science and Technology (20230517), the Scientific Research Item of Shaanxi Agricultural Development Group Co., Ltd. (NFJC2025-38), the Education Department of Shaanxi Provincial Government (23JK0273), the Internal Special Project of Ankang University (2022AYQN11), and the Open Foundation of the Key Laboratory of Coupling Process and Effect of Natural Resources Elements (2023KFKTB008).
Funding
This research was supported by the Technology Innovation Center for Land Engineering and Human Settlements, Shaanxi Land Engineering Construction Group Co., Ltd. and Xi’an Jiaotong University (2024WHZ0238 and 2024WHZ0237), the Enterprise Innovation and Youth Talent Support Program of Shaanxi Association for Science and Technology (20230517), the Scientific Research Item of Shaanxi Agricultural Development Group Co., Ltd. (NFJC2025-38), the Education Department of Shaanxi Provincial Government (23JK0273), the Internal Special Project of Ankang University (2022AYQN11), and the Open Foundation of the Key Laboratory of Coupling Process and Effect of Natural Resources Elements (2023KFKTB008).
Author information
Authors and Affiliations
Contributions
J.L. contributed to the conceptualization, formal analysis, and funding acquisition, as well as constructing the RSEI assessment model and writing the main manuscript text. Y.Z. contributed to the conceptualization of the study. L.Y. and Z.S. contributed to the methodology, software development, and formal analysis. Additionally, Z.S. contributed to the funding acquisition and provided constructive feedback. All authors reviewed and edited the manuscript.
Corresponding author
Ethics declarations
Competing interests
The authors declare no competing interests.
Additional information
Publisher’s note
Springer Nature remains neutral with regard to jurisdictional claims in published maps and institutional affiliations.
Rights and permissions
Open Access This article is licensed under a Creative Commons Attribution-NonCommercial-NoDerivatives 4.0 International License, which permits any non-commercial use, sharing, distribution and reproduction in any medium or format, as long as you give appropriate credit to the original author(s) and the source, provide a link to the Creative Commons licence, and indicate if you modified the licensed material. You do not have permission under this licence to share adapted material derived from this article or parts of it. The images or other third party material in this article are included in the article’s Creative Commons licence, unless indicated otherwise in a credit line to the material. If material is not included in the article’s Creative Commons licence and your intended use is not permitted by statutory regulation or exceeds the permitted use, you will need to obtain permission directly from the copyright holder. To view a copy of this licence, visit http://creativecommons.org/licenses/by-nc-nd/4.0/.
About this article

Cite this article
Li, J., Zhang, Y., Yang, L. et al. Seasonal variations in ecological environment quality across different geomorphological regions and their response mechanisms to climate change.
Sci Rep 15, 26385 (2025). https://doi.org/10.1038/s41598-025-11442-8
-
Received: 03 March 2025
-
Accepted: 10 July 2025
-
Published: 21 July 2025
-
DOI: https://doi.org/10.1038/s41598-025-11442-8
Search
RECENT PRESS RELEASES
