Why Gold Price Is Falling the Most Since 2020? The Crash Is Dragging Bitcoin Down Too
October 22, 2025
Gold price experienced
its most severe single-day collapse in over five years this week, plunging more
than 5% from record highs and dragging Bitcoin (BTC) lower in a synchronized
selloff that erased billions in market capitalization.
The
precious metal fell from Monday’s all-time peak of $4,381 per ounce to an
intraday low of $4,082, marking the steepest decline since August 2020’s 5.7%
crash. Bitcoin simultaneously dropped over 2%, falling from $110,000
levels to test critical support at $108,000 as the correlation between
digital and physical safe-haven assets reached 0.85.
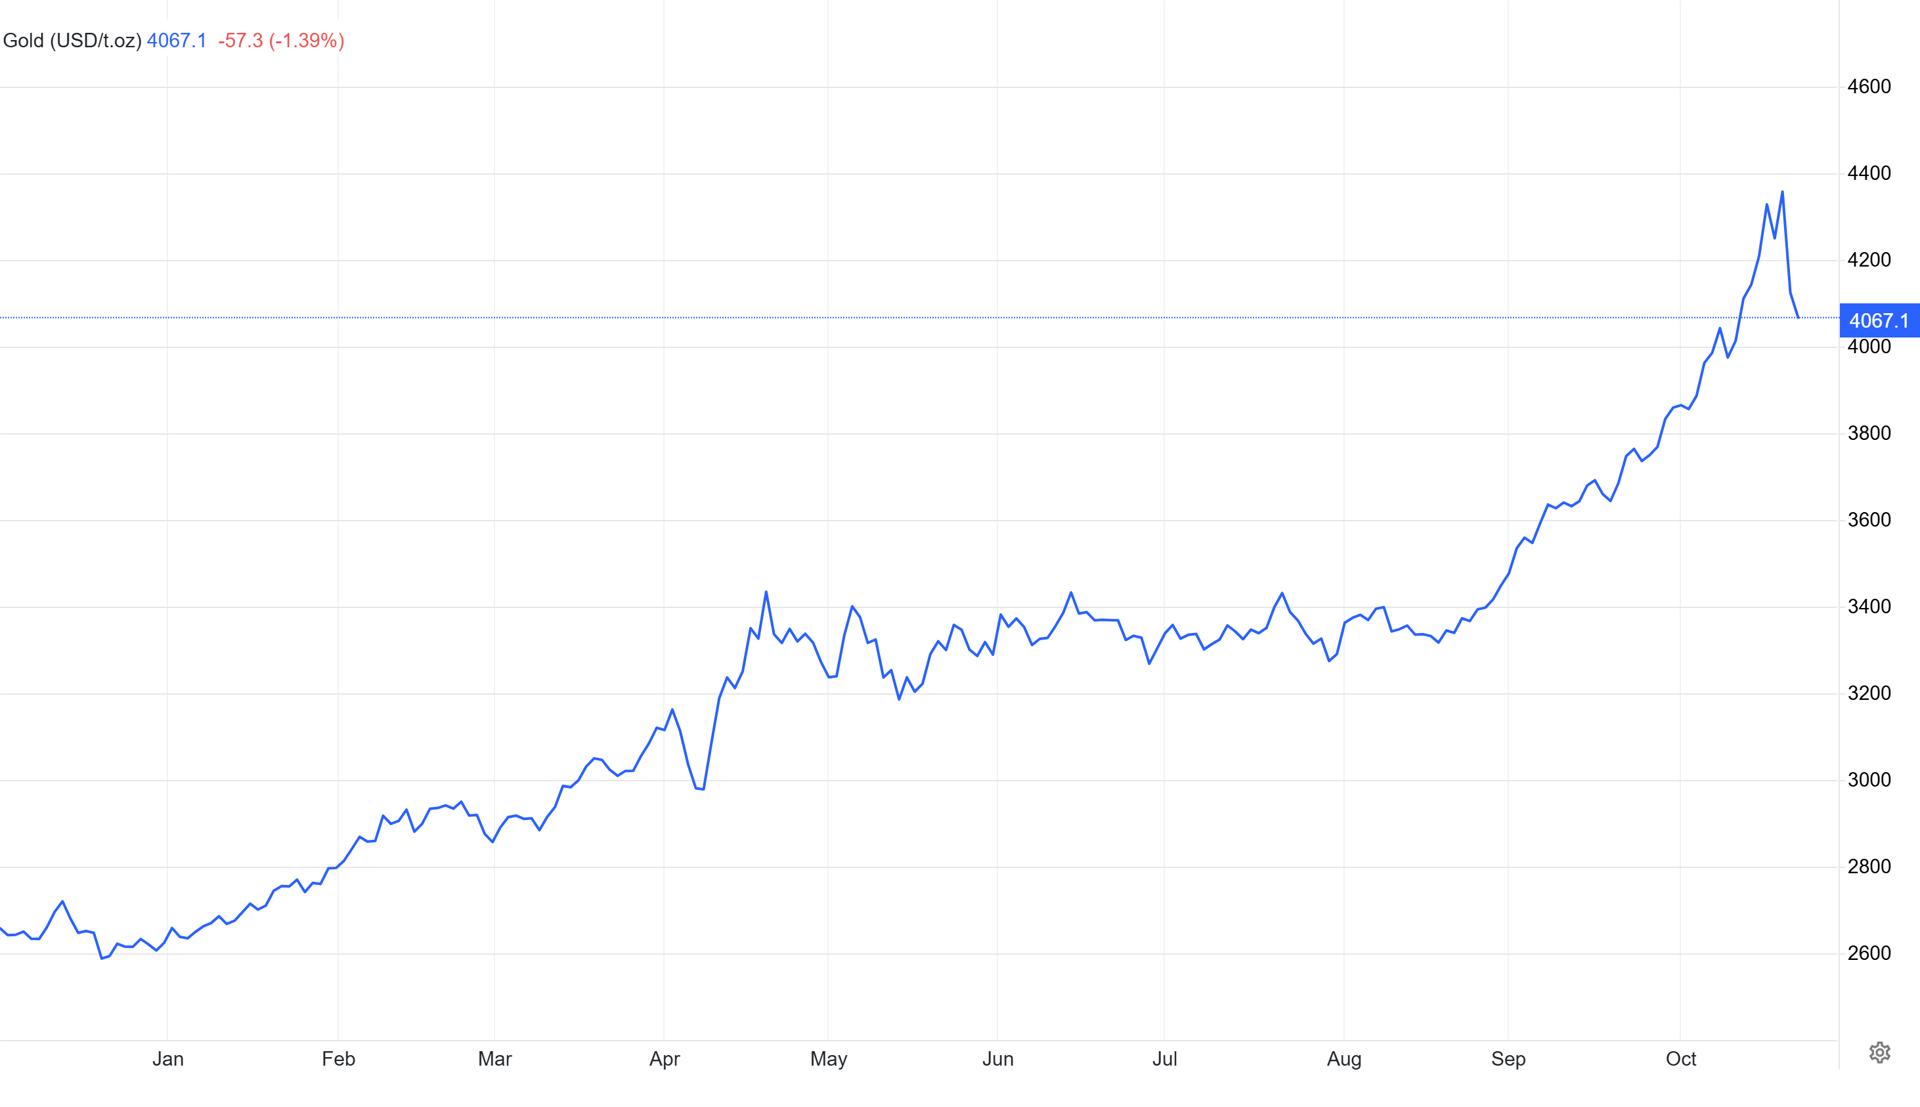
The gold
crash followed an unsustainable rally that saw
prices surge 60% throughout 2025 and 25% in just the previous two
months, creating what analysts described as “stratosphere” conditions
ripe for correction.
Standard
Chartered analyst Suki Cooper characterized the movement as a “technical
correction” after record-breaking precious metals inflows totaling
$34.2 billion over ten weeks pushed the market into severely overbought
territory. Bart Melek, global head of commodity strategy at TD Securities,
confirmed dealers were “realizing gains after a strong
rally” that proved unsustainable long-term.
Profit-taking
accelerated as
the US dollar index strengthened 0.4%, making gold more expensive for
international buyers and reducing its appeal against competing assets. The
timing coincided with renewed optimism over US-China trade negotiations, with
President Trump expressing confidence about reaching a deal with Chinese
President Xi Jinping at their scheduled meeting. This easing of geopolitical
tensions diminished safe-haven demand that had propelled gold to consecutive
record highs.
Physical
demand also weakened following the conclusion of the Diwali festival in India,
the world’s second-largest gold consumer, removing a significant source of
buying pressure. Silver crashed even harder at 8.7% in its
worst single-day drop since February 2021, while platinum fell 5-7%,
confirming the broad-based precious metals correction.
Why Bitcoin Price Is Going
Down Today?
Bitcoin’s
decline mirrored gold’s weakness as the strengthening correlation
between the two assets, currently at 0.85, near the all-time high of 0.9
reached in April 2024, caused synchronized selling pressure. The cryptocurrency
ended Tuesday’s session at $108,342, dropping over 2% and retesting local
support around the $108,000 level that coincides with late August lows and
marks the lower boundary of the months-long consolidation range.
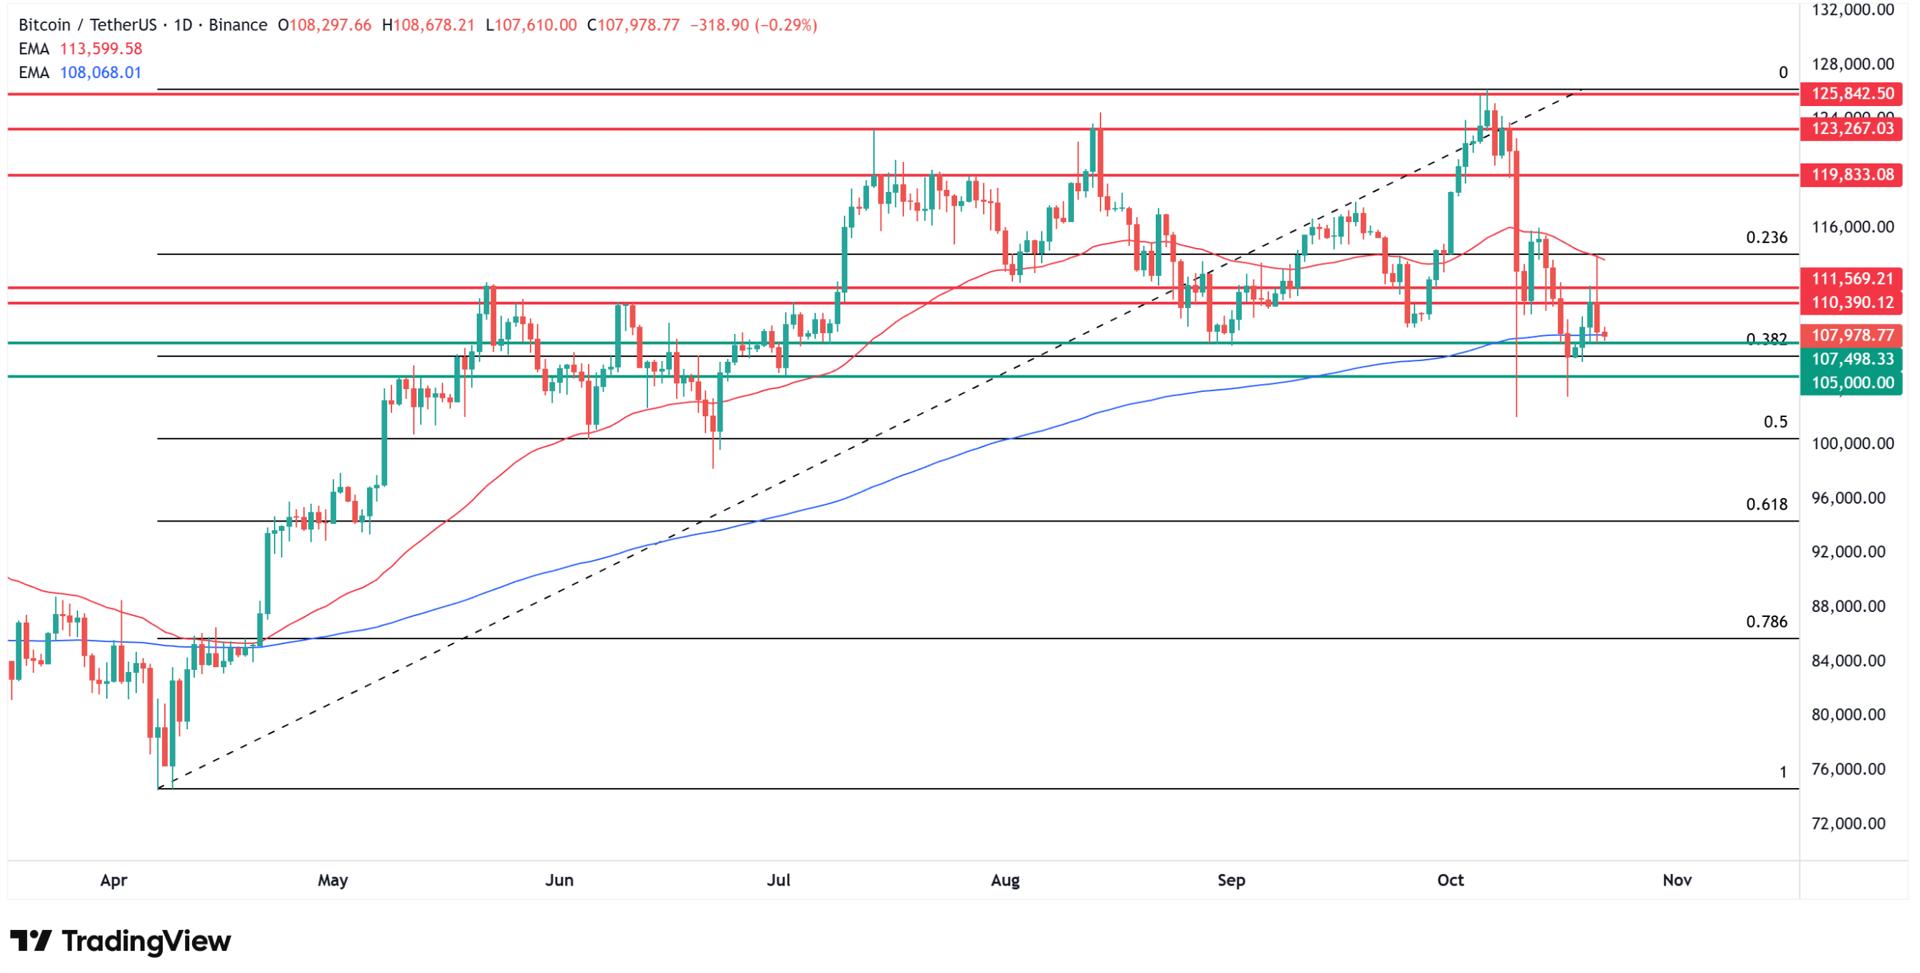
From my
technical analysis of Bitcoin’s chart, the price attempted to strengthen
on Monday before ultimately pulling back sharply in direct reaction to
gold’s crash. Bitcoin tested the critical support zone around $108,000,
which aligns with late August lows and represents the lower boundary of the
consolidation drawn since mid-October.
Importantly,
the 200-day exponential moving average continues to provide support,
meaning we remain technically in a bull trend. However, a breakdown below
this range would open the door to further declines and a test of the
$100,000 level, a major psychological support zone.
Paul Howard
from Wincent noted that “many analysts follow technical trends
including M2 money supply, gold, stock2flow models plus other metrics as
ways to predict Bitcoin’s next move. Arguably many now indicate a big
upswing and with so many leveraged longs and shorts liquidated, and a positive
global macro environment may see Bitcoin as a gold laggard”. The
comment highlights how Bitcoin’s underperformance relative to gold’s
earlier rally may reverse following the liquidation cleanup.
Please also check my previous articles including Bitcoin and gold price predictions:
Key Market Indicators for
Gold and Bitcoin
|
Metric |
Value |
Change |
Significance |
|
Gold Price (Oct 22) |
$4,082 |
-5.6% |
Worst drop since August 2020 |
|
Bitcoin Price (Oct 22) |
$108,342 |
-2.1% |
Testing August support levels |
|
Silver Price |
$51.89 |
-8.7% |
Worst drop since February 2021 |
|
Gold-Bitcoin Correlation |
0.85 |
Near ATH |
Explaining synchronized selloff |
|
US Bitcoin ETF Flows |
-$40.47M |
Outflows |
Institutional caution |
|
Crypto Market Cap |
$3.76T |
-2.3% |
Broad-based decline |
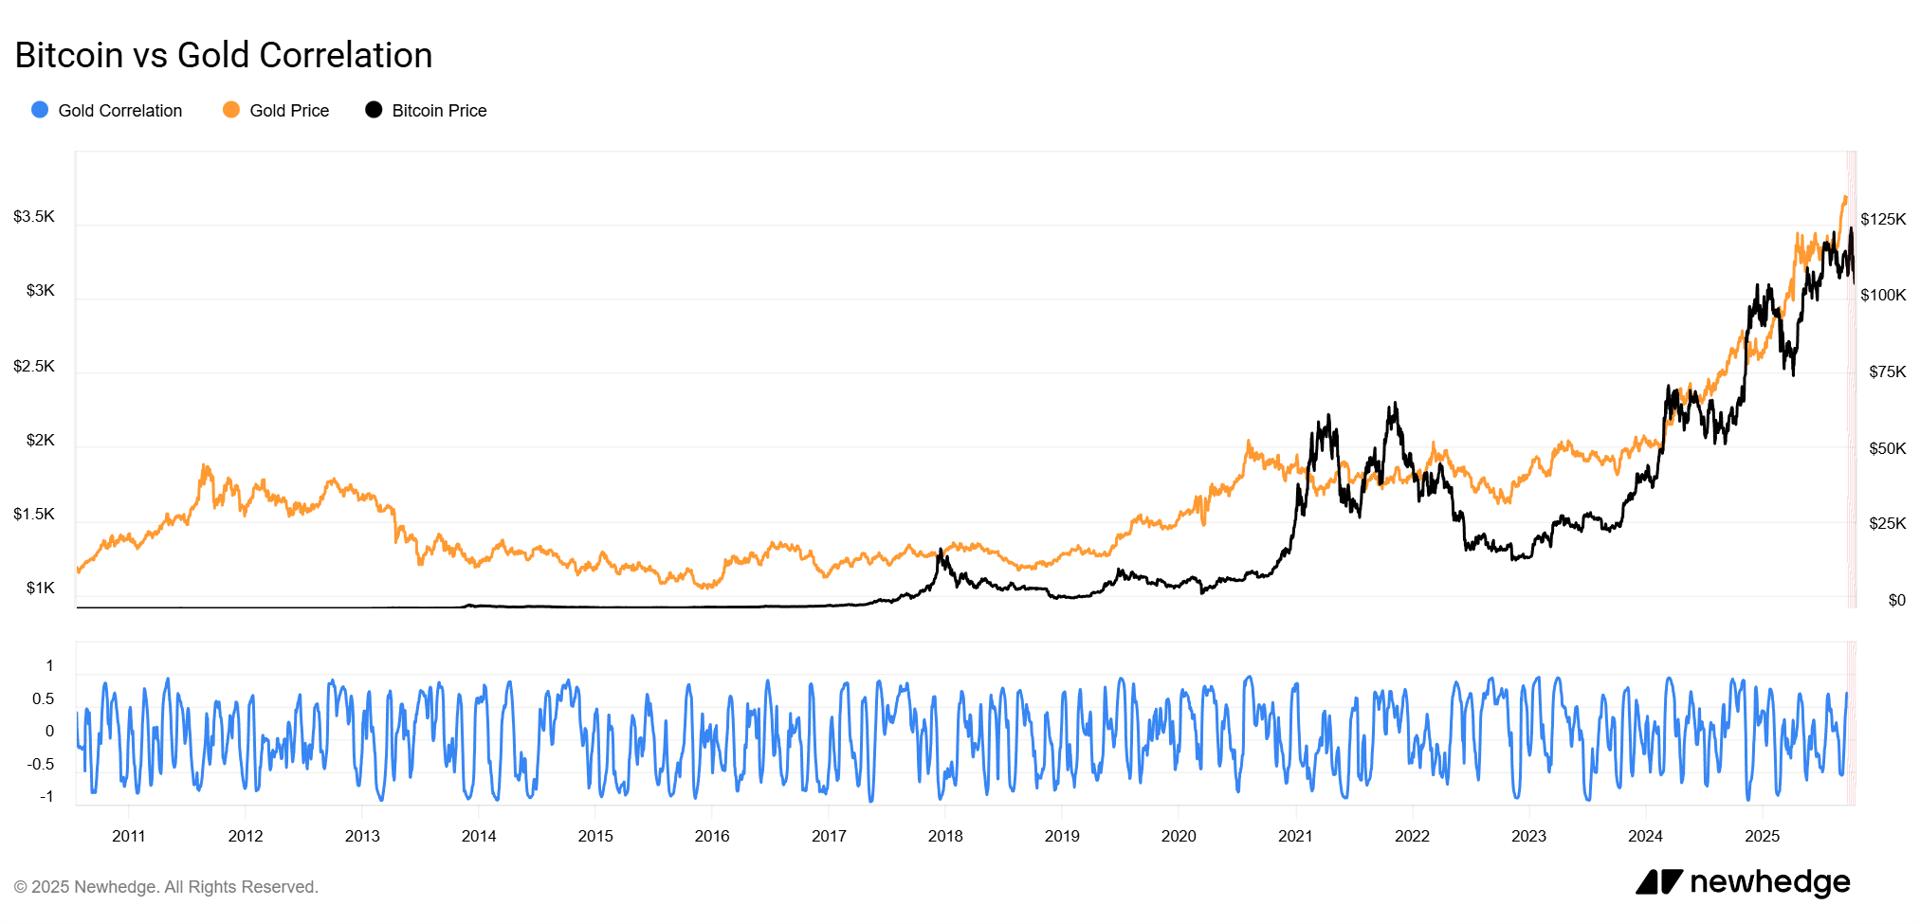
Gold-Bitcoin Correlation
Drives Synchronized Selloff
The
increasingly tight correlation between gold and Bitcoin, rising from
negative 0.8 in October 2021 to current levels of 0.85, explains why
both assets experienced simultaneous pressure.
Mostafa
Al-Mashita, Co-founder & Director of Sales and Trading at Secure
Digital Markets, provided exclusive analysis: “Gold’s loss of neutrality
and Bitcoin’s rise as a borderless asset mark a fundamental shift in
global value dynamics. The recent gold sell-off, though expected after an
extended rally, underscores how traditional havens are becoming tools
of policy rather than stores of neutrality”.
He
continued: “Nations like China, India, and Turkey are stockpiling gold
to reduce reliance on the US dollar, turning it into a geopolitical
instrument tied to state agendas. Bitcoin, though increasingly adopted by
institutions and states, remains structurally decentralized and resistant to
control. It signals economic independence while functioning as both a
volatile trading vehicle and a modern store of value. This isn’t simply
gold versus Bitcoin; it’s a broader reallocation of trust, with
governments asserting sovereignty through gold and individuals and institutions
seeking autonomy through Bitcoin”.
Initially
on Tuesday, Bitcoin actually surged as gold crashed, briefly jumping above
$113,000 as traders rotated capital from precious metals into crypto. Analyst
Ash Crypto declared “the rotation from gold to Bitcoin has begun,”
while Swissblock research pointed to similar patterns in April when gold
fell 5% over three days before Bitcoin rallied from its macro bottom.
However, this rotation proved short-lived as broader risk-off sentiment
eventually pulled Bitcoin lower.
Gold Technical Analysis
and Price Outlook
After
reaching new all-time highs in the daily chart, gold stalled at resistance
around $4,350 per ounce, which after several sessions of
accumulation triggered dynamic depreciation on Monday with a drop
exceeding 5% to $4,124 per ounce. According to my technical analysis, tuesday
brought continued declines of 1.5% and a test of the psychological $4,000
level. At the time of writing, the metal was changing hands at $4,062, bouncing
slightly from local support defined by the all-time highs from October
8-9.
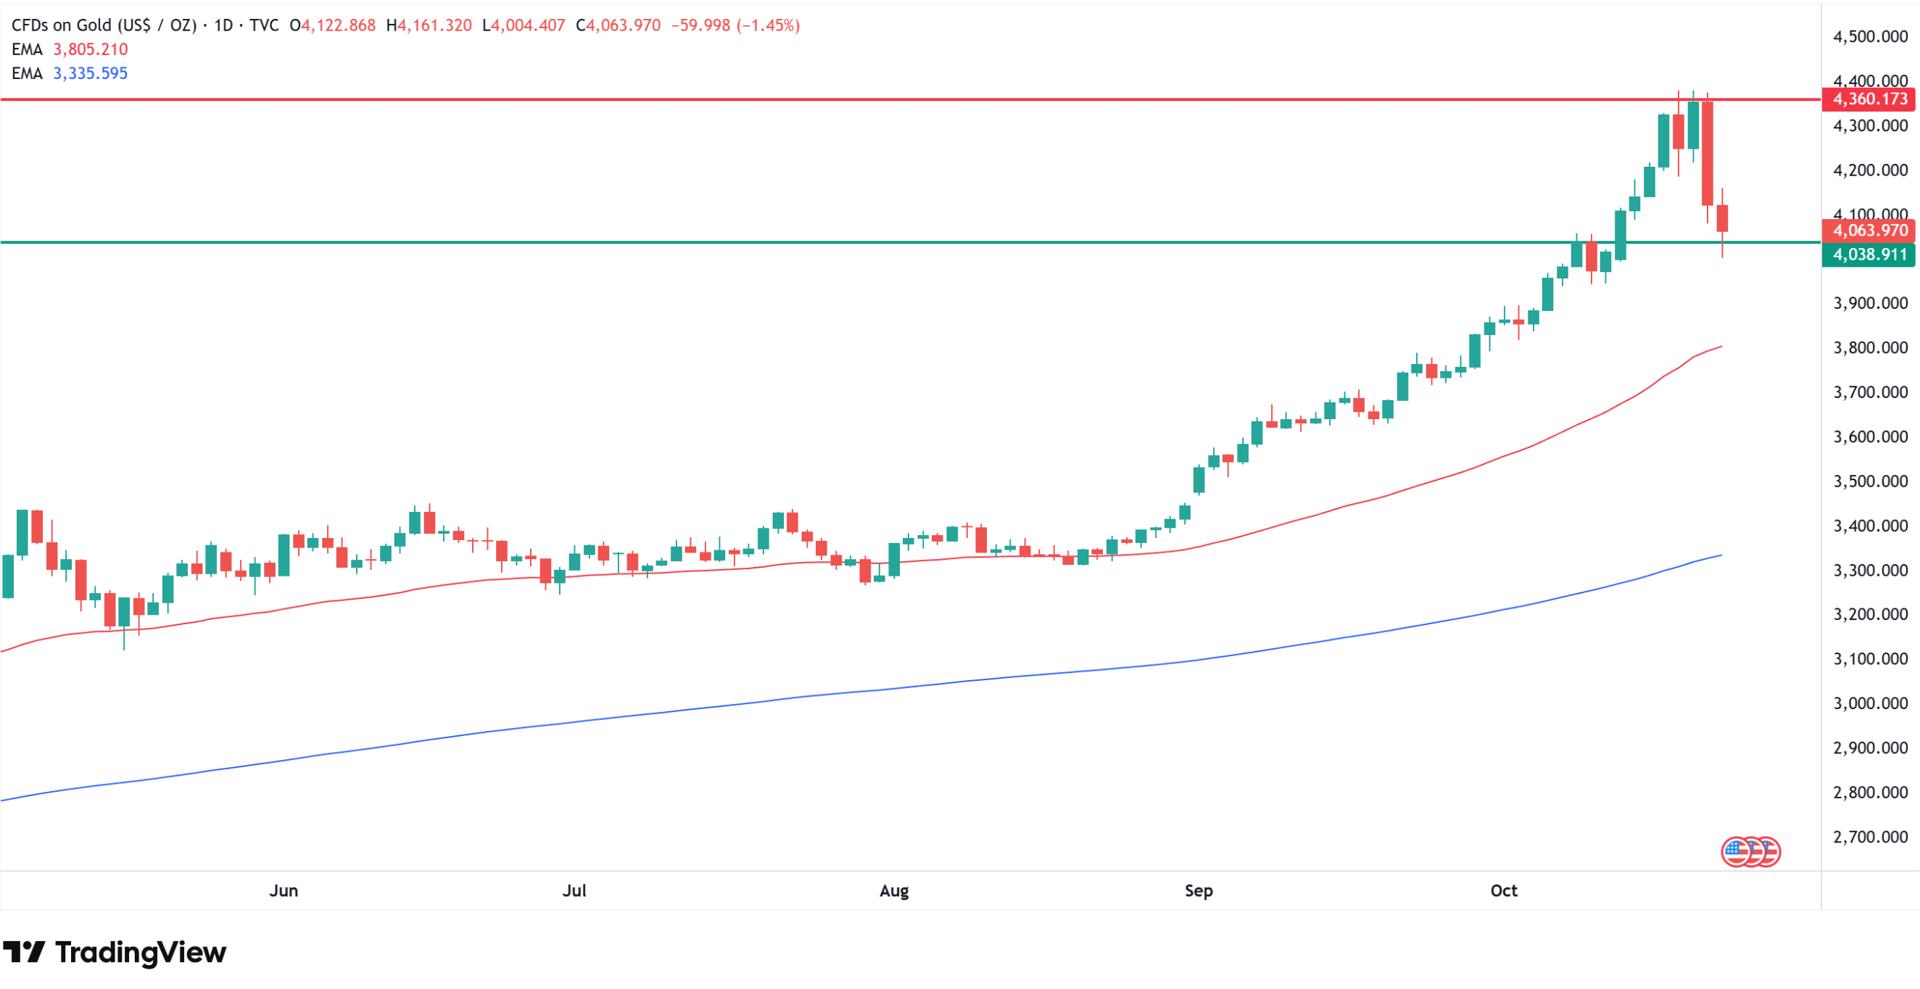
Gold has
significantly more room for correction, and I would not rule out a descent
toward $3,400, the 200-day exponential moving average, before a
stronger rebound materializes. The $2.1 trillion in market
capitalization erased on Tuesday alone, equivalent to 55% of the entire
cryptocurrency market’s value according to trader Peter Brandt, demonstrates
the magnitude of this correction.
Critical Support and
Resistance Levels
Gold Technical Levels:
- Immediate resistance: $4,200-$4,235 marking
previous consolidation highs - Current price: $4,062 with slight bounce
from October 8-9 ATH support - Psychological support: $4,000 round number
testing investor confidence - Key support zone: $4,035 representing near-term
floor - Bearish invalidation: $3,965 breakdown would
confirm deeper correction - Major correction target: $3,400 aligning with 200-day
EMA
Bitcoin Technical Levels:
- Consolidation resistance: $110,000-$113,000 upper
boundary tested Monday - Current price: $108,342 retesting critical
support zone - Key support: $108,000 coinciding with late
August lows and consolidation floor - Bull trend support: 200-day EMA maintaining
bullish structure - Psychological level: $100,000 major
support if current range breaks
Historical Crash
Comparison: Bitcoin, Gold and Silver
|
Event |
Date |
Decline |
Recovery Time |
Cause |
|
Gold Crash |
August 2020 |
-6.3% |
3 months |
Cyprus |
|
Gold Crash |
Oct 21, 2025 |
-5.6% |
TBD |
Profit-taking, dollar strength |
|
Silver Crash |
Feb 2021 |
-8.7% |
6 weeks |
Reddit squeeze unwind |
|
Bitcoin Crash |
Oct 10, 2025 |
-14% |
2 weeks |
Leverage liquidation |
|
Gold Correction |
Aug 2020 |
-5.0% |
4 months |
Post-COVID rally exhaustion |
Bitcoin and Gold Price
Analysis, Frequently Asked Questions
Why did gold crash 5%
on October 21, 2025?
Gold
crashed 5-6% due to profit-taking after a 60% rally in 2025, combined with
a stronger US dollar, easing US-China trade tensions, and
technical correction from overbought conditions following $34.2 billion in
precious metals inflows over ten weeks.
When was the last time
gold fell this much in one day?
The last
time gold experienced a comparable or larger single-day decline was August 2020,
when it dropped 5.7% during the Cyprus banking crisis and Federal Reserve
tapering concerns.
Why is Bitcoin
falling with gold?
Bitcoin
fell alongside gold because the correlation between the two assets reached
0.85, near the all-time high of 0.9, causing synchronized selling
pressure as investors treated both as linked safe-haven assets.
Is the gold rally
over?
Analysts view
this as a technical correction rather than the end of the bull market,
with gold potentially correcting toward $3,400 (the 200-day EMA) before
resuming its uptrend, though the rally’s pace needed to slow from unsustainable
levels.
Why Bitcoin is crashing?
Bitcoin
remains in a technical bull trend as long as the 200-day EMA
holds as support around $108,000, though a breakdown below this level
would open the path to testing $100,000 psychological support before
a potential recovery.
What caused silver to
drop 8.7%?
Silver
crashed 8.7% in its worst day since February 2021 due to the same
factors affecting gold—profit-taking, dollar strength, and easing
geopolitical tensions—amplified by silver’s higher volatility and smaller
market size.
Gold price experienced
its most severe single-day collapse in over five years this week, plunging more
than 5% from record highs and dragging Bitcoin (BTC) lower in a synchronized
selloff that erased billions in market capitalization.
The
precious metal fell from Monday’s all-time peak of $4,381 per ounce to an
intraday low of $4,082, marking the steepest decline since August 2020’s 5.7%
crash. Bitcoin simultaneously dropped over 2%, falling from $110,000
levels to test critical support at $108,000 as the correlation between
digital and physical safe-haven assets reached 0.85.
The gold
crash followed an unsustainable rally that saw
prices surge 60% throughout 2025 and 25% in just the previous two
months, creating what analysts described as “stratosphere” conditions
ripe for correction.
Standard
Chartered analyst Suki Cooper characterized the movement as a “technical
correction” after record-breaking precious metals inflows totaling
$34.2 billion over ten weeks pushed the market into severely overbought
territory. Bart Melek, global head of commodity strategy at TD Securities,
confirmed dealers were “realizing gains after a strong
rally” that proved unsustainable long-term.
Profit-taking
accelerated as
the US dollar index strengthened 0.4%, making gold more expensive for
international buyers and reducing its appeal against competing assets. The
timing coincided with renewed optimism over US-China trade negotiations, with
President Trump expressing confidence about reaching a deal with Chinese
President Xi Jinping at their scheduled meeting. This easing of geopolitical
tensions diminished safe-haven demand that had propelled gold to consecutive
record highs.
Physical
demand also weakened following the conclusion of the Diwali festival in India,
the world’s second-largest gold consumer, removing a significant source of
buying pressure. Silver crashed even harder at 8.7% in its
worst single-day drop since February 2021, while platinum fell 5-7%,
confirming the broad-based precious metals correction.
Why Bitcoin Price Is Going
Down Today?
Bitcoin’s
decline mirrored gold’s weakness as the strengthening correlation
between the two assets, currently at 0.85, near the all-time high of 0.9
reached in April 2024, caused synchronized selling pressure. The cryptocurrency
ended Tuesday’s session at $108,342, dropping over 2% and retesting local
support around the $108,000 level that coincides with late August lows and
marks the lower boundary of the months-long consolidation range.
From my
technical analysis of Bitcoin’s chart, the price attempted to strengthen
on Monday before ultimately pulling back sharply in direct reaction to
gold’s crash. Bitcoin tested the critical support zone around $108,000,
which aligns with late August lows and represents the lower boundary of the
consolidation drawn since mid-October.
Importantly,
the 200-day exponential moving average continues to provide support,
meaning we remain technically in a bull trend. However, a breakdown below
this range would open the door to further declines and a test of the
$100,000 level, a major psychological support zone.
Paul Howard
from Wincent noted that “many analysts follow technical trends
including M2 money supply, gold, stock2flow models plus other metrics as
ways to predict Bitcoin’s next move. Arguably many now indicate a big
upswing and with so many leveraged longs and shorts liquidated, and a positive
global macro environment may see Bitcoin as a gold laggard”. The
comment highlights how Bitcoin’s underperformance relative to gold’s
earlier rally may reverse following the liquidation cleanup.
Please also check my previous articles including Bitcoin and gold price predictions:
Key Market Indicators for
Gold and Bitcoin
|
Metric |
Value |
Change |
Significance |
|
Gold Price (Oct 22) |
$4,082 |
-5.6% |
Worst drop since August 2020 |
|
Bitcoin Price (Oct 22) |
$108,342 |
-2.1% |
Testing August support levels |
|
Silver Price |
$51.89 |
-8.7% |
Worst drop since February 2021 |
|
Gold-Bitcoin Correlation |
0.85 |
Near ATH |
Explaining synchronized selloff |
|
US Bitcoin ETF Flows |
-$40.47M |
Outflows |
Institutional caution |
|
Crypto Market Cap |
$3.76T |
-2.3% |
Broad-based decline |
Gold-Bitcoin Correlation
Drives Synchronized Selloff
The
increasingly tight correlation between gold and Bitcoin, rising from
negative 0.8 in October 2021 to current levels of 0.85, explains why
both assets experienced simultaneous pressure.
Mostafa
Al-Mashita, Co-founder & Director of Sales and Trading at Secure
Digital Markets, provided exclusive analysis: “Gold’s loss of neutrality
and Bitcoin’s rise as a borderless asset mark a fundamental shift in
global value dynamics. The recent gold sell-off, though expected after an
extended rally, underscores how traditional havens are becoming tools
of policy rather than stores of neutrality”.
He
continued: “Nations like China, India, and Turkey are stockpiling gold
to reduce reliance on the US dollar, turning it into a geopolitical
instrument tied to state agendas. Bitcoin, though increasingly adopted by
institutions and states, remains structurally decentralized and resistant to
control. It signals economic independence while functioning as both a
volatile trading vehicle and a modern store of value. This isn’t simply
gold versus Bitcoin; it’s a broader reallocation of trust, with
governments asserting sovereignty through gold and individuals and institutions
seeking autonomy through Bitcoin”.
Initially
on Tuesday, Bitcoin actually surged as gold crashed, briefly jumping above
$113,000 as traders rotated capital from precious metals into crypto. Analyst
Ash Crypto declared “the rotation from gold to Bitcoin has begun,”
while Swissblock research pointed to similar patterns in April when gold
fell 5% over three days before Bitcoin rallied from its macro bottom.
However, this rotation proved short-lived as broader risk-off sentiment
eventually pulled Bitcoin lower.
Gold Technical Analysis
and Price Outlook
After
reaching new all-time highs in the daily chart, gold stalled at resistance
around $4,350 per ounce, which after several sessions of
accumulation triggered dynamic depreciation on Monday with a drop
exceeding 5% to $4,124 per ounce. According to my technical analysis, tuesday
brought continued declines of 1.5% and a test of the psychological $4,000
level. At the time of writing, the metal was changing hands at $4,062, bouncing
slightly from local support defined by the all-time highs from October
8-9.
Gold has
significantly more room for correction, and I would not rule out a descent
toward $3,400, the 200-day exponential moving average, before a
stronger rebound materializes. The $2.1 trillion in market
capitalization erased on Tuesday alone, equivalent to 55% of the entire
cryptocurrency market’s value according to trader Peter Brandt, demonstrates
the magnitude of this correction.
Critical Support and
Resistance Levels
Gold Technical Levels:
- Immediate resistance: $4,200-$4,235 marking
previous consolidation highs - Current price: $4,062 with slight bounce
from October 8-9 ATH support - Psychological support: $4,000 round number
testing investor confidence - Key support zone: $4,035 representing near-term
floor - Bearish invalidation: $3,965 breakdown would
confirm deeper correction - Major correction target: $3,400 aligning with 200-day
EMA
Bitcoin Technical Levels:
- Consolidation resistance: $110,000-$113,000 upper
boundary tested Monday - Current price: $108,342 retesting critical
support zone - Key support: $108,000 coinciding with late
August lows and consolidation floor - Bull trend support: 200-day EMA maintaining
bullish structure - Psychological level: $100,000 major
support if current range breaks
Historical Crash
Comparison: Bitcoin, Gold and Silver
|
Event |
Date |
Decline |
Recovery Time |
Cause |
|
Gold Crash |
August 2020 |
-6.3% |
3 months |
Cyprus |
|
Gold Crash |
Oct 21, 2025 |
-5.6% |
TBD |
Profit-taking, dollar strength |
|
Silver Crash |
Feb 2021 |
-8.7% |
6 weeks |
Reddit squeeze unwind |
|
Bitcoin Crash |
Oct 10, 2025 |
-14% |
2 weeks |
Leverage liquidation |
|
Gold Correction |
Aug 2020 |
-5.0% |
4 months |
Post-COVID rally exhaustion |
Bitcoin and Gold Price
Analysis, Frequently Asked Questions
Why did gold crash 5%
on October 21, 2025?
Gold
crashed 5-6% due to profit-taking after a 60% rally in 2025, combined with
a stronger US dollar, easing US-China trade tensions, and
technical correction from overbought conditions following $34.2 billion in
precious metals inflows over ten weeks.
When was the last time
gold fell this much in one day?
The last
time gold experienced a comparable or larger single-day decline was August 2020,
when it dropped 5.7% during the Cyprus banking crisis and Federal Reserve
tapering concerns.
Why is Bitcoin
falling with gold?
Bitcoin
fell alongside gold because the correlation between the two assets reached
0.85, near the all-time high of 0.9, causing synchronized selling
pressure as investors treated both as linked safe-haven assets.
Is the gold rally
over?
Analysts view
this as a technical correction rather than the end of the bull market,
with gold potentially correcting toward $3,400 (the 200-day EMA) before
resuming its uptrend, though the rally’s pace needed to slow from unsustainable
levels.
Why Bitcoin is crashing?
Bitcoin
remains in a technical bull trend as long as the 200-day EMA
holds as support around $108,000, though a breakdown below this level
would open the path to testing $100,000 psychological support before
a potential recovery.
What caused silver to
drop 8.7%?
Silver
crashed 8.7% in its worst day since February 2021 due to the same
factors affecting gold—profit-taking, dollar strength, and easing
geopolitical tensions—amplified by silver’s higher volatility and smaller
market size.
Search
RECENT PRESS RELEASES
Live: Crypto Market Continues Decline as Bitcoin Holds Near $108,000 on Oct. 22
SWI Editorial Staff2025-10-22T04:46:23-07:00October 22, 2025|
Crypto Goes Mainstream: Fed Governor Admits Bitcoin is Now Part of the Financial Fabric
SWI Editorial Staff2025-10-22T04:46:02-07:00October 22, 2025|
Crypto Goes Mainstream: Fed Governor Admits Bitcoin is Now Part of the Financial Fabric
SWI Editorial Staff2025-10-22T04:45:48-07:00October 22, 2025|
Why Gold Price Is Falling the Most Since 2020? The Crash Is Dragging Bitcoin Down Too
SWI Editorial Staff2025-10-22T04:45:37-07:00October 22, 2025|
Why Gold Price Is Falling the Most Since 2020? The Crash Is Dragging Bitcoin Down Too
SWI Editorial Staff2025-10-22T04:45:21-07:00October 22, 2025|
People Moves: Pyfrom Named Starwind Cannabis EVP of Sales and Distribution; Golden Bear Ad
SWI Editorial Staff2025-10-22T04:45:04-07:00October 22, 2025|
Related Post


