Ethereum Breakout Targets $10K on Impending Fed Cut
October 27, 2025
Ethereum’s bullish outlook is backed by a confluence of improving macroeconomic conditions, strong whale activity signaling confidence, and a robust technical setup indicating a powerful upward trajectory.
Will these be the catalysts that finally catapult Ether to $10,000?
99% Chance Fed Cuts by 25bps
The macroeconomic landscape is increasingly supportive of risk assets like Ethereum. On Friday, the US Consumer Price Index (CPI) report for September came in softer than expected, signaling cooling inflation pressures. This development bolsters expectations for a more accommodative monetary policy, which typically benefits high-growth assets like cryptocurrencies.
A lower CPI reading reduces the likelihood of aggressive rate hikes, creating a favorable environment for ETH price appreciation.
Additionally, optimism surrounding a potential US-China trade deal has further buoyed market sentiment. Recent diplomatic talks have hinted at easing trade tensions, which could stabilize global markets and encourage investment in riskier assets. A trade deal would likely reduce economic uncertainty, driving capital flow into cryptocurrencies as investors seek higher returns in a less volatile global economy.
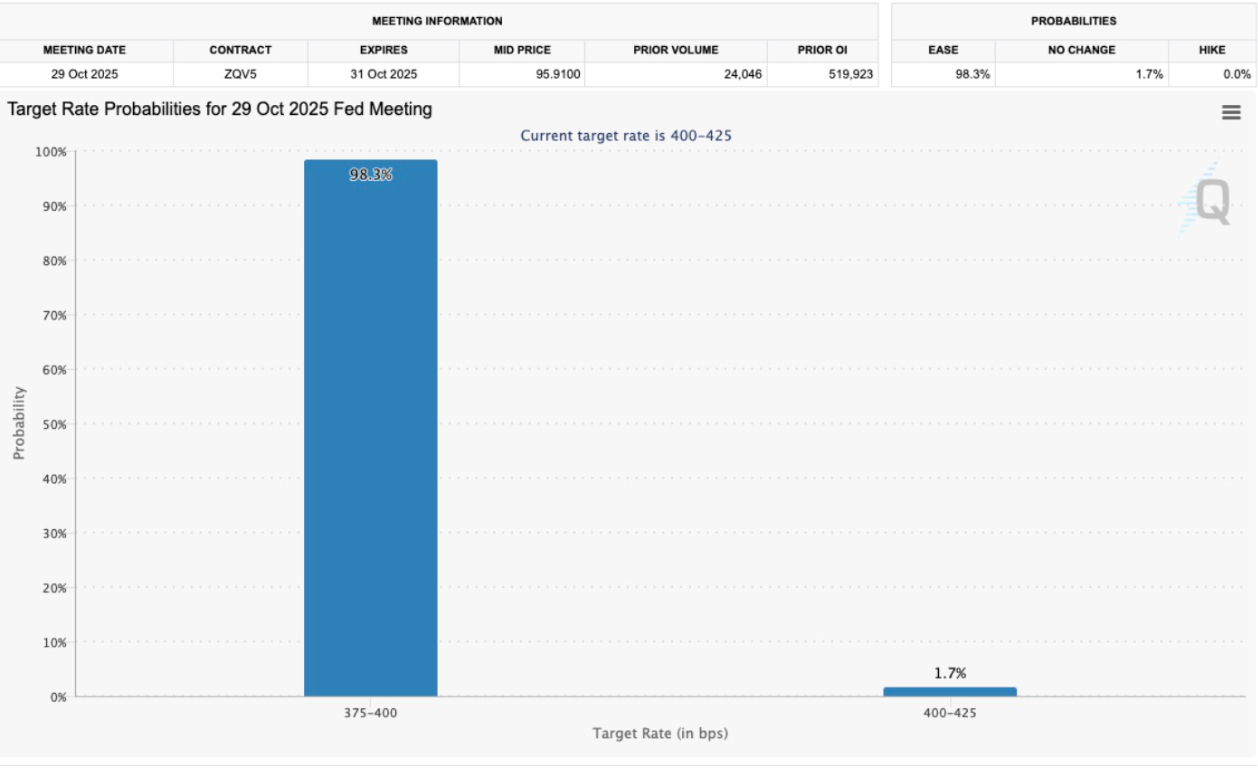
The most immediate catalyst, however, is the near-certain 25 bps rate cut expected at the Federal Reserve’s October 29th FOMC meeting.
According to the CME FedWatch Tool, the probability of this rate cut stands at 99%, reflecting an extremely strong market consensus.
Target rate probabilities for Oct. 29 FOMC meeting. Source: CME Group Fed Watch tool
Lower interest rates reduce the opportunity cost of holding non-yielding assets like Ethereum, making it more attractive to investors. Combined with the softer CPI and improving US-China relations, these macroeconomic tailwinds are setting the stage for a significant ETH rally.
Whales Reinforce Bullish Conviction with Massive ETH Long Bet
Institutional and large-scale investors, often referred to as “whales,” are doubling down on Ether’s bullish outlook. A notable example is a smart trader with a 100% win rate who increased their long position in ETH to 33,270 ETH, which is worth roughly $131.24 million at the current rates, according to data from Lookonchain.
Source: Lookonchain
The trader has also opened a 4X long on 80 BTC, valued at $8.9 million, with an entry price of $110,900 per Bitcoin.
This substantial bet underscores the growing confidence among deep-pocketed investors in Ethereum’s near-term price appreciation.
“In the past 2 weeks, he’s already pocketed $16M in profit,” said X user Discover, referring to the trader’s winning streak, adding:
“Looks like he’s betting big on the next Ethereum pump.”
Whale activity is a critical indicator in the crypto market, as these players often have access to sophisticated market insights and can influence price movements.
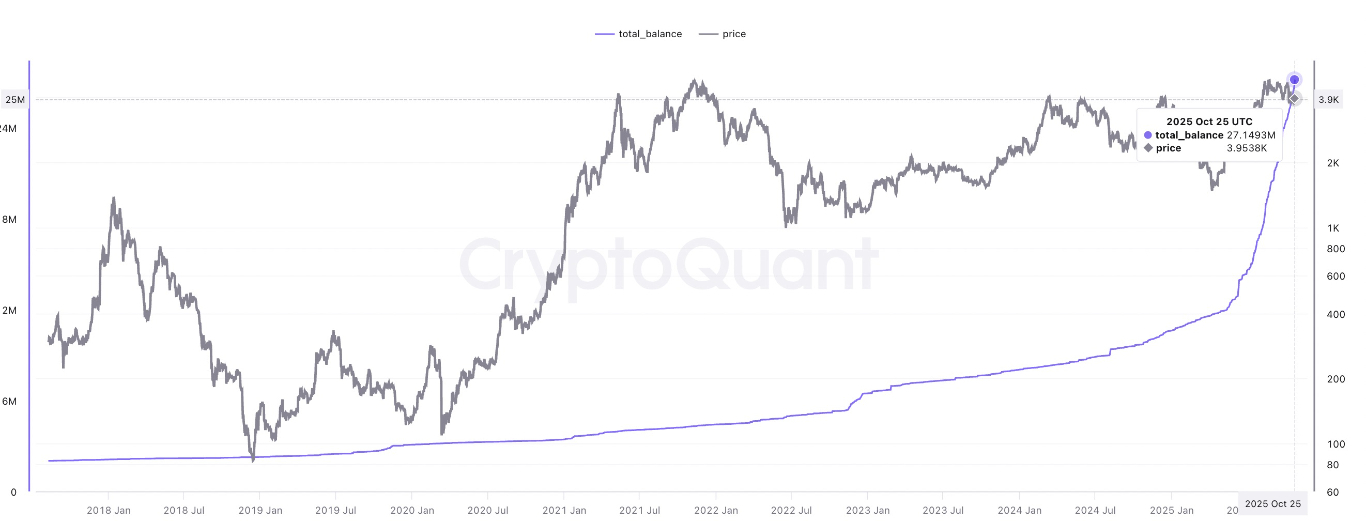
Furthermore, onchain data from platforms like Glassnode shows increased accumulation by large holders, with ETH accumulation addresses hitting a record 27.15 million tokens on Oct. 25.
ETH accumulation addresses. Source: CryptoQuant
This accumulation trend suggests that whales are positioning themselves for a breakout, a sign of confidence and long-term conviction in the market.
Meanwhile, Ethereum’s growing appeal as a store of value and a platform for decentralized finance (DeFi) and non-fungible tokens (NFTs) also adds to its tailwinds. With Ethereum’s network upgrades, such as the transition to Ethereum 2.0 and ongoing scalability improvements, institutional investors are increasingly viewing ETH as a long-term investment with strong fundamentals.
Ether’s Bull Flag Targets $9,500
From a technical perspective, Ethereum’s price chart exhibits a classic bullish pattern that projects an explosive upward price move.
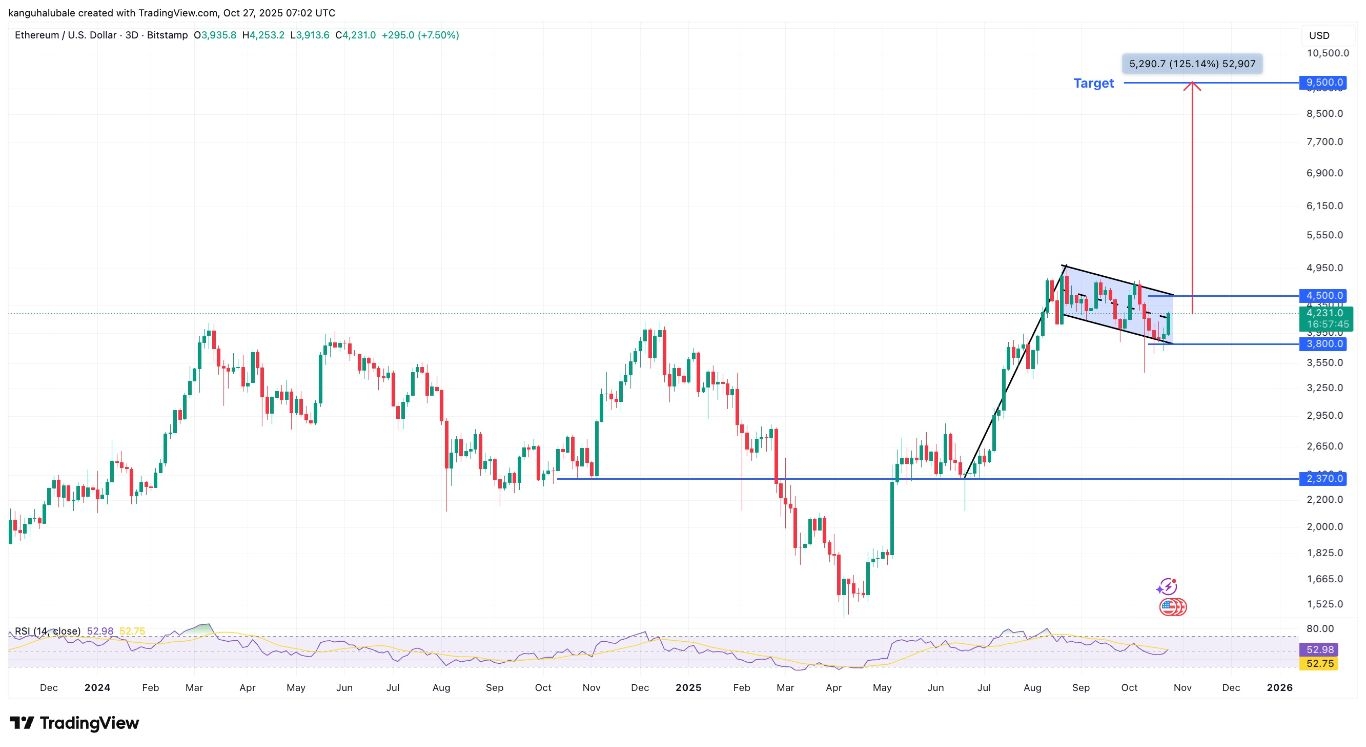
Ether’s price action has formed a bull flag chart pattern in the weekly time frame, as shown in the chart below.
A bull flag is an upward continuation pattern that typically precedes significant upward price movements. The bull flag consists of a sharp upward move (the flagpole) followed by a period of consolidation (the flag), which Ethereum has been forming over the past few weeks.
A weekly candlestick close above the flag’s upper boundary at $4,500 would confirm a bullish breakout. The measured target of the bull flag is $9,500, representing 125% uptick from the current price.
ETH/USD three-day chart. Source: TradingView
This target is calculated by projecting the height of the flagpole from the breakout point, a standard method in technical analysis. The pattern is supported by strong trading volume, with buying pressure increasing as ETH trades above the key $4,000 support line.
Additional technical indicators reinforce the bullish setup. The relative strength index (RSI) is trending upward, indicating that upward momentum is slowly building.
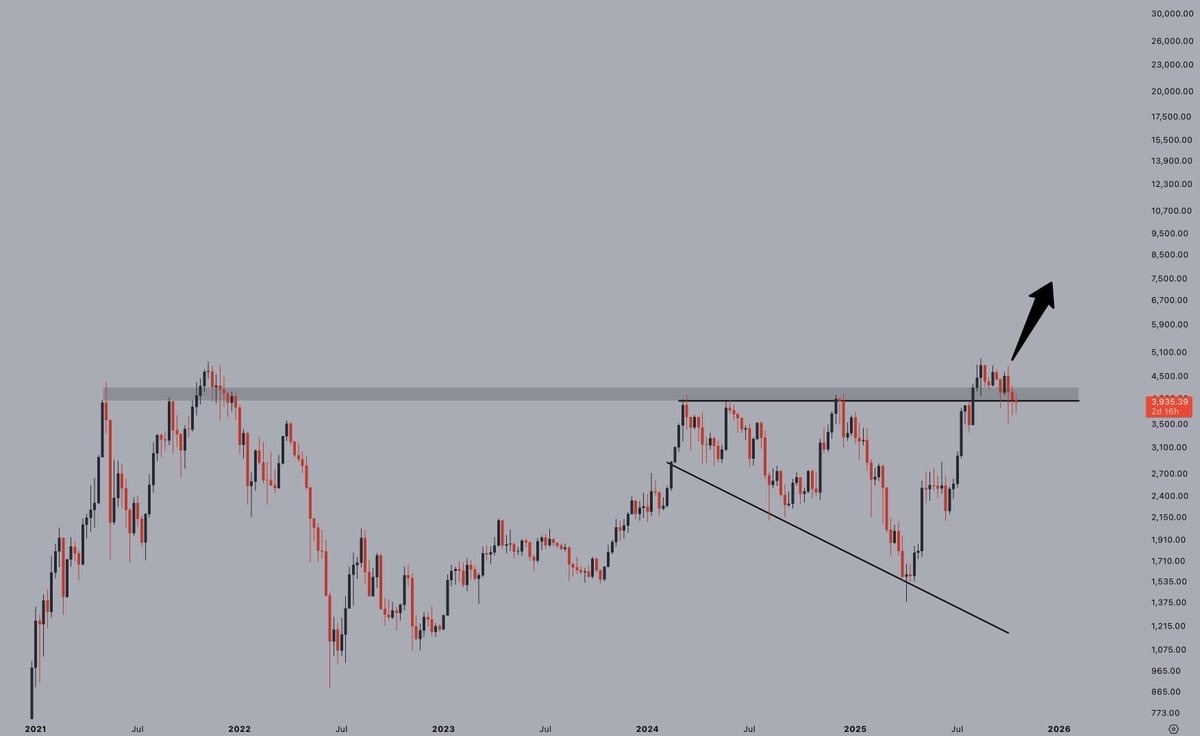
“$ETH is doing what it does best,” said popular trader Jelle in a Sunday post on X, adding that it is just a matter of time before the altcoin enters price discovery as long as it holds previous highs.
“The target remains $10K.”
ETH/USD weekly chart. Source: Jelle
A powerful combination of macroeconomic tailwinds, whale conviction, and a compelling technical setup suggests Ether is well-positioned for a breakout, making it a focal point for investors in the crypto market.
Ready to trade our technical analysis of Ethereum? Here’s our list of the best MT4 crypto brokers worth checking out.
Search
RECENT PRESS RELEASES
Related Post
