Amazon AMZN Margin Expansion Challenges Skeptics On Earnings Quality Concerns
February 7, 2026
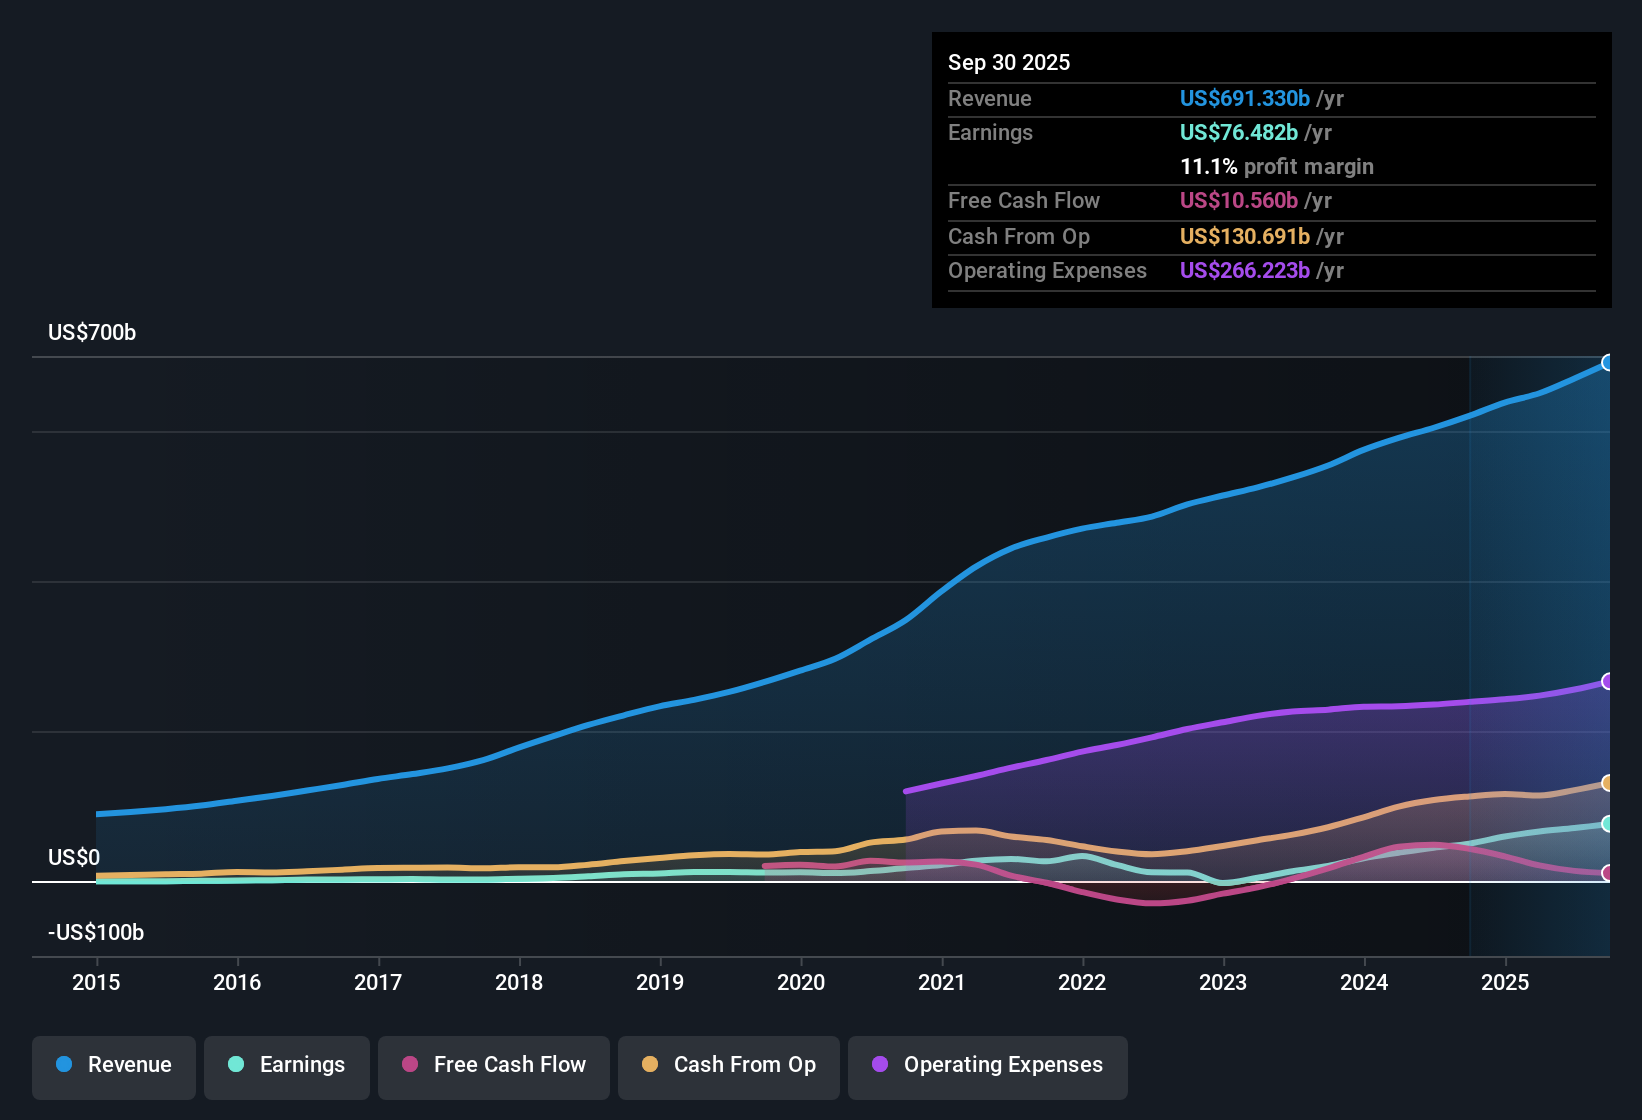
Amazon.com (AMZN) just wrapped up FY 2025 with Q4 revenue of US$213.4b and basic EPS of US$1.98, alongside Q4 net income of US$21.2b, all set against trailing 12 month revenue of US$716.9b and basic EPS of US$7.29. The company has seen quarterly revenue move from US$187.8b in Q4 2024 to US$213.4b in Q4 2025, while basic EPS went from US$1.90 to US$1.98 over the same period. Trailing net profit margin at 10.8% versus 9.3% a year earlier frames a story of earnings power that investors will likely weigh against how sustainable current margins look.
See our full analysis for Amazon.com.
With the headline numbers on the table, the next step is to see how this earnings picture lines up with the most common narratives around Amazon.com, and where the data may push investors to rethink the story.
Curious how numbers become stories that shape markets? Explore Community Narratives
Advertisement
Margins Build On 10.8% Profit Level
- Trailing 12 month net income is US$77.7b on US$716.9b of revenue, which works out to a 10.8% net profit margin compared with 9.3% a year earlier in the same trailing window.
- What supports a bullish angle here is that earnings over the last 12 months rose 31.1% while this 10.8% margin sits above the prior 9.3% level, yet:
- That 31.1% earnings growth is slightly below the 5 year average of 32.8% a year, so bulls have to argue the margin step up matters more than the slower pace.
- The basic EPS trend from US$4.78 to US$7.29 over the last six trailing quarters backs the view that profitability has scaled, even if future growth is forecast at a lower 16.8% a year.
Valuation Sits Between P/E Premium And DCF Gap
- At a share price of US$210.32 and trailing EPS of US$7.29, the P/E is about 29.1x, above the 18.4x North American Multiline Retail average but a bit below the 30.9x peer group. The DCF fair value supplied is US$421.06, roughly double the current price.
- What makes the bullish case interesting is this mix of a premium P/E and a large DCF gap, because:
- The stock trades around 50% below the US$421.06 DCF fair value, which supports bulls who point to a long runway for earnings that forecasts put at about 16.8% a year.
- At the same time, the 29.1x P/E already sits well above the 18.4x industry level, so critics can argue that some of that optimism is already reflected compared with the wider retail group.
Analysts who see room between the current US$210.32 price, the US$285.08 target, and the US$421.06 DCF fair value will often want to see how that gap is explained across different scenarios, so it can be helpful to review a full valuation breakdown before making any moves. See our AI narrative and valuation for Amazon.com.
Earnings Quality Flagged By Non Cash Items
- Alongside the 31.1% earnings growth and 10.8% net margin, the analysis flags a major risk that a high share of reported earnings comes from non cash items, which can affect how durable those US$77.7b of trailing profits look.
- Bears focus on this non cash tilt because it can weaken the headline story, even with solid growth numbers:
- The combination of 10.2% revenue growth and 31.1% earnings growth can look very strong on paper, but if a meaningful slice is non cash, skeptics question how much of that flows into cash generation over time.
- With the share price at US$210.32 and the P/E at 29.1x, critics argue that any adjustment to strip out non cash components could leave the stock looking more expensive relative to earnings that are backed by cash flows.
Next Steps
Don’t just look at this quarter; the real story is in the long-term trend. We’ve done an in-depth analysis on Amazon.com’s growth and its valuation to see if today’s price is a bargain. Add the company to your watchlist or portfolio now so you don’t miss the next big move.
See What Else Is Out There
For all the strong headlines, the reliance on non cash earnings and a P/E of 29.1x versus the 18.4x industry level leaves valuation risk on the table.
If that kind of pricing risk makes you cautious, use our 86 resilient stocks with low risk scores to quickly focus on companies where lower risk scores help balance your portfolio today.
This article by Simply Wall St is general in nature. We provide commentary based on historical data
and analyst forecasts only using an unbiased methodology and our articles are not intended to be financial advice. It does not constitute a recommendation to buy or sell any stock, and does not take account of your objectives, or your
financial situation. We aim to bring you long-term focused analysis driven by fundamental data.
Note that our analysis may not factor in the latest price-sensitive company announcements or qualitative material.
Simply Wall St has no position in any stocks mentioned.
New: Manage All Your Stock Portfolios in One Place
We’ve created the ultimate portfolio companion for stock investors, and it’s free.
• Connect an unlimited number of Portfolios and see your total in one currency
• Be alerted to new Warning Signs or Risks via email or mobile
• Track the Fair Value of your stocks
Have feedback on this article? Concerned about the content? Get in touch with us directly. Alternatively, email editorial-team@simplywallst.com
Search
RECENT PRESS RELEASES
Related Post


