A Short History of Stock Market Pullbacks – A Wealth of Common Sense
March 24, 2026
There’s a lot going on in the world right now.
War, spiking oil prices, higher energy costs, rising inflation expectations, a potential pause in Fed rate cuts, the AI buildout, a slowing labor market, the software apocalypse and more.
And the collective response from the stock market has been a relatively shallow correction thus far.
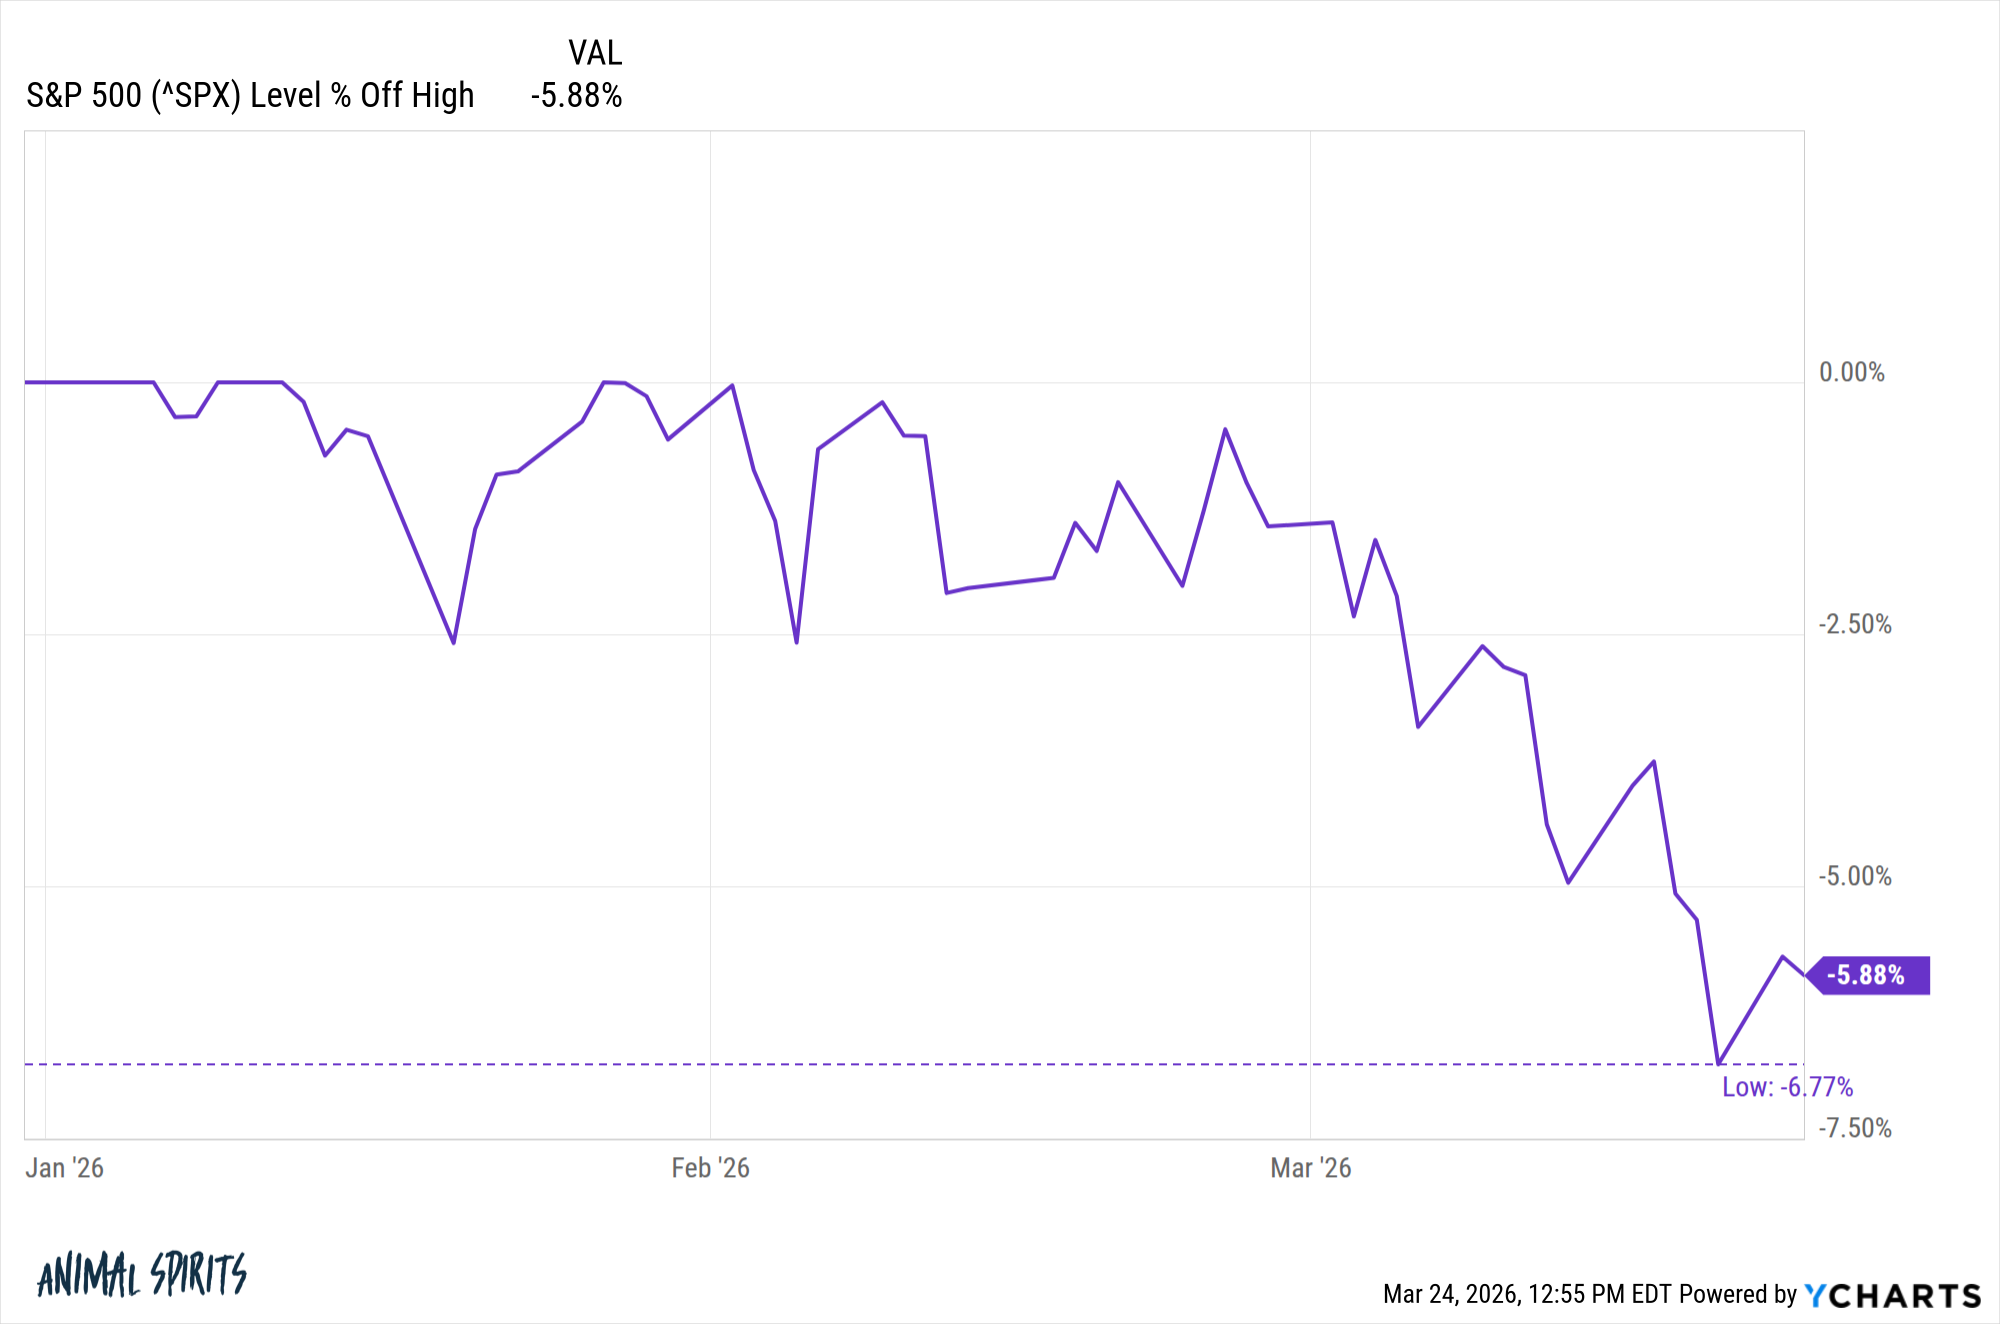
The S&P 500 was down just 6.8% from the highs at the lowest point this year:
In the words of Derek Zoolander:
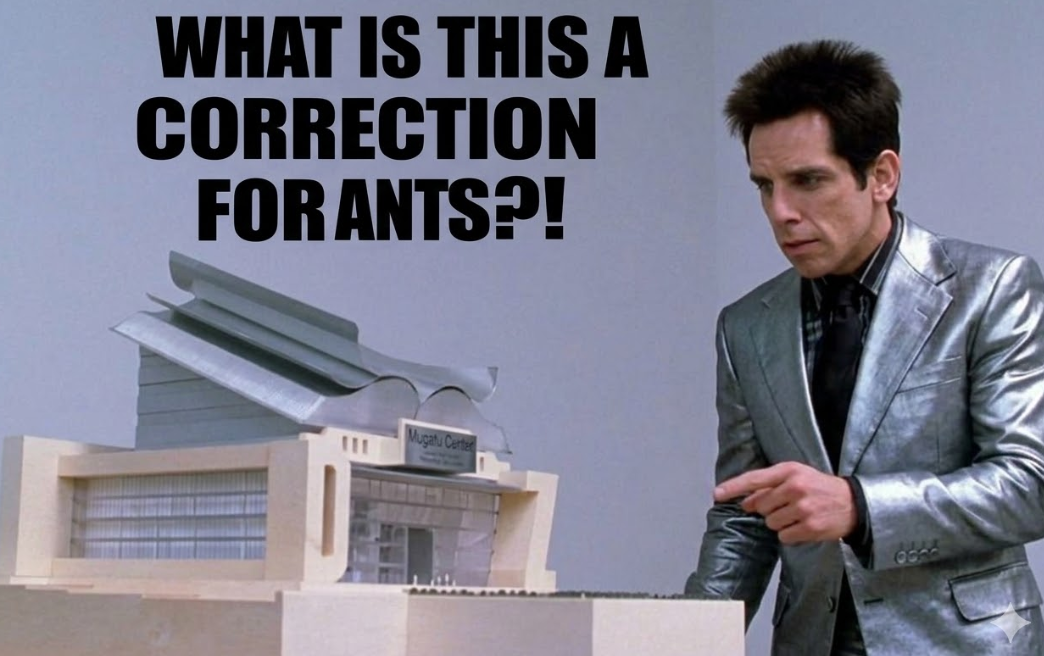
It feels like this drawdown should be worse than this given everything going on in the world.
In fact, you can’t even call this a correction just yet. It’s a pullback.
Here’s my unscientific definition for stock market downturns:
-5% = pullback
-10% = healthy correction
-15% = correction
-20% = bear market
-30% = collapse
-40% = crash
-50% = crisis
Pullbacks happen quite frequently. Here’s the number of 5% pullbacks by year going back to 1990 from Exhibit A:
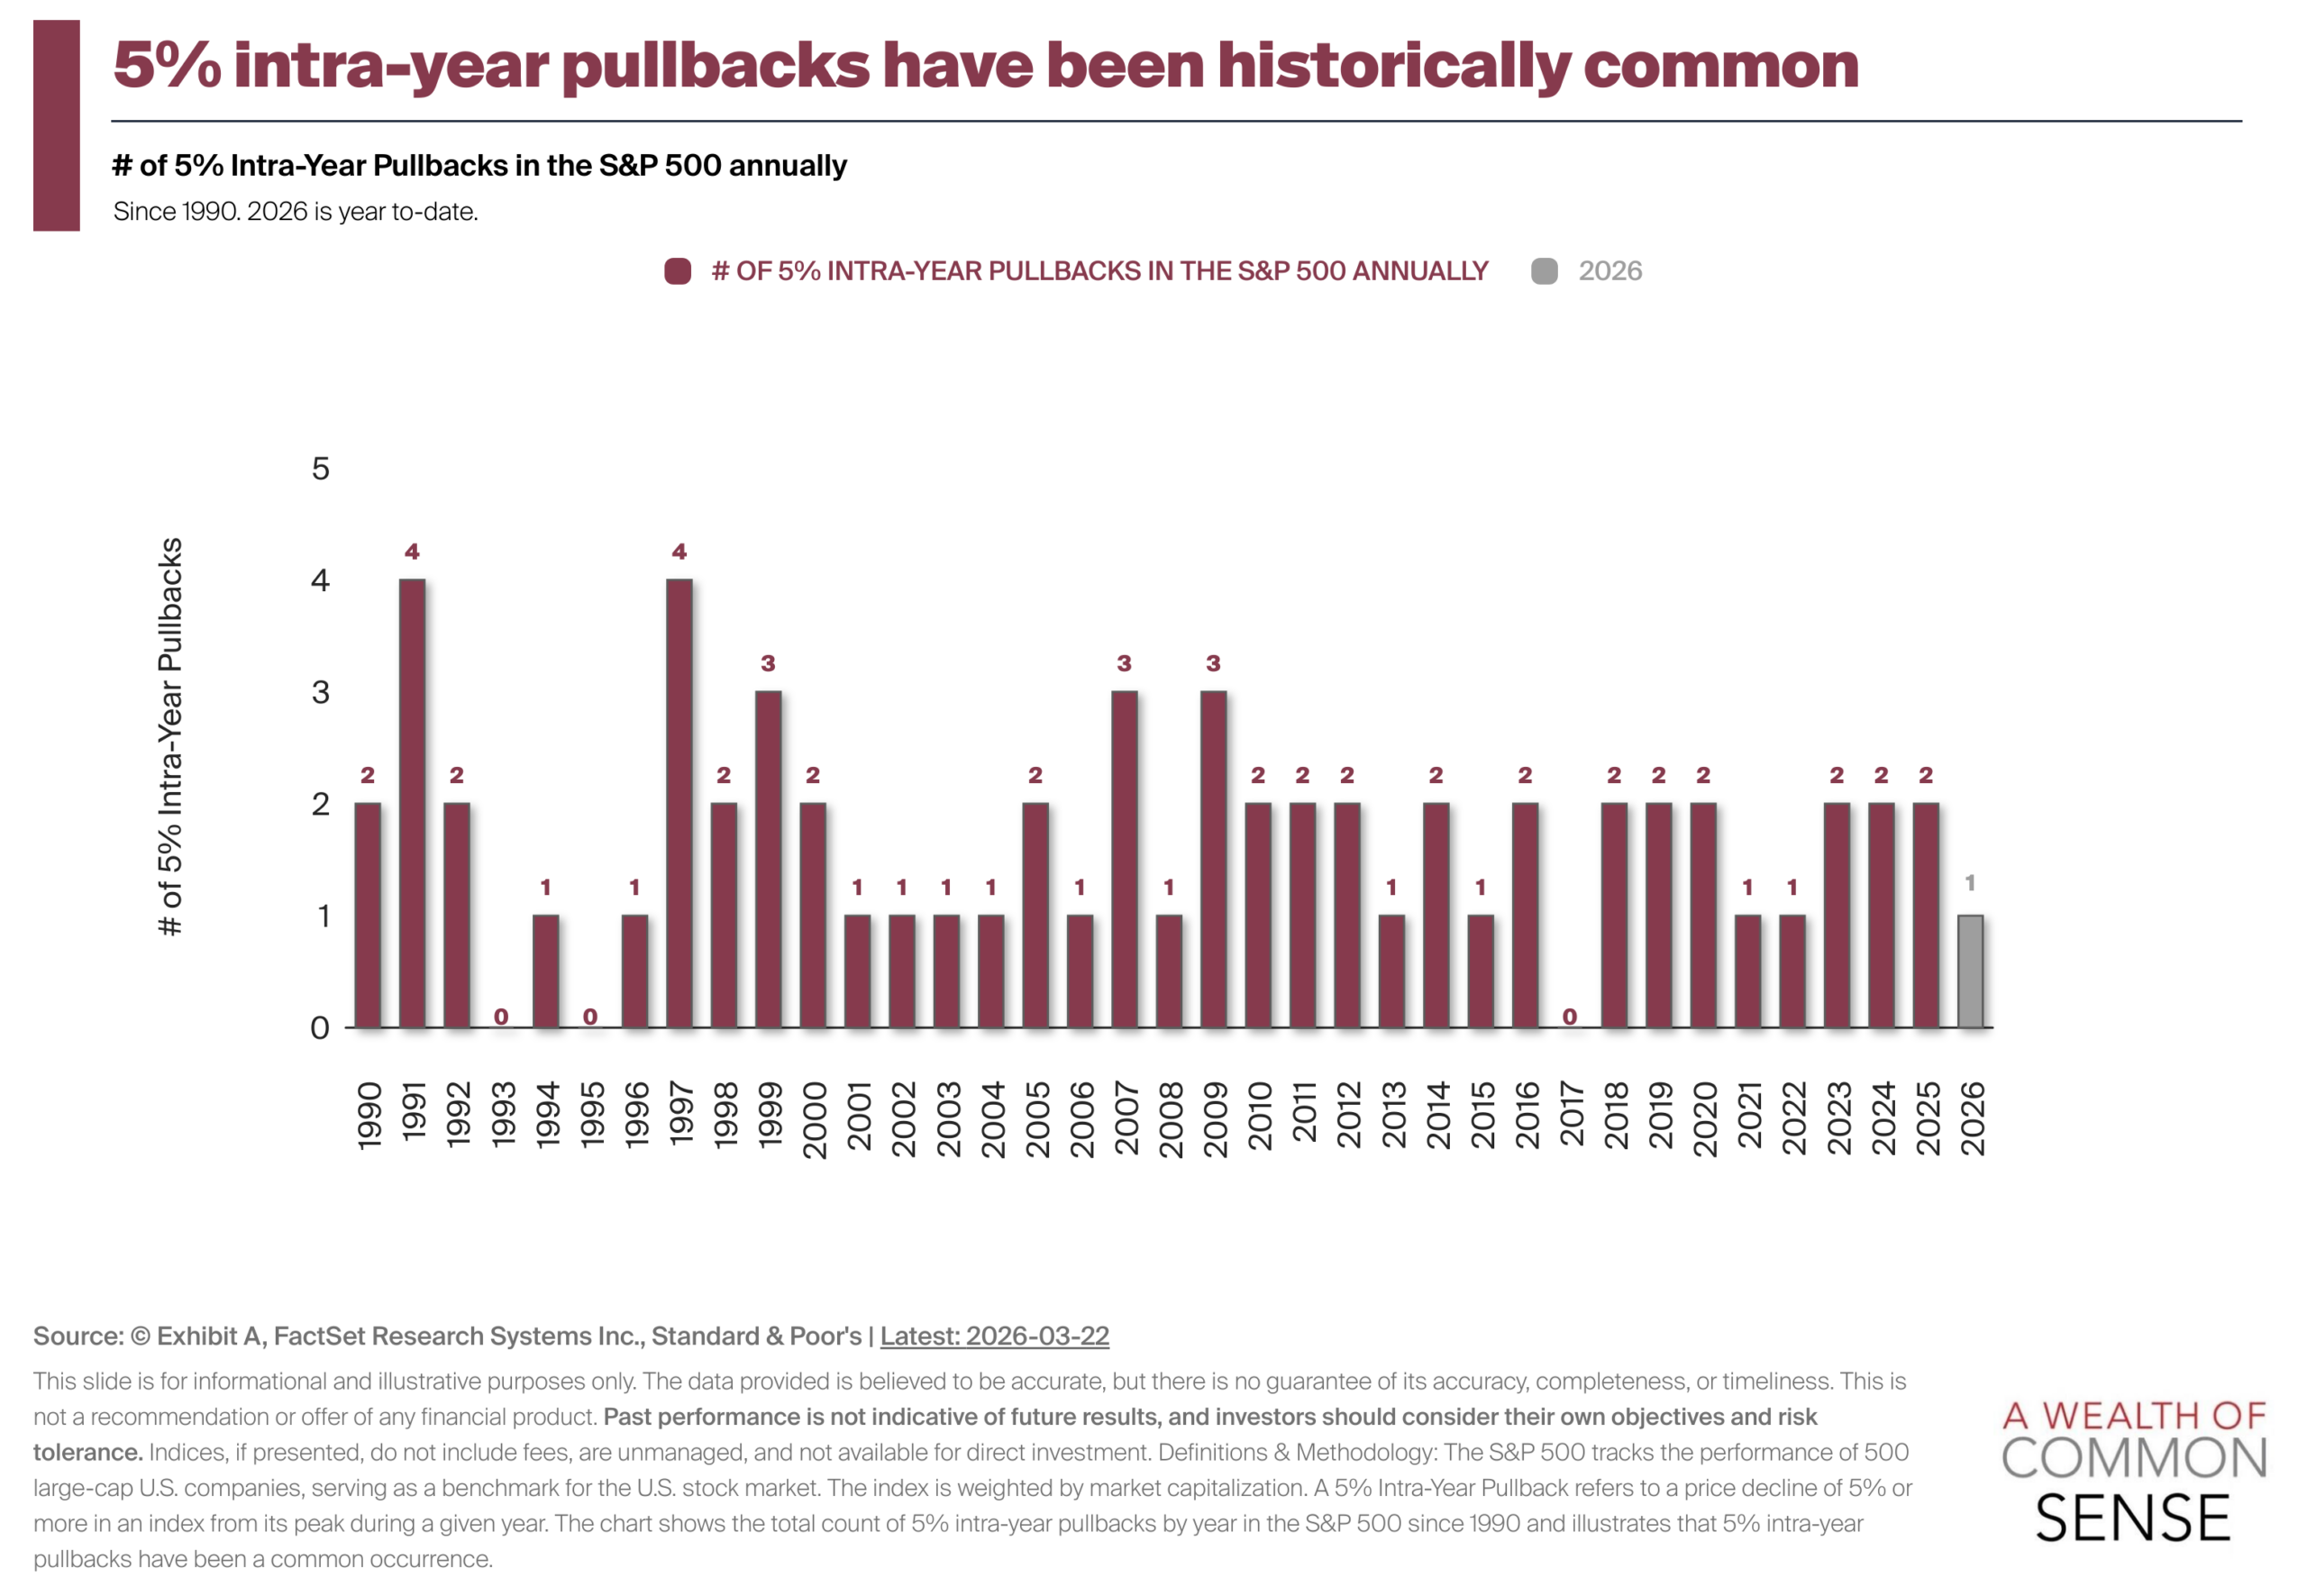
Just 3 of the past 37 calendar years have gone without at least a 5% pullback.1
Here’s a look at the totals for other drawdown levels going back to 1928:
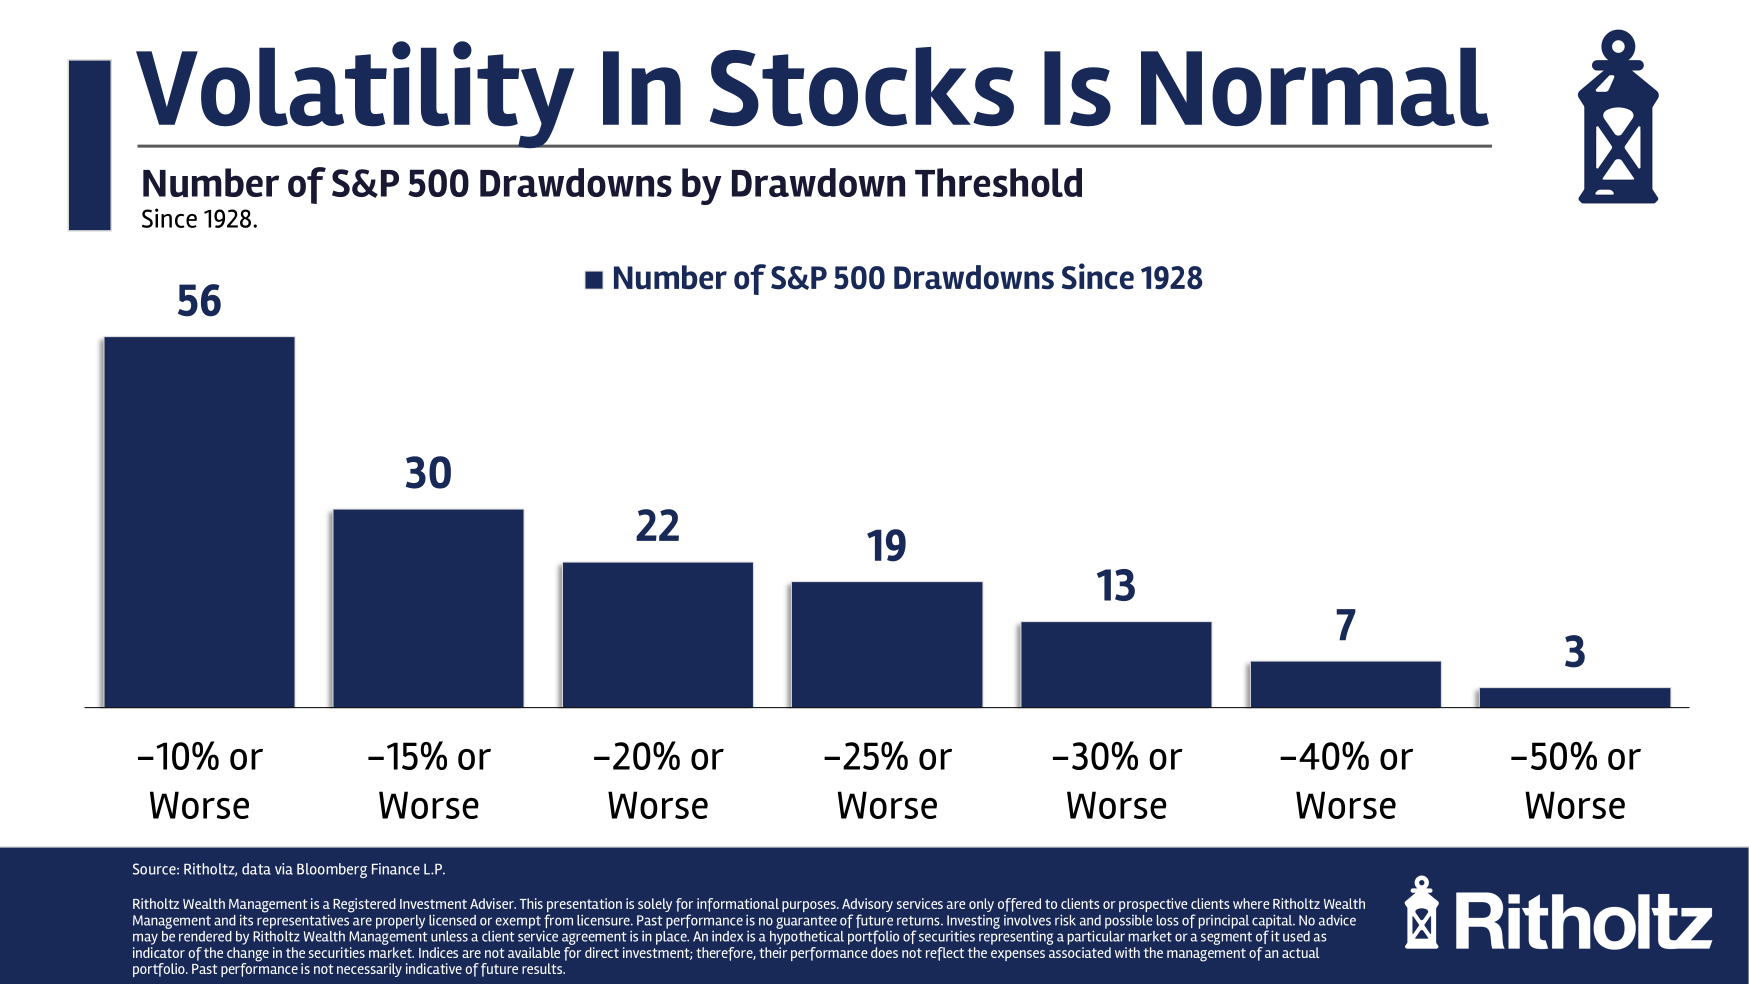
Obviously, healthy corrections happen more than crashes. A 10% correction has occurred roughly once every 1.8 years or so. A bear market has come about once every 5 years or so.
It’s also interesting to think about how often each level goes to another level.
Let’s say you get a 10% healthy correction in the S&P 500. How often has that turned into a 15% correction?
Answer: 54% of the time.
How many times has a 15% correction cascaded into a 20% bear market?
Answer: 73% of the time.
How many times has a 20% bear market fallen into 30% collapse?
Answer: 59% of the time.
How many times has a 30% collapse developed into a 40% crash?
Answer: 54% of the time.
And how many times has a 40% crash escalated into a 50% crisis?
Answer: 43% of the time.
Of course, these are historical probabilities. They tell us nothing about what will happen in the future. That’s the hard part.
In real-time it’s impossible to know when a pullback will turn into a healthy correction. Fundamentals won’t help you determine when a bear market will evolve into an all-out crash scenario.
When stocks are going down the only variable that matters is human nature and how investors react to the world around them.
Will the pullback get worse and move to a health correction, to a bear market, to a collapse, to a crash and eventually a crisis?
At some point it will. Could be this decade or a number of years from now.
Things could always blow over or get much worse from here. This is one of the many reasons the stock market offers you a risk premium as an investor over the long run — the short run is unpredictable.
Successful long-term investing in the stock market requires accepting the inherent uncertainty in how big the losses will be in the short-term.
The chart never moves up and to the right in a straight line.
Further Reading:
Are We Due For a Correction?
1The last time in 2017 the worst peak-to-trough drawdown was just -2.8%. That was an easy year.
Search
RECENT PRESS RELEASES
Related Post


![[Analysis] “Ethereum staking ratio hits record high…rising odds of a ‘supply shock'”](https://stockwatchindex.com/wp-content/uploads/2026/03/Breaking-News-with-Arial-font-no-background-500x383.png)
