Altcoins crash as Bitcoin falls to $100K: LDO, JUP, and FET take the double-digit hits
June 5, 2025
- Bitcoin tanked over 3% on Thursday after the Circle’s shares went public on the NYSE.
- Mirroring the market leader’s move, altcoins plunged, witnessing double-digit declines and breakdown of key levels.
- LDO, JUP, and FET lead the drop, diving more than 10% amid an increase in bearish momentum.
A sharp pullback characterized the broader cryptocurrency market on Thursday, leading to a bearish pattern break in Bitcoin (BTC) to briefly test the $100k levels. The market-wide panic with the Bitcoin sell-off led to quick profit bookings in altcoins such as Lido DAO (LDO), Jupiter (JUP), and Artificial Superintelligence Alliance (FET).
At the time of writing, Bitcoin trades at $101,724 as it bounces off the 50-day Exponential Moving Average (EMA) at $100,860. The price action shows BTC breaking out of a Head-and-Shoulders pattern with a neckline near $102,250, as shared in the chart below.
The momentum indicators’ sell signal for traders aligns with the price movement as the Moving Average Convergence/Divergence (MACD) indicator line and its signal line fall closer to the centre line while the red histogram bars rise in the negative territory. On a similar trend, the Relative Strength Index (RSI) at 42 breaks below the halfway line, with the recent plunge signaling a significant decline in bullish momentum.
The immediate 50-day EMA support helps sustain BTC above $100K for the moment. Suppose the crypto price takes a reversal from the broken neckline to breach the 50-day EMA. It could target $96,732, aligning with the 100-day EMA.
If the short-term BTC price reclaims the lost neckline at $102,250, investors could witness Bitcoin push to $106,749, the weekly high.
LDO takes a breather after the 14% drop on Thursday, with no significant price movement at press time in early Asian hours. Lido DAO falls under the $0.80 level but avoids a closing below May’s low at $0.741.
Currently, the altcoin finds support from a declining trendline formed by the daily lows of May 18, 20, and 31. Completing a falling wedge with the support trendline, swing highs in LDO on January 31, May 13, and June 4 give rise to a converging resistance trendline.
The MACD indicator line and its signal line plunge in the negative direction, while the RSI at 39 signals room for a pullback before the altcoin reaches oversold conditions shortly.
If the LDO closing price dives below the $0.741 support, it will mark a decisive breakdown of the falling wedge pattern. Sideline investors looking to sell can find entry opportunities in such a case, with the price target at $0.630, the lowest daily close since July 2022.
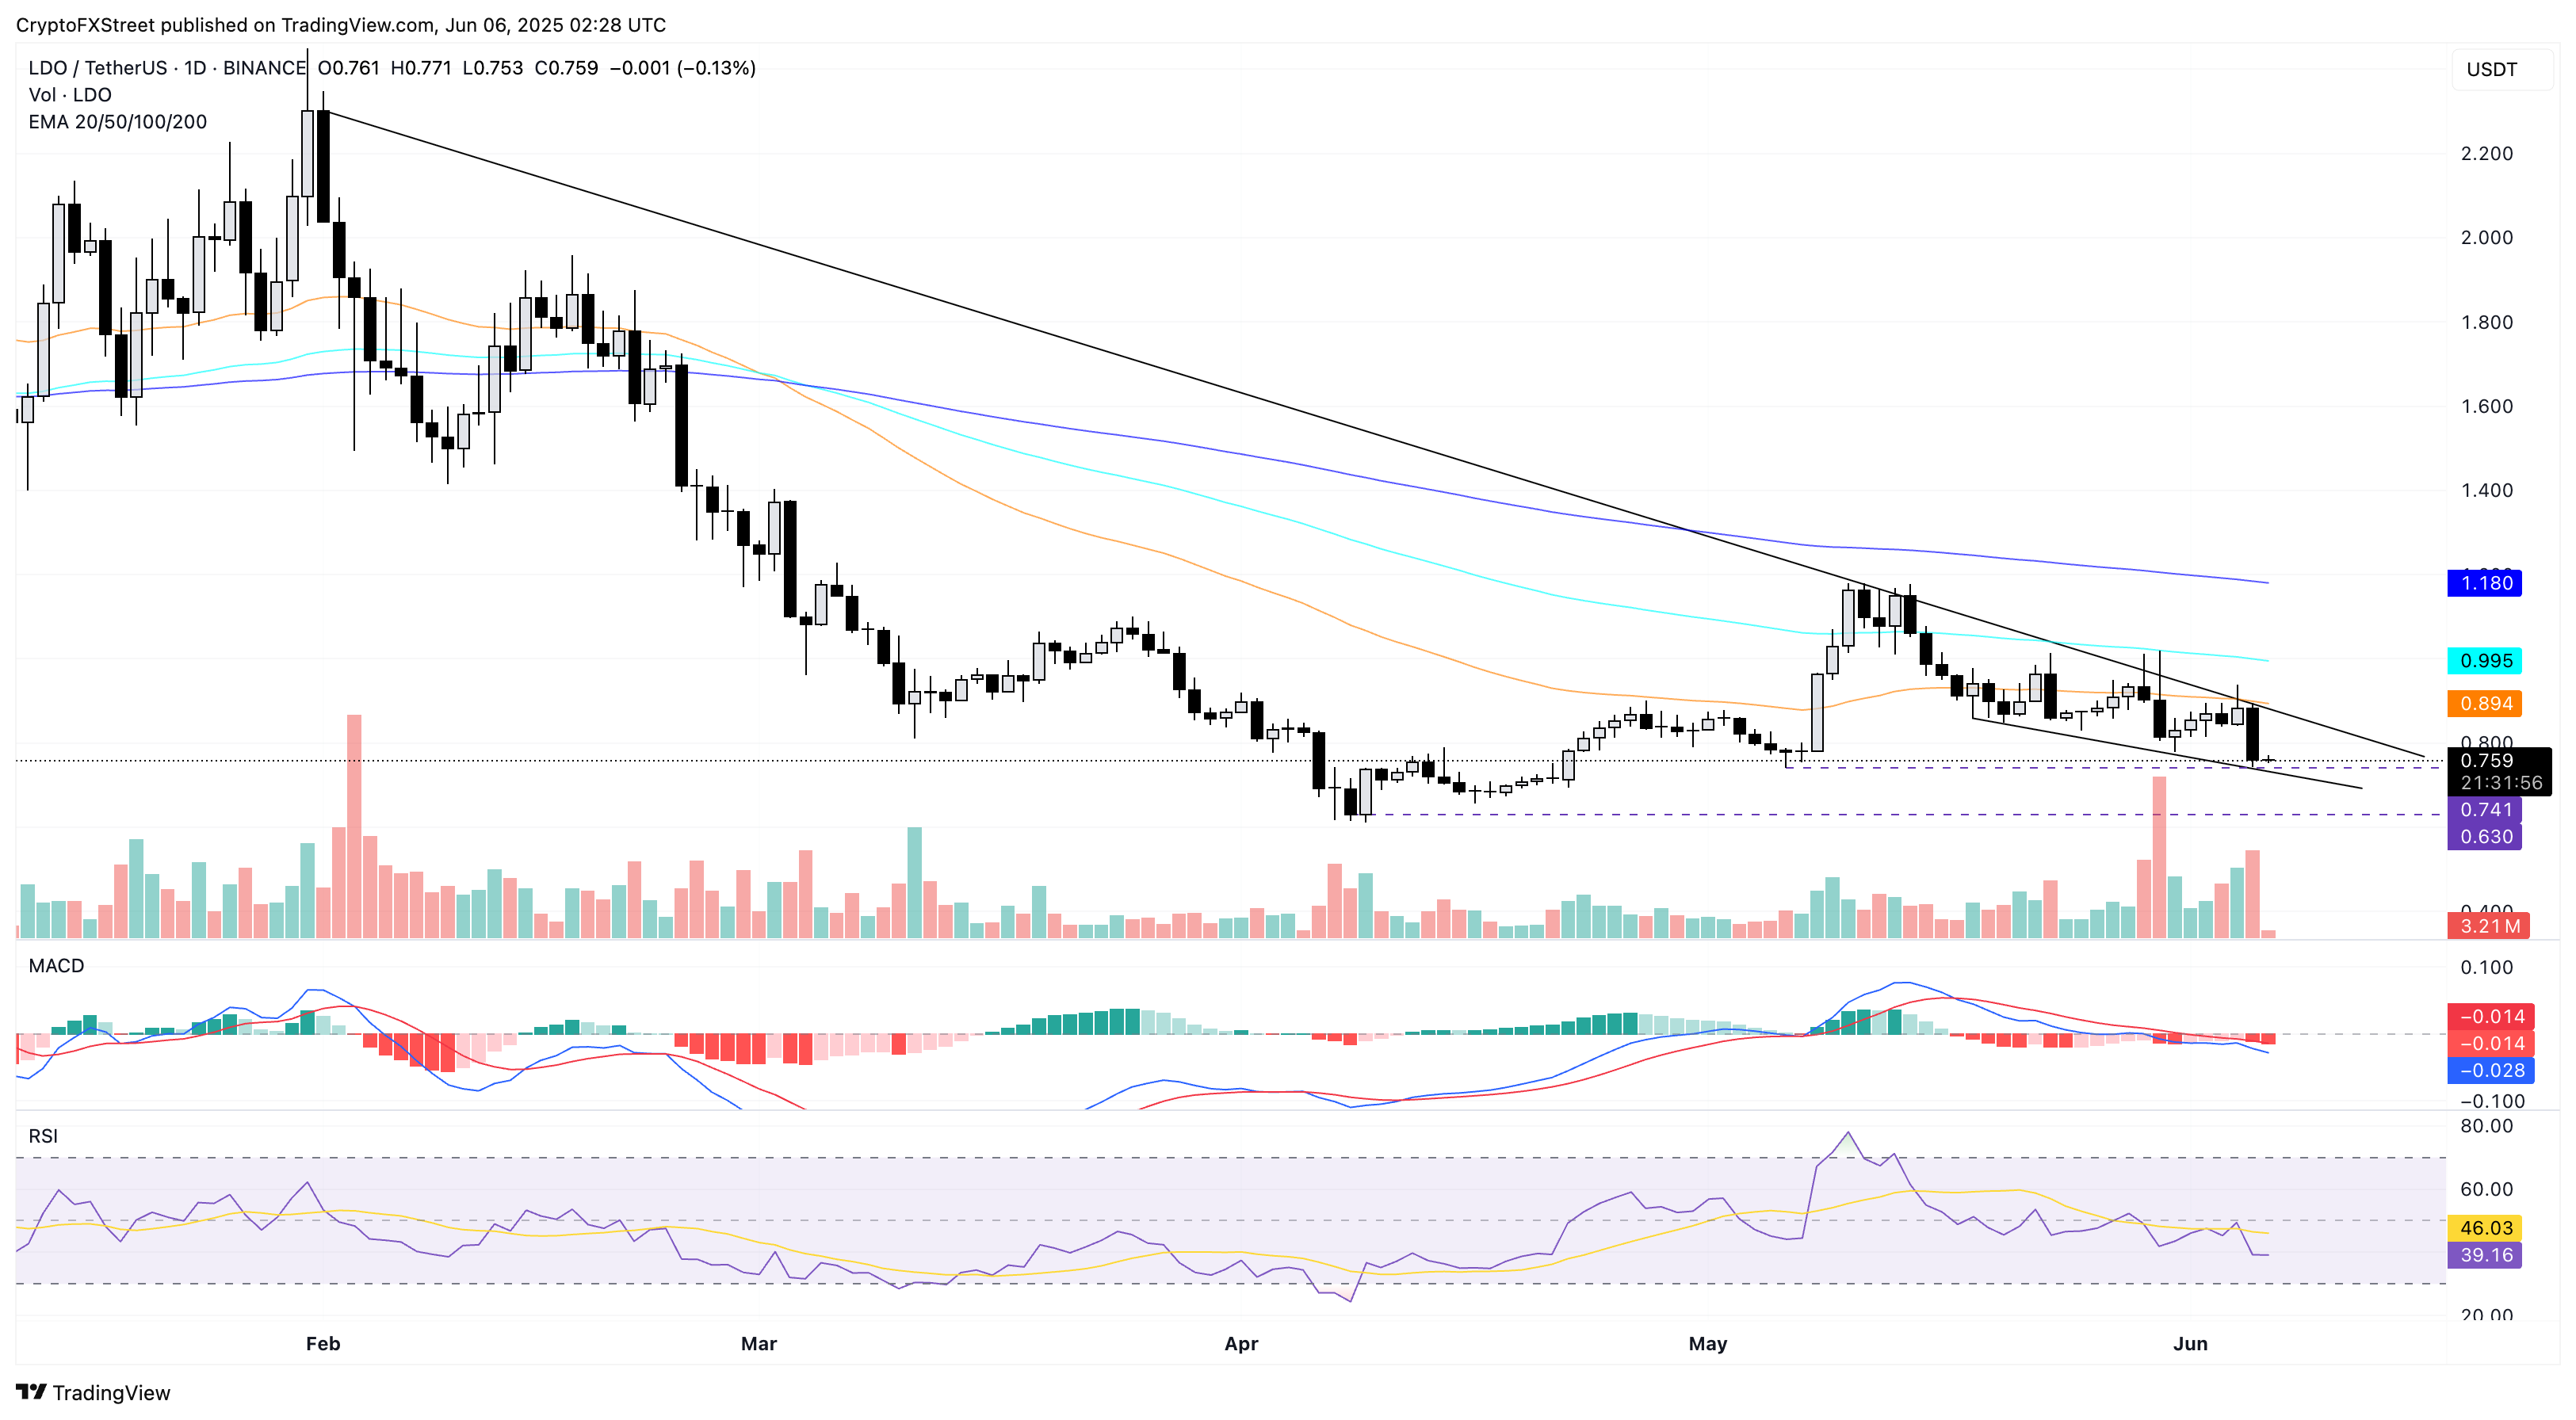
LDO/USDT daily price chart. Source: Tradingview
On the flip side, a bounce back could face resistance at the 50-day EMA at $0.894.
Similar to Bitcoin, Jupiter price action reveals a Head-and-Shoulders pattern breakout triggered by an 11.70% drop on Thursday. At the time of writing, Jupiter is at $0.4585, remaining silent in the day after the crash.
Shaping the bearish pattern, the 200-day EMA influences the head peak, while the 100-day EMA dynamic resistance creates the two shoulders, as shown in the chart below. Following the $0.4764 neckline break, the path of least resistance suggests a downward move to the $0.4019 support level, the lowest price reached in May.
Increasing the downside risk, the momentum indicators reveal bearish dominance. The MACD indicator shows increasing red histogram bars while the RSI at 39 approaches the oversold boundary.
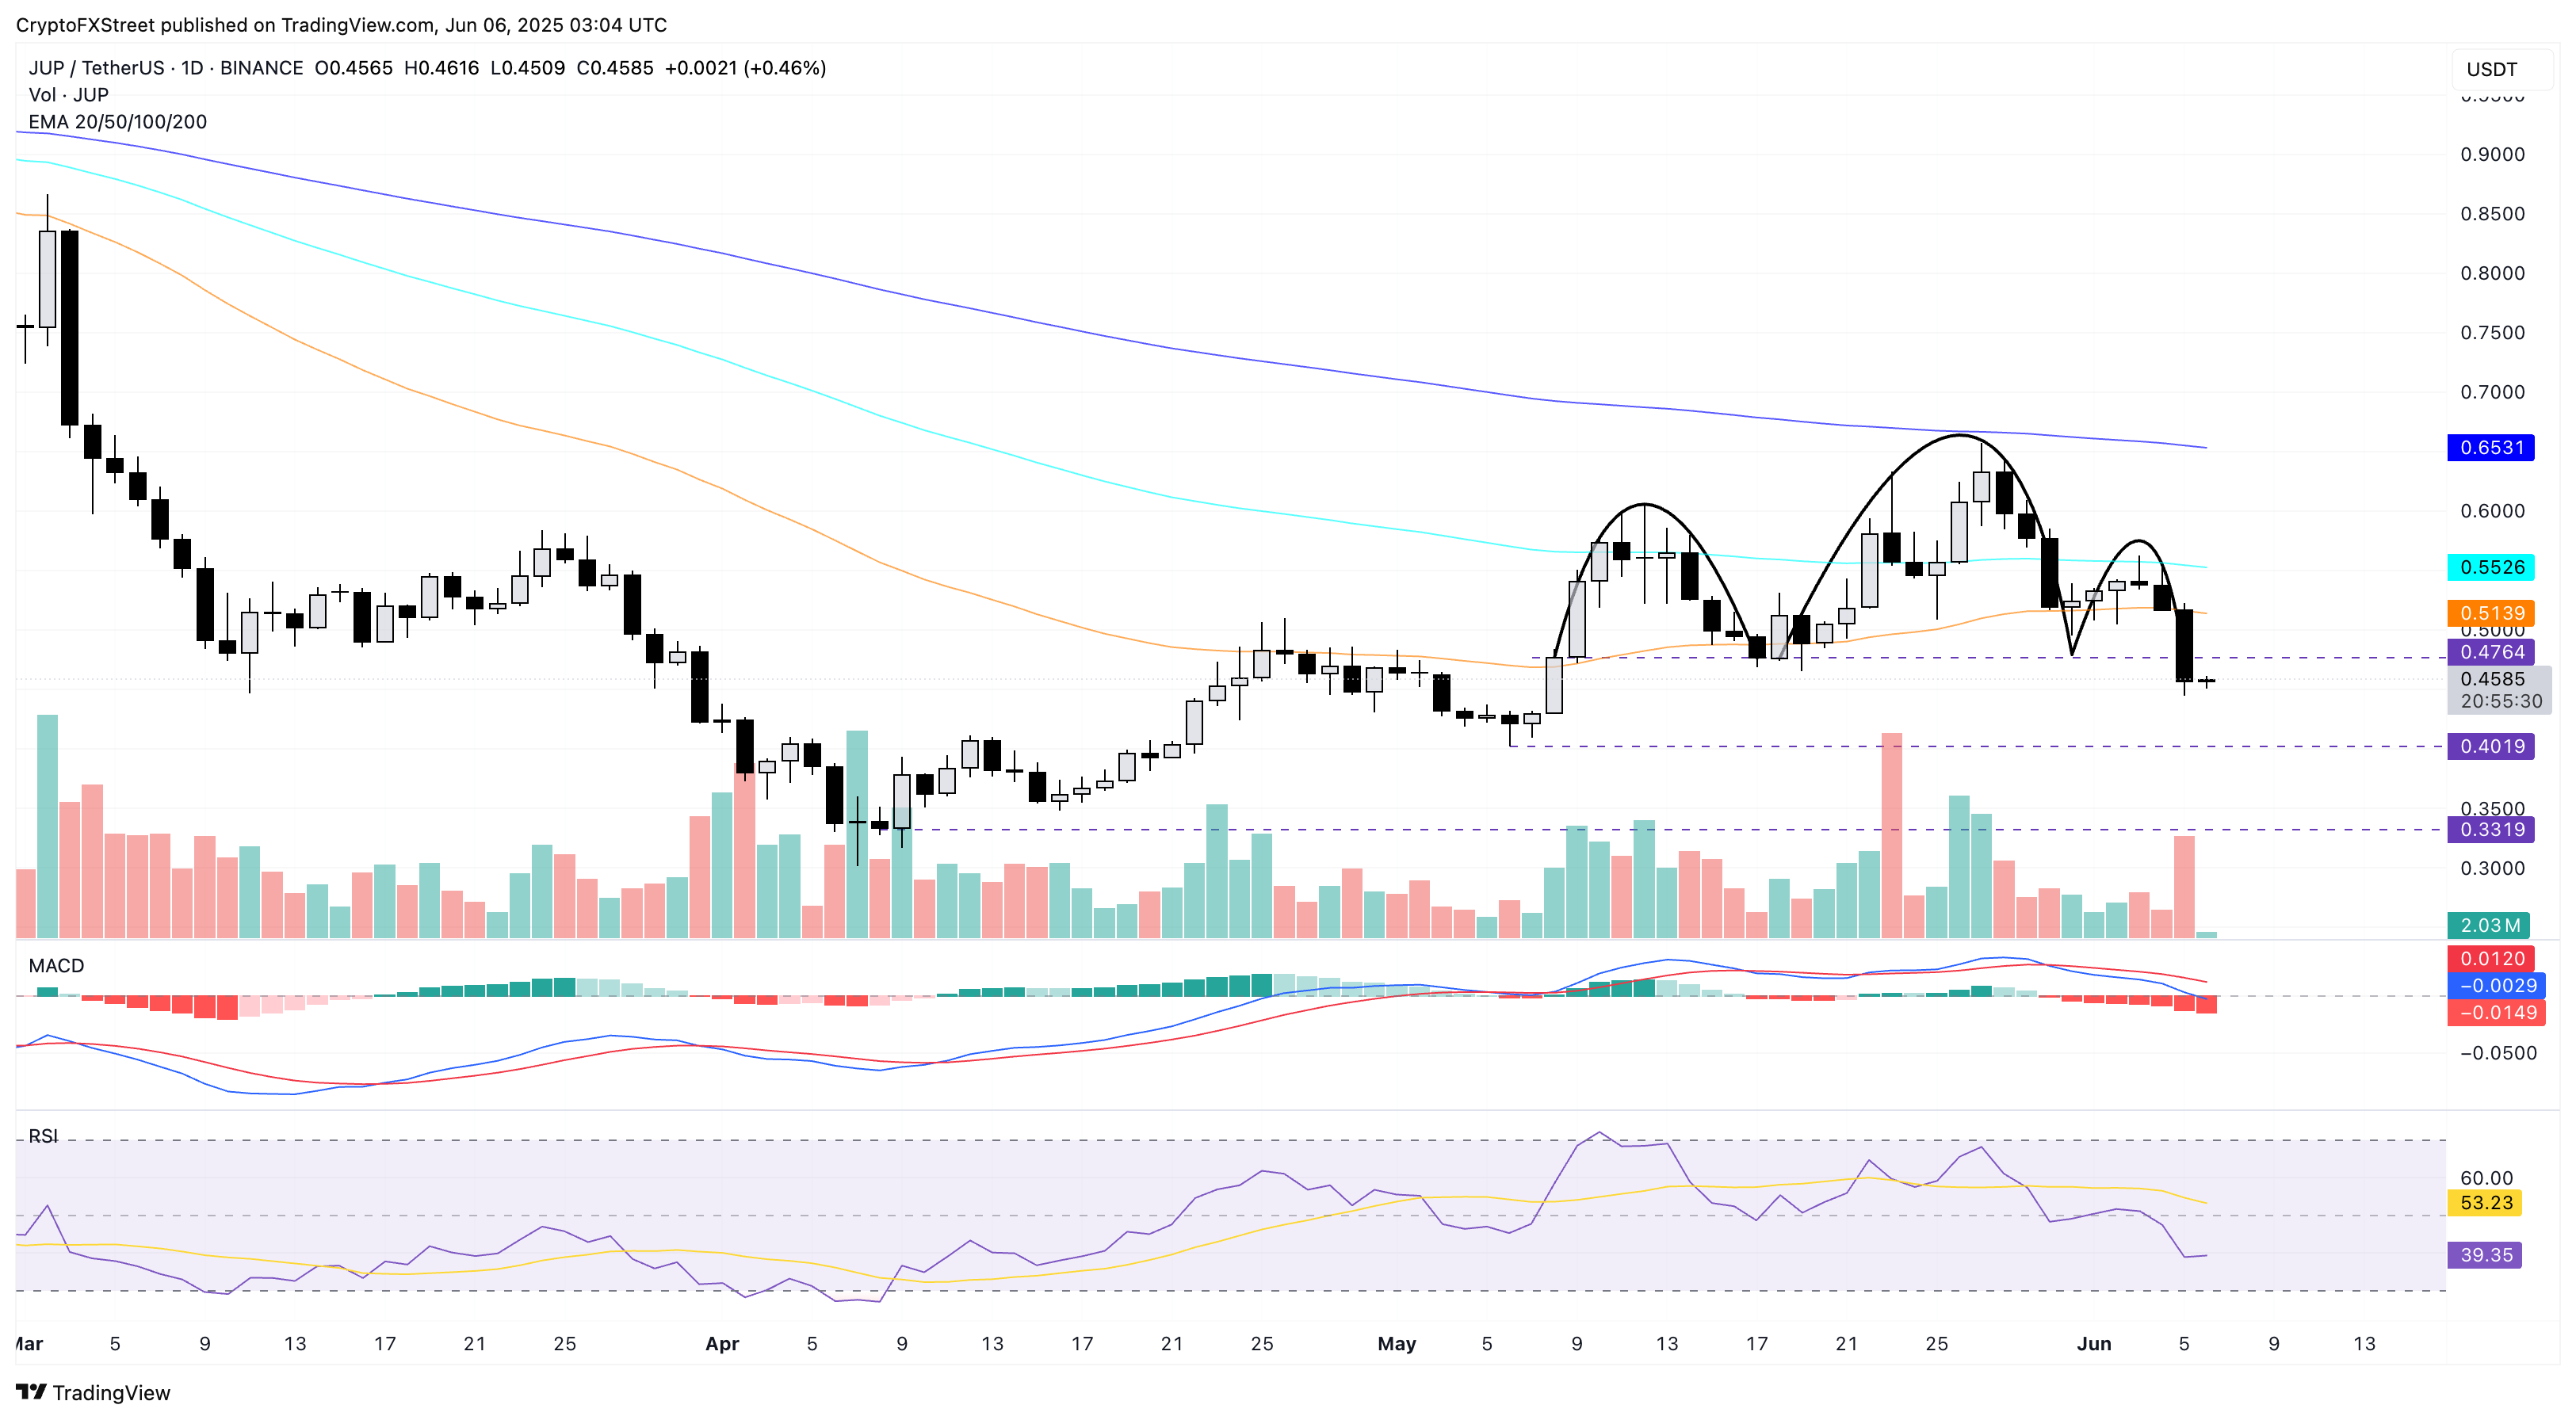
JUP/USDT daily price chart. Source: Tradingview
However, a reversal in JUP closing above the broken neckline at $0.4764 could propel it to the 50-day EMA at $0.5139.
FET evaporates the early week gains with two consecutive bearish days and is down nearly 5% so far this week. The AI token breaks under the 50-day and 100-day EMA merger near $0.75 and approaches the $0.70 support level highlighted by the low on May 19.
Typically, price action backs the thesis to buy at support levels, but the momentum indicators trigger a sell signal for FET as it approaches the $0.70 support level. Similar to other altcoins, the MACD indicator is characterized by rising red histograms and a downward trajectory of average lines in the negative territory.
The RSI at 43 slips below the halfway line, indicating a loss in bullish momentum with room on the downside before hitting the oversold boundary.
If FET leaps off the $0.70 level, the merged EMAs at $0.75 could be immediate resistance.
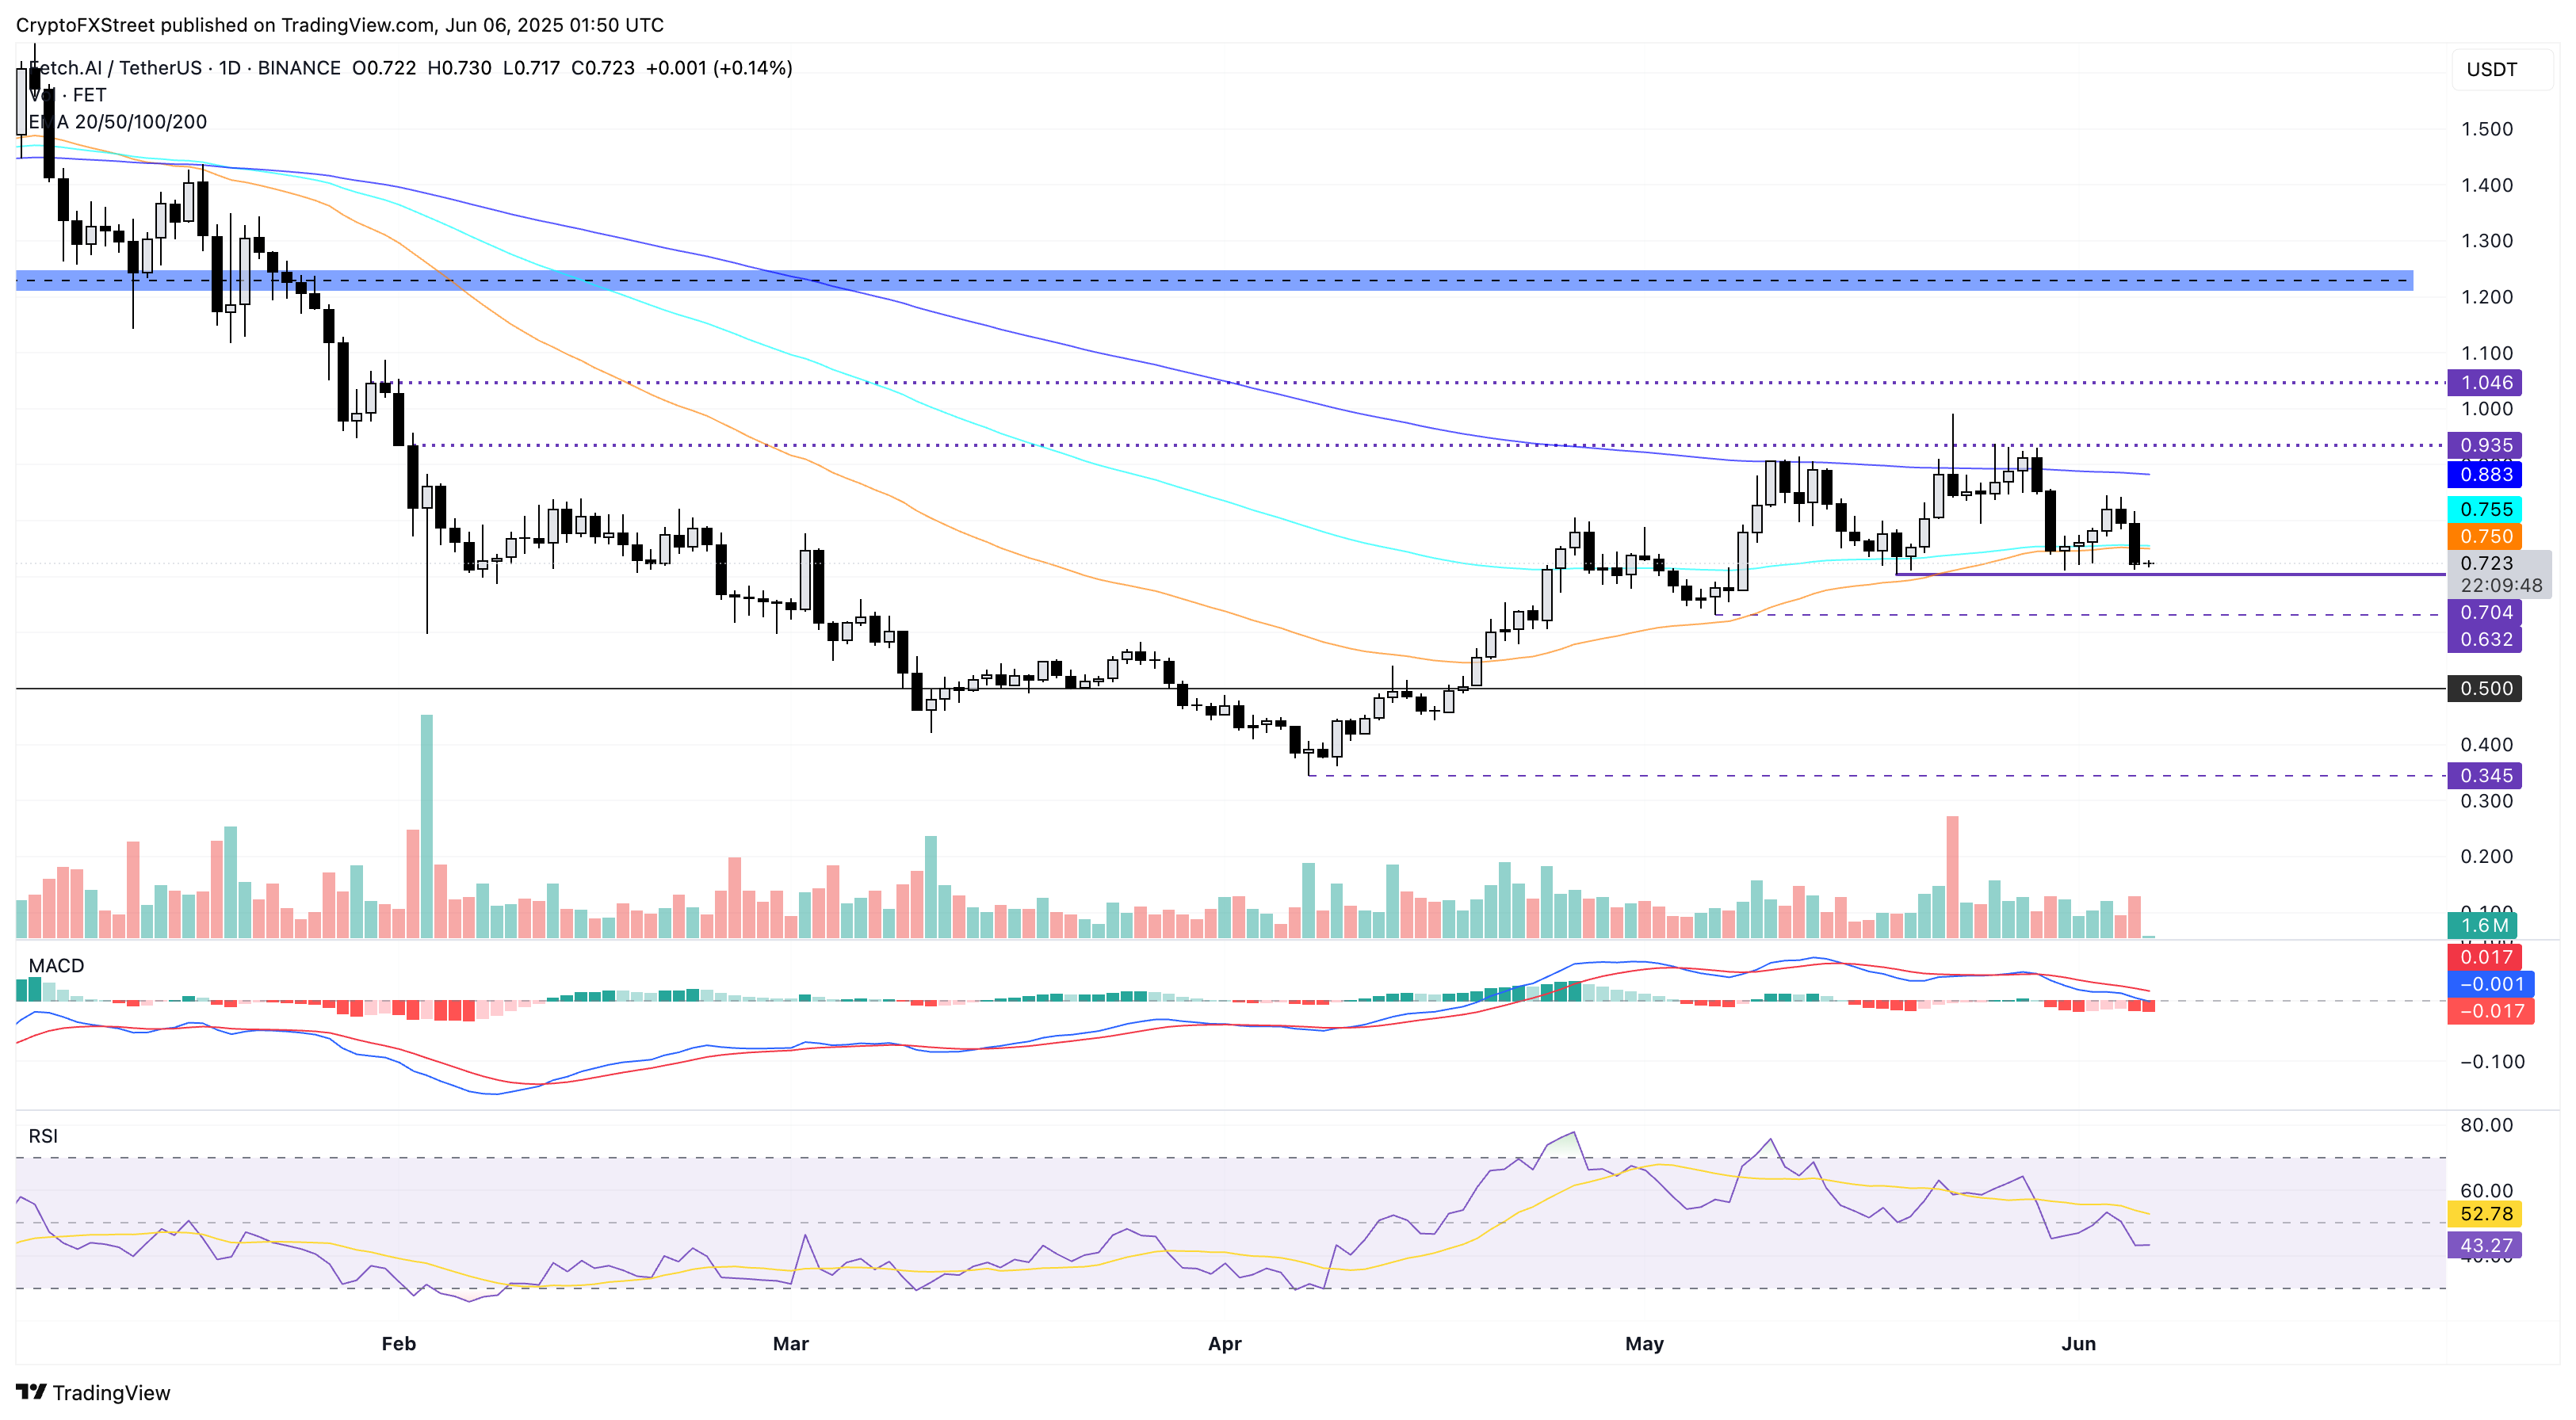
FET/USDT daily price chart. Source: Tradingview
However, a slip below $0.70 could push FET down to the $0.50 psychological level.
Search
RECENT PRESS RELEASES
Related Post


