Amazon (AMZN) Stock After Recent Pullback Are Valuation Models Pointing To An Opportunity
June 13, 2026
- If you are wondering whether Amazon.com’s current share price still reflects good value, it helps to step back and look at what the recent returns and fundamentals are actually saying about the stock.
- The stock closed at US$238.55, with the share price down 3.0% over the last week and down 10.7% over the last month, while still showing gains of 5.3% year to date and 12.5% over the past year, and a very large 3 year return that sits well above the 5 year figure of 36.8%.
- Recent price moves sit against a backdrop of ongoing interest in Amazon.com’s core e commerce, cloud and advertising businesses, as investors weigh long term growth drivers against near term sentiment shifts. Broader discussion around large technology stocks, regulation and competition also influences how the market is currently pricing Amazon.com.
- On Simply Wall St’s framework, Amazon.com currently has a valuation score of 4 out of 6. This means the stock screens as undervalued on four of the six checks that are applied. The sections that follow will walk through different valuation approaches before finishing with a broader way to think about what that score really means for you.
Advertisement
Approach 1: Amazon.com Discounted Cash Flow (DCF) Analysis
A Discounted Cash Flow model takes estimates of a company’s future cash flows, then discounts them back to today’s dollars to arrive at an estimated value per share.
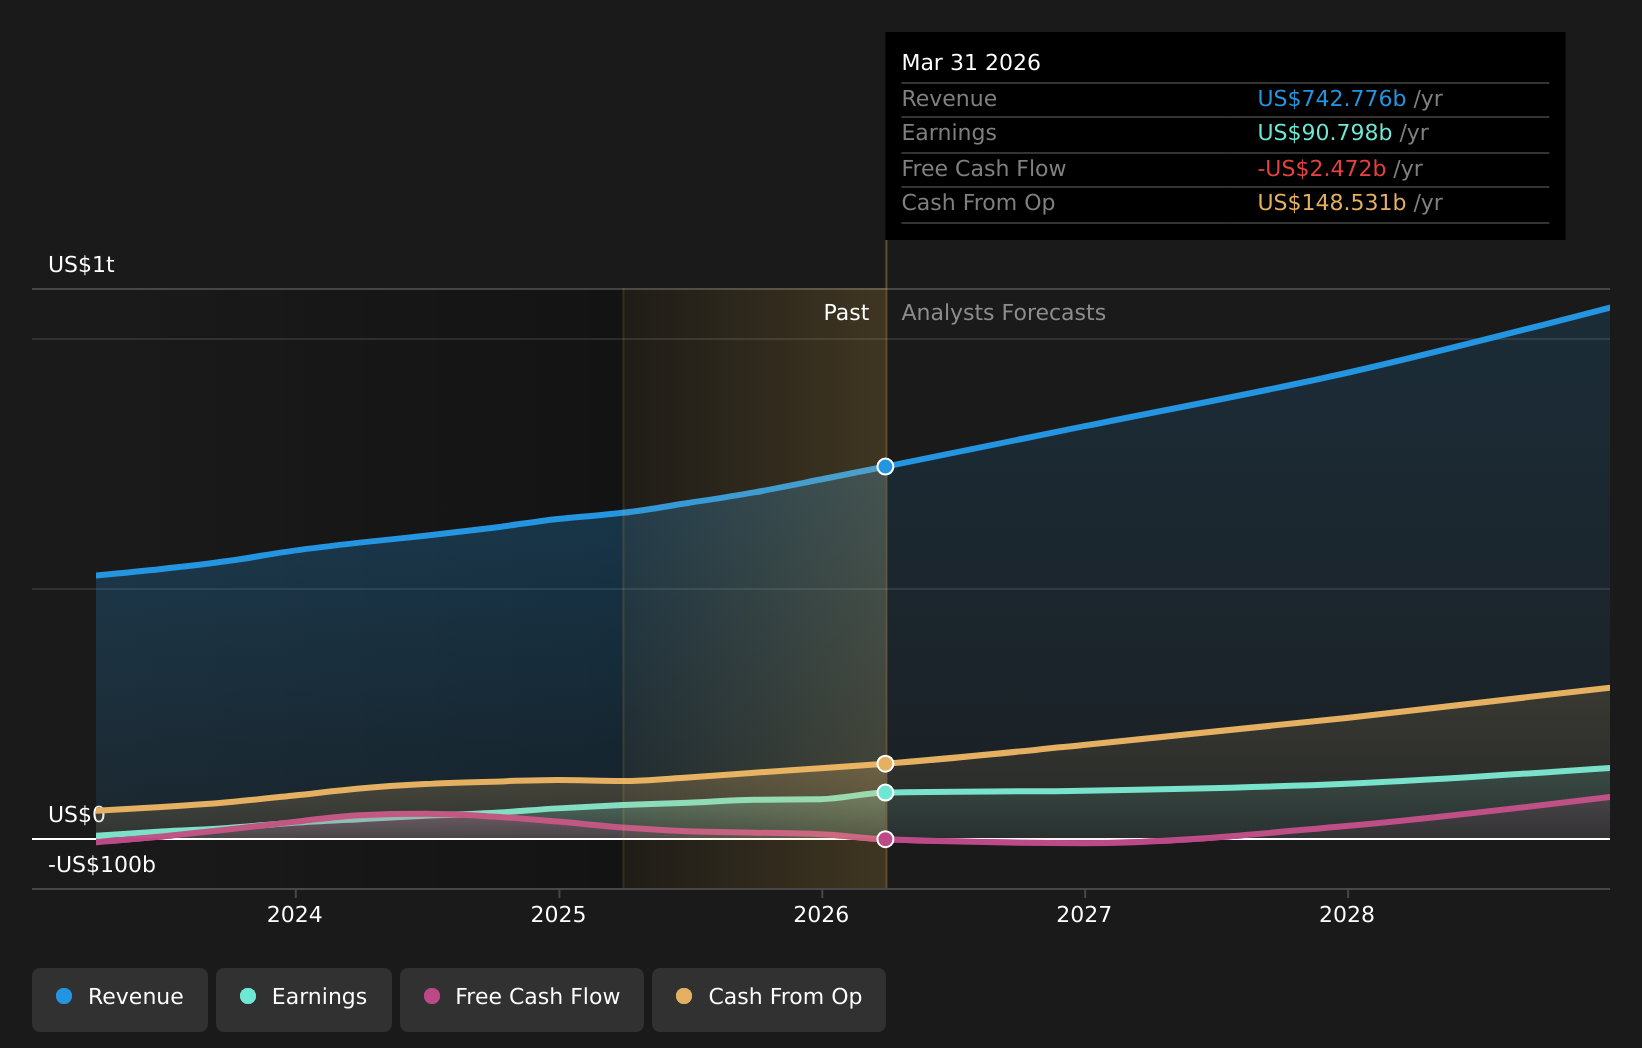
For Amazon.com, the latest reported Free Cash Flow is about $37.1b. Simply Wall St uses a 2 Stage Free Cash Flow to Equity model, combining analyst forecasts for the next few years with longer term extrapolations. In this model, projected Free Cash Flow reaches $182.4b in 2030, based on a mix of analyst inputs and extended estimates in later years.
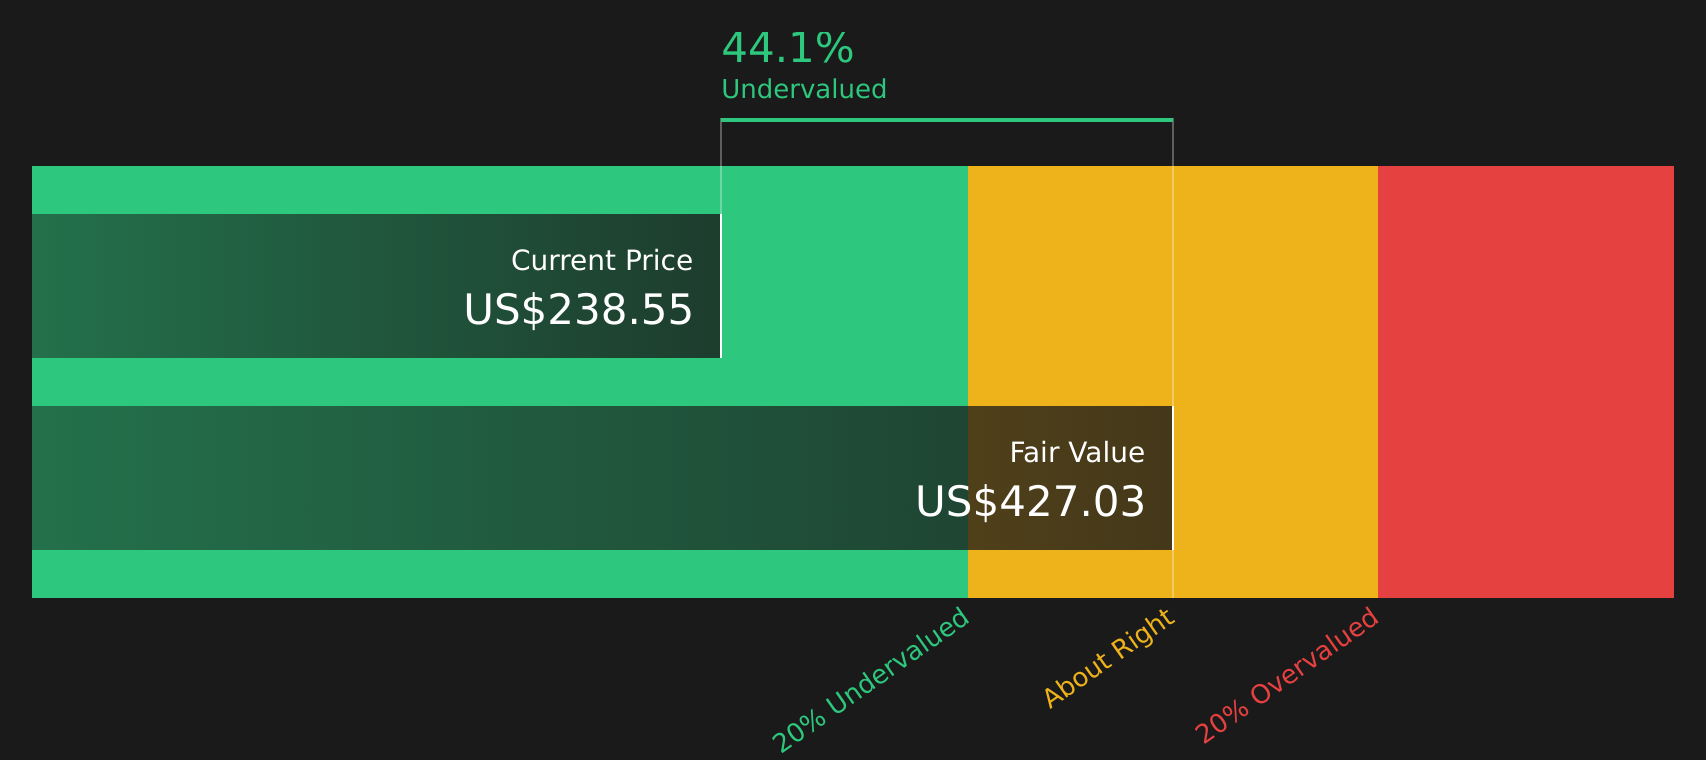
When all those projected cash flows are discounted back to today, the DCF model suggests an estimated intrinsic value of about $427.03 per share. Compared with the recent share price of $238.55, this points to an implied discount of 44.1%, which indicates the stock screens as undervalued under this approach.
Result: UNDERVALUED
Our Discounted Cash Flow (DCF) analysis suggests Amazon.com is undervalued by 44.1%. Track this in your watchlist or portfolio, or discover 44 more high quality undervalued stocks.
Approach 2: Amazon.com Price vs Earnings
For profitable companies, the P/E ratio is a useful way to see how much you are paying for each dollar of earnings, which makes it a common yardstick for comparing stocks that already generate positive profits.
What counts as a “normal” P/E depends on how quickly earnings are expected to grow and how risky those earnings are. Higher expected growth or lower perceived risk can justify a higher P/E, while slower growth or higher risk usually lines up with a lower P/E.
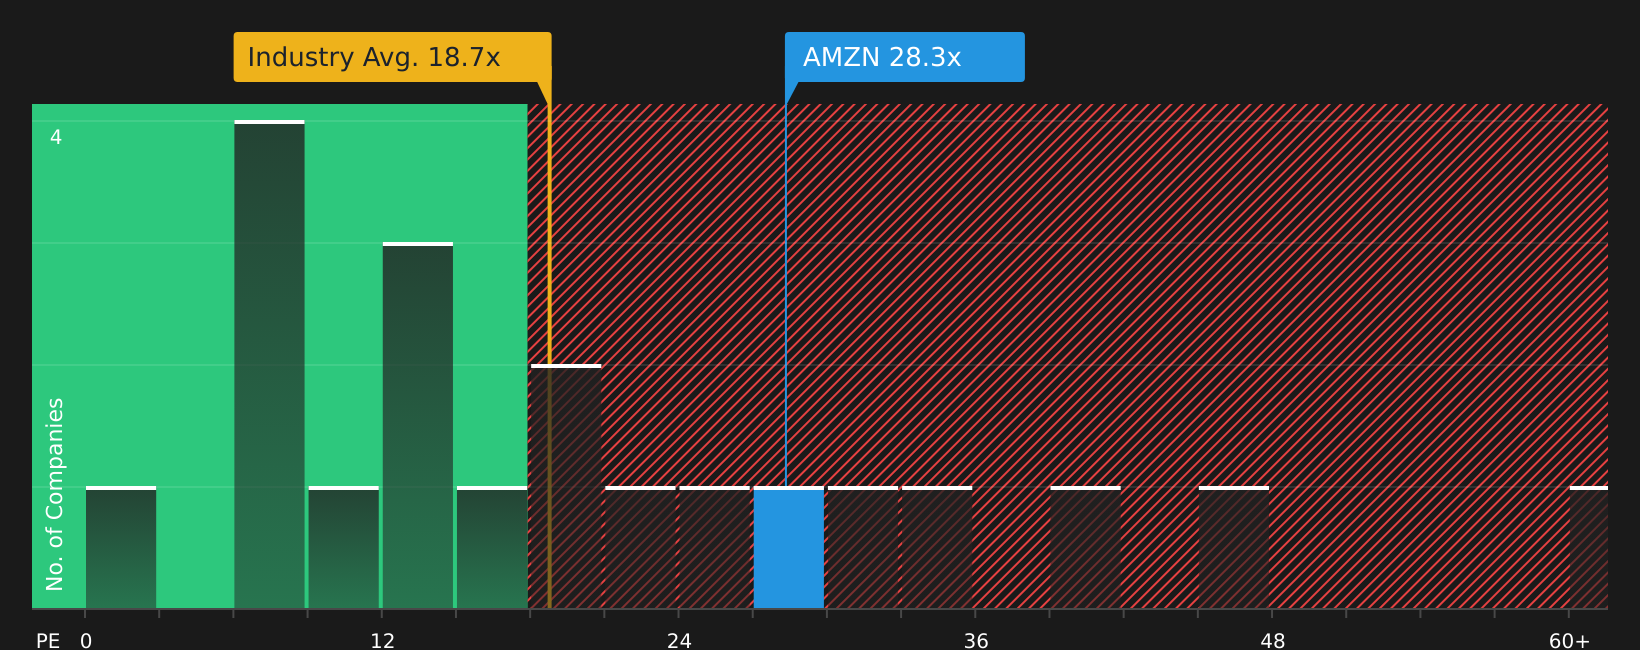
Amazon.com currently trades on a P/E of 28.26x. This sits above the Multiline Retail industry average P/E of 18.67x and also above the peer average of 22.66x. This suggests investors are currently paying a higher multiple than these benchmarks.
Simply Wall St’s Fair Ratio is a proprietary estimate of what P/E might be reasonable for Amazon.com given factors such as its earnings growth profile, industry, profit margins, market cap and specific risks. Because it adjusts for these company level characteristics, it can be more tailored than a simple comparison with sector averages or peers.
For Amazon.com, the Fair Ratio is 44.86x, which is materially higher than the current P/E of 28.26x. On this measure, the stock screens as undervalued.
Result: UNDERVALUED
P/E ratios tell one story, but what if the real opportunity lies elsewhere? Start investing in legacies, not executives. Discover our 20 top founder-led companies.
Earlier it was mentioned that there is an even better way to think about valuation, so this is where Narratives come in as a simple way for you to connect your view of Amazon.com’s business to the numbers on the screen.
A Narrative is your story about a company, written in financial terms, where you spell out what you think is reasonable for future revenue, earnings and margins, and the fair value that falls out of those assumptions.
On Simply Wall St’s Community page, Narratives are an accessible tool used by millions of investors to link a company’s story to a forecast and then to a fair value. You can then compare that fair value with today’s share price to help decide whether the stock looks cheap or expensive on your assumptions.
Because Narratives update when new information such as earnings or news arrives, your view stays live rather than locked in a static spreadsheet. You can see how different investors can look at the same Amazon.com data and come to very different fair values, from about US$141 per share using a DCF style view to around US$475 per share or even US$450 per share based on more optimistic assessments of its future economics.
For Amazon.com however we will make it really easy for you with previews of two leading Amazon.com Narratives:
Fair value in this bullish Narrative: US$450.00 per share
Implied discount to that fair value versus the last close: about 47.0% below the Narrative fair value
Revenue growth assumption in this view: 8.95%
- The author argues that Amazon is compressing margins on purpose to fund large scale AI, cloud and automation investments that are intended to lift earnings power over time.
- AWS, advertising and a more efficient retail operation are positioned as the main engines of future profit, with AI tools and custom chips playing a central role in customer retention.
- On this view, the current share price does not fully reflect the earnings capacity the author expects Amazon to reach once this investment phase matures.
Fair value in this more cautious Narrative: US$234.75 per share
Implied premium to that fair value versus the last close: about 1.6% above the Narrative fair value
Revenue growth assumption in this view: 13.6%
- The author focuses on recent results and guidance, highlighting solid revenue and earnings figures alongside a long list of new products, partnerships and AI related projects.
- Key risks in this Narrative include AWS growth coming in below a 20% year on year threshold, rising competition in cloud, capacity constraints and tariff uncertainty.
- The valuation work in this case points to a fair value close to the current price, with the author flagging that projections do not fully incorporate potential upside from pipeline projects.
Taken together, these two community Narratives bracket a wide valuation range and underline why your own assumptions about margins, AI spending and AWS growth are so important when you think about Amazon.com stock.
To compare these previews with the rest of the community and see how your view stacks up, head over to the full set of Narratives for Amazon.com on Simply Wall St, where you can review, refine or even build your own forecast linked to a fair value.
Curious how numbers become stories that shape markets? Explore Community Narratives
Do you think there’s more to the story for Amazon.com? Head over to our Community to see what others are saying!

This article by Simply Wall St is general in nature. We provide commentary based on historical data
and analyst forecasts only using an unbiased methodology and our articles are not intended to be financial advice. It does not constitute a recommendation to buy or sell any stock, and does not take account of your objectives, or your
financial situation. We aim to bring you long-term focused analysis driven by fundamental data.
Note that our analysis may not factor in the latest price-sensitive company announcements or qualitative material.
Simply Wall St has no position in any stocks mentioned.
New: Manage All Your Stock Portfolios in One Place
We’ve created the ultimate portfolio companion for stock investors, and it’s free.
• Connect an unlimited number of Portfolios and see your total in one currency
• Be alerted to new Warning Signs or Risks via email or mobile
• Track the Fair Value of your stocks
Have feedback on this article? Concerned about the content? Get in touch with us directly. Alternatively, email editorial-team@simplywallst.com
Search
RECENT PRESS RELEASES
Related Post

