Amazon Stock Analysis: 266–269 Pause, 2 Key Levels
May 25, 2026
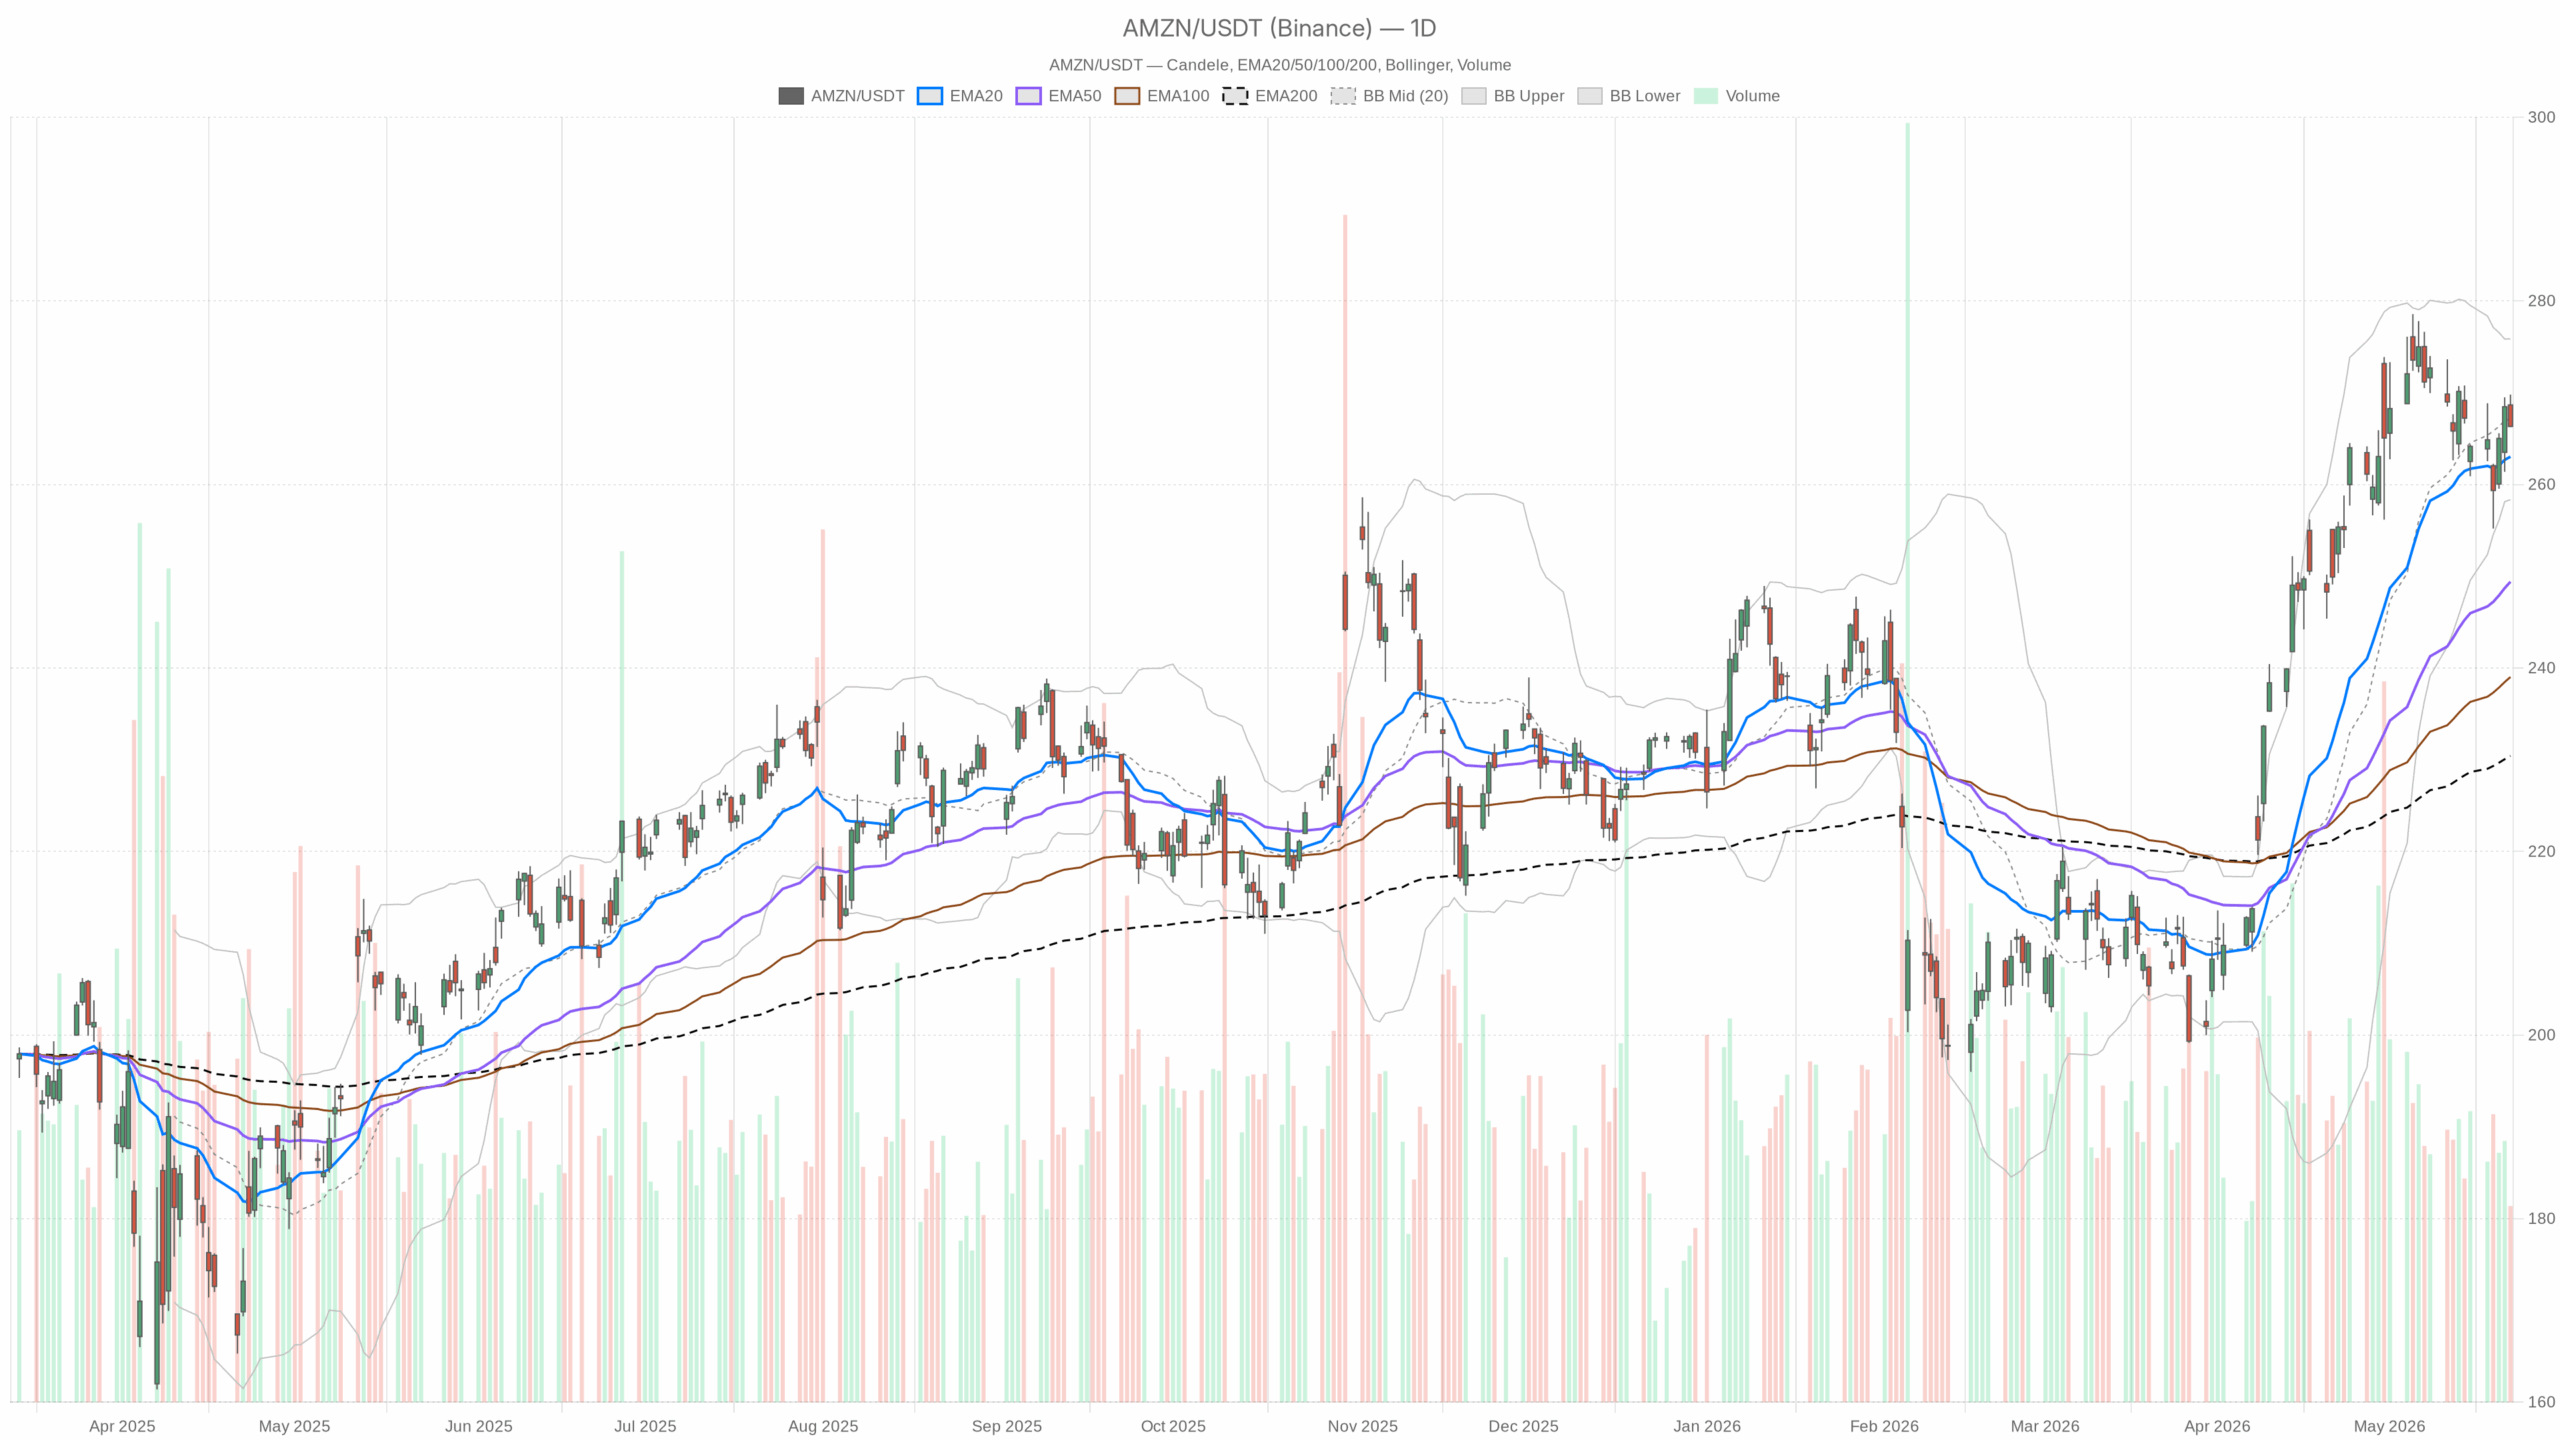
Amazon Stock maintains a constructive daily uptrend, but buyers are pausing near 266–269 as momentum cools. Price consolidates under the 267 pivot while staying above rising averages; the bias remains bullish, though near-term action looks range-bound.
Summary
Amazon Stock Daily Trend: Constructive, Momentum Cooled
Trend, Levels, and Momentum
On the daily chart, AMZN closed at 266.32 on May 22. Price holds above the 20‑, 50‑, and 200‑day EMAs at 263.02, 249.40, and 230.42. Trend control remains with the bulls. The daily pivot is 267.45, with R1 268.66 and S1 265.11. These nearby levels frame a tight range just under the 267 pivot.
Meanwhile, the 14‑day RSI is 57.98, signaling positive momentum without overbought risk. Daily ATR prints 6.12, keeping volatility contained for a megacap. However, price sits fractionally below the Bollinger mid at 267.10, so mild mean‑reversion pressure persists. The bands are 275.86 and 258.33, leaving range risk roughly balanced. Notably, the MACD histogram is −2.10 with the line under the signal, confirming cooled thrust.
Intraday Setup: 1‑Hour Neutral, Support Holds
On the 1‑hour backdrop, conditions are neutral rather than strong. Price hugs the EMA20 at 266.39 while staying above the EMA50 at 265.75. The RSI reads 51.26, showing balanced momentum. MACD histogram is 0.02, a marginal positive impulse.
At the same time, the Bollinger mid is 266.32 with bands at 270.53 and 262.11, keeping price centered in a contained envelope. Hourly ATR is 1.96, indicating compression versus the daily range. Therefore, the hourly pivot at 266.60 with R1 266.95 and S1 265.94 anchors day control for Amazon Stock.
15‑Minute Pullback Within Broader Uptrend
In contrast, the 15‑minute view shows a gentle pullback. Price sits below the EMA20 at 267.66 and the EMA50 at 267.02 but holds above the EMA200 at 265.91. That is short‑term weakness within a bigger uptrend for AMZN. The RSI prints 38.24, reflecting soft momentum without a washout. MACD histogram is −0.29, so near‑term downside pressure persists.
At the same time, the lower Bollinger band sits at 266.37 with the mid at 268.02. Price is testing the lower edge. Bounces often start here, or bands can walk. Micro volatility remains small, with ATR at 0.70. The 15‑minute pivot is 266.55, with R1 266.85 and S1 265.99, keeping execution levels close.
News and Sentiment for Amazon Stock: Supportive With Some Caution
Notably, the news tape leans supportive even as some caution surfaces. Wells Fargo kept an Overweight while trimming its target to 312, showing high sell‑side conviction despite a minor cut. A separate piece pointed to potential upside toward 370. In contrast, one analysis flagged an “AI digestion” phase as higher capex could cool enthusiasm. Another noted AMZN recently cleared the 20‑day average, improving trend tone.
Scenarios for Amazon Stock: Bullish Path and Bearish Risk
Bullish Scenario
Therefore, the bullish setup favors a push through 267.45 and 268.66. Reclaiming the daily pivot and R1 would show control. A daily close back above the Bollinger mid at 267.10 signals trend follow‑through. A turn higher in daily MACD toward a positive histogram and RSI nudging above 60 would confirm re‑acceleration. If achieved, the upper band near 275.86 becomes the next reference. On the 1‑hour, holding above the EMA50 at 265.75 keeps intraday support intact.
Bearish Risk
On the other hand, risk builds on a slip below 265.11 and then the 20‑day EMA at 263.02. That would mark a loss of near support and the trend anchor. A daily MACD that sinks further negative and RSI rolling toward 50 extend momentum decay. Hourly loss of the EMA50 at 265.75 with RSI sub‑50 weakens structure. If that unfolds, the daily lower band at 258.33 becomes relevant, and a 15‑minute band walk under 266.37 would keep pressure into the close.
Bottom Line: Bias Stays Bullish as Tape Pauses
Overall, the main bias for Amazon Stock remains bullish on the daily trend, yet the tape is pausing. The market is coiled in the 266–269 band with an ATR‑defined daily swing near six points. Until momentum turns up or support fails, expect two‑sided trade with sensitivity to AI and infrastructure capex headlines.
Search
RECENT PRESS RELEASES
Related Post