Analysts flag rising liquidity and bitcoin’s rally potential
November 28, 2025
AI translated#Bitcoin#bitcoin price#CryptoQuant#Opinions
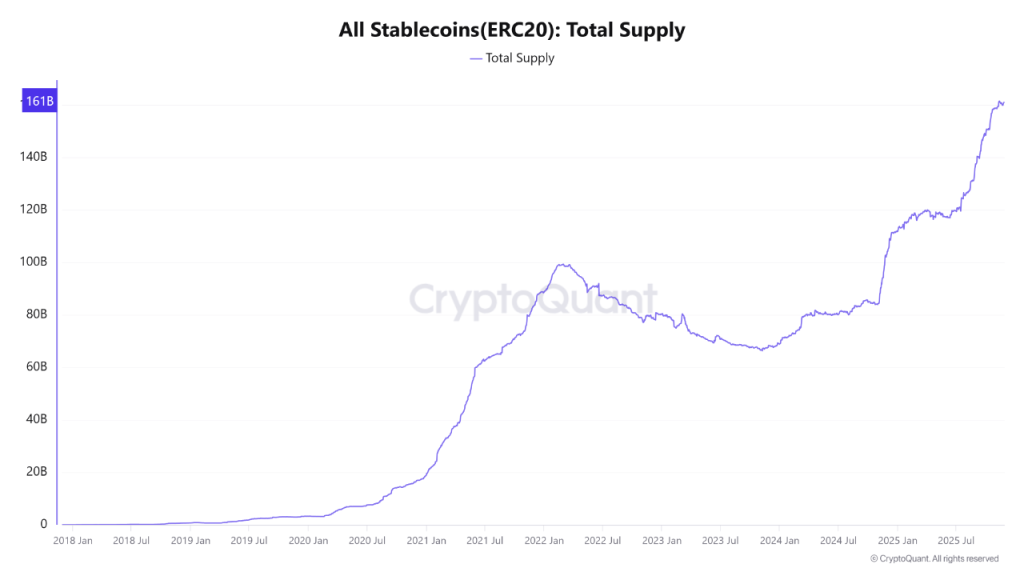
Stablecoins hit $160bn, a cleaner liquidity gauge as on-chain signals hint at a bitcoin rebound.
28.11.2025
The total stock of stablecoins in the ecosystem has hit a record $160bn, a more precise gauge of crypto-market liquidity than traditional money-supply measures, XWIN Research Japan said.
They noted that investors most often compare bitcoin’s trajectory with the global aggregate M2. The sharp rise in that measure did coincide with the 2020–2021 bull market. Yet over the past five years, the statistical correlation averaged only about 0.5.
“In periods of monetary tightening, as in 2022–2023, bitcoin displayed dynamics independent of M2. The money supply shapes the macro environment, but it is not a reliable indicator for forecasting the cryptocurrency’s price,” the experts stressed.
A more accurate metric is the total stock of stablecoins, which set an all-time high in 2025. XWIN Research Japan highlighted three reasons why it matters:
- stablecoins provide liquidity for trading and DeFi;
- these assets respond more quickly to shifts in demand;
- the gauge closely tracks institutional inflows, including those linked to exchange-traded funds.
“As during the 2021 bull trend and the 2024–2025 recovery, growth in the volume of ‘stable coins’ invariably preceded the rise in bitcoin,” the specialists said.
M2 reflects long-term trends, while stablecoin dynamics capture the crypto market’s true impulse, the analysts concluded.
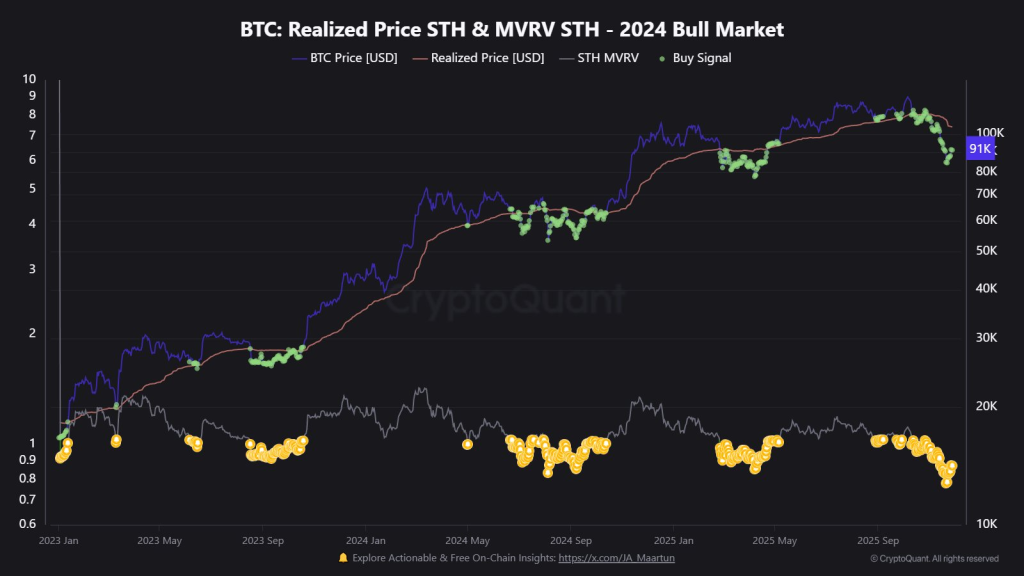
CryptoQuant analysts pointed to several key on-chain indicators that are laying the ground for a renewed rise in bitcoin’s price. The first—and one of the most significant—signals is deleveraging.
It triggers when open interest in the futures market falls by more than 12% within seven days. According to the experts, this is not a sign of market weakness but an indicator of its “healing.”
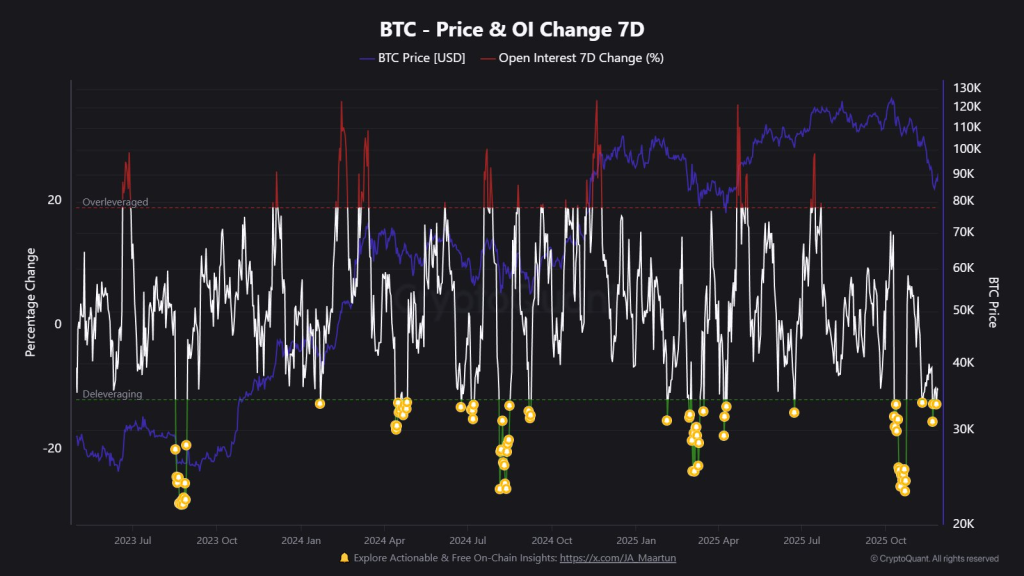
“Weak hands” that opened excessive positions are actively leaving the market, reducing selling pressure.
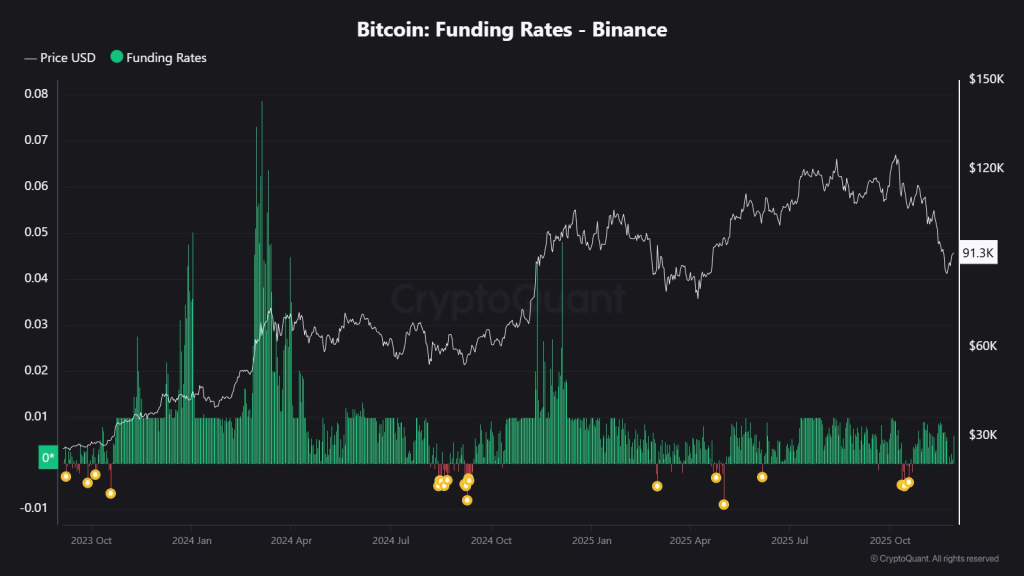
Negative funding on futures also points to strong rebound potential. Current rates indicate that most traders are short and pessimistic.
Historically, such periods are ideal entry points—any small price move can trigger a short squeeze, amplifying the rally.
The price of the first cryptocurrency has fallen below the average purchase price of short-term holders—meaning many recent entrants are now in the red.
In a still-bullish trend, such levels are viewed by institutional players and long-term holders as attractive accumulation zones, creating strong buying demand.
Over the week, on-chain bitcoin transfer volume fell 20% to $87bn, according to Glassnode.

Daily spot turnover also declined—to $12.8bn. This means the rebound above $92,000 was not accompanied by a surge in trading activity.
The pattern points to waning investor engagement, which is needed for further price gains.
November 2025 may turn out to be among the worst in bitcoin’s history. Since the start of the month, the price has fallen by more than 16%.
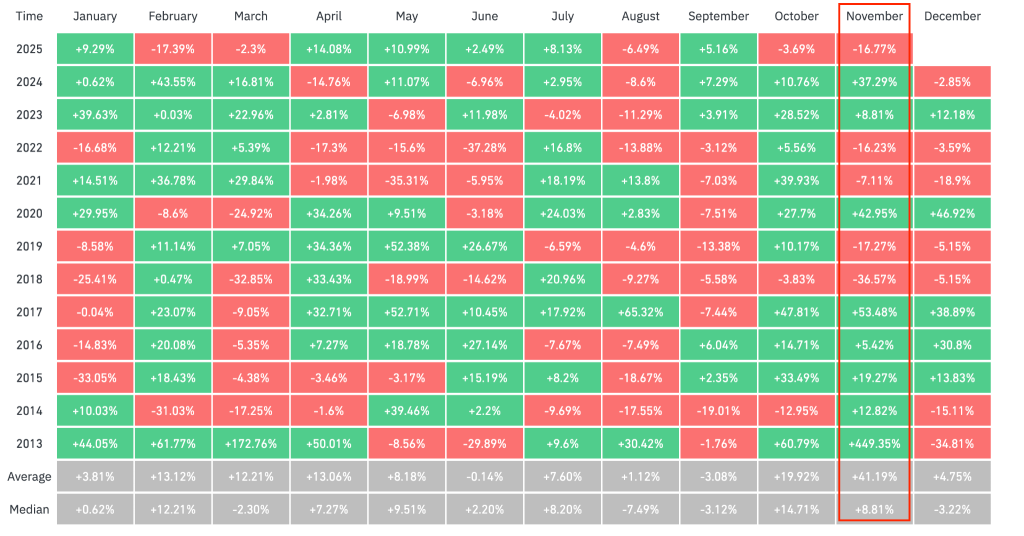
Analyst Sumit Kapoor suggested continued sideways action in December, as hinted by historical data. Almost every “red” November was followed by a similar December.
Technical analysts are watching for bitcoin to close the monthly candle around $93,000. If price momentum fades over the weekend of November 29 and 30, further downside is possible.
“As the month close approaches, I have highlighted the two most important levels to watch at this timeframe — $93,401 and $102,437,” noted the specialist under the nickname CrediBull Crypto.
In his view, a close above $93,000 “will be a positive signal,” and above $102,000 “incredibly bullish.”
At the time of writing, bitcoin is trading around $91,500, up 0.5% over the past 24 hours, according to CoinGecko.
Earlier, Glassnode analysts outlined obstacles on the way to a new all-time high for bitcoin.
Нашли ошибку в тексте? Выделите ее и нажмите CTRL+ENTER
Search
RECENT PRESS RELEASES
Related Post


