Assessment of coupling coordinated degree and driving mechanism of population-resource-environment-economy (PREE) system in Yellow River Basin, China
December 27, 2024
Abstract
Rapid urbanization and industrialization in China have brought economic growth and improved living standards, while environmental degradation and resource overexploitation occurred simultaneously. Yellow River Basin (YRB) also faces priorities of ecological protection and high-quality development. Therefore, it is essential for YRB to coordinate the relationship between socioeconomic and eco-environment. This study constructed a population-resource-environment-economy (PREE) system to evaluate basin sustainable development from 2011 to 2021, along with the entropy-TOPSIS method, coupling coordination degree model (CCDM), spatial autocorrelation method, Kernel density estimation, and GeoDetector model, to analyze the spatiotemporal distribution, spatial agglomeration characteristics, evolutionary trends, and driving mechanism. The results revealed that: (1) CCD in the YRB was at a medium level with an upward trend, while subsystems showed clear differences. (2) CCD’s geographical distribution exhibited a clustering feature, with high value concentrating downstream and low value concentrating upstream. (3) Evolutionary trends illustrated the differences in basin location and resource dependency. (4) Population density, green innovation level, and openness were the dominant driving factors of the PREE system. Relevant policies were proposed to manage and coordinate the human-nature relationship.
Introduction
Sustainable development goals proposed by the United Nations in 2015 included various aspects, discussed the relationship between humans and nature, and highlighted the interaction between socio-economy and eco-environment, which had been a continually focused topic. Under rapid urbanization and industrialization, economic development and living standards have continually improved, while environmental quality and resource exploration have faced significant challenges, requiring balanced strategies for sustainable development1. The socioeconomic system comprises a very wide scope, including economy, population, industrial structure, and society development2. The eco-environment system contains the ecosystem and environment, and pollution and governance are considered3. To build more sustainable cities, it would be advantageous to realize that the socio-economic and environmental spheres are developing in harmony.
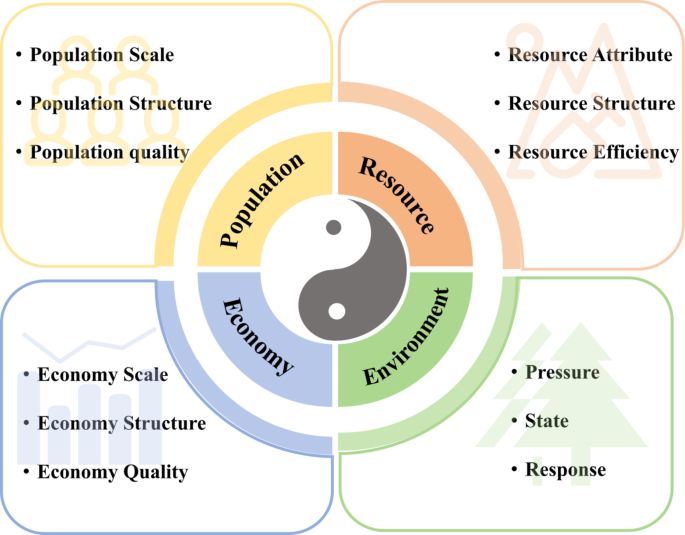
The development of human society and the economy is intrinsically linked to the availability and quality of resources and the environment4,5. Numerous theories have been proposed to explore the mechanisms of this interaction. For example, the Environmental Kuznets Curve (EKC) highlights the relationship between environmental quality and economic growth, suggesting that environmental degradation initially worsens with economic growth but improves after reaching a certain level of development6. Similarly, the resource curse theory examines how the characteristics of resource endowments influence economic development, revealing the potential for resource abundance to hinder growth under certain conditions7. Moreover, population growth adds further complexity to these interactions, as increasing population places significant pressure on the carrying capacity of resources and the environment8. This can lead to resource inefficiencies, environmental pollution, and ecological degradation. Conversely, insufficient resources and environmental deterioration constrain economic development, forming a feedback loop between these systems9. These observations highlight the close relationships among population, economy, resources, and the environment. Population and economic activities drive resource exploration and utilization, which, when managed rationally, can support environmental protection. At the same time, the environment provides essential resources and serves as the foundation for human activities. Examining these four systems together can provide valuable insights into how to better coordinate their interactions and promote sustainable development (Fig. 1).
Urban complex system research has been involved in the exploration of the relationship between socio-economy and eco-environment. Various systems introduced the complex interaction mechanism among population, resource, environment, and economy, including land-population, economy-environment, population-economy-land, economy-resource-environment, water-social economy-ecological environment10,11,12,13. Additionally, related resource evaluation methods were developed, such as resource use efficiency and environment carrying capacity have also been involved as important subsystem compositions in the urban complex systems14,15. Current population-related coordination research considered population scale population structure, population growth, and living standards16,17,18. In terms of the resource system, different resources were studied including water, land, and energy19,20,21. When it came to the environment system, plenty of factors were involved, such as afforestation, pollution, emission, and related reduction22,23. The economy system was mostly composed of economy scale, industrial condition, and economy quality13,24. Despite extensive studies in each of these systems, much of the current research tends to focus on coordinating two or three systems at a time to identify pathways for sustainable urban development. Few studies have simultaneously addressed the coordination of all four systems—population, economy, resources, and environment—within urban contexts, which leaves a significant gap in the literature25. This gap highlights the need for a more comprehensive approach that integrates all four systems to achieve holistic and sustainable urban development.
While previous studies have examined the relationships between population, economy, resources, and environment either separately or in pairs, there is a noticeable gap in research that comprehensively coordinates all four systems. Most existing frameworks focus on specific systems (e.g., the resource system or the economy system) or subsets of interactions (e.g., population-environment), but few have integrated them into a unified framework that accounts for their interdependencies and joint impact on sustainability. This study aims to address this gap by applying a multi-system approach to investigate the coordination of population, resources, environment, and economy, with a particular focus on the Yellow River Basin (YRB). The goal is to provide a more holistic understanding of the challenges and opportunities for sustainable urban development in the region. To achieve this, the study constructs a Population-Resource-Environment-Economy (PREE) system to assess the coordination degree in the YRB. The analysis includes the spatiotemporal distribution characteristics of PREE, an exploration of discrepancies within various categories of streams and resource attributes, and an identification of the influence and interactions between different driving factors. This research aims to offer a more systematic approach to evaluating sustainable development conditions and identify key drivers of sustainability in the region.
The contribution of this study to the literature lies in the development of the new PREE index system. By integrating all four systems, the PREE index provides a comprehensive framework for evaluating regional sustainability and identifies critical driving factors. This contribution advances sustainability metrics and offers a valuable tool for understanding the complex interdependencies between population, resources, economy, and environment, particularly in the YRB. The research will proceed as follows: First, it evaluates the sustainable development of YRB cities using the four subsystems, which will reveal the coordination degree of PREE in the basin and provide a comprehensive view of regional sustainability. Second, the study discusses spatial distribution and evolutionary trends, highlighting geographical patterns and differences based on location and resource dependency. Third, the driving mechanism will be explored to identify dominant factors and their interactions, aiming to improve the PREE level. Finally, relevant policy implications will be proposed based on the findings and the unique features of the basin.
Study area and methods
Study area
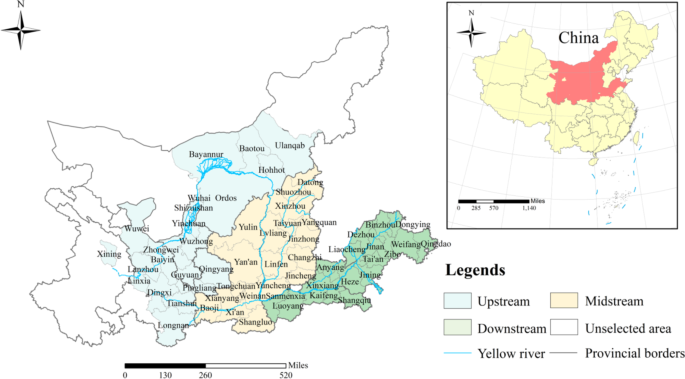
The Yellow River Basin (YRB), one of China’s most strategically important regions, flows through nine provinces, encompassing diverse terrains and playing a pivotal role in national development (Fig. 2). In 2020, 15.14% of China’s total population resided in the YRB, with a high concentration in downstream areas. This population distribution has led to significant demographic pressure, particularly in urban regions where more than half of the cities are resource-based or old industrial cities reliant on mineral extraction and processing26. These activities have driven regional economic growth but also intensified competition for resources and heightened environmental risks.
Study area. Source: Created by the authors using ArcMap 10.8 (Esri, Redlands, CA, USA; https://www.esri.com.)
In terms of economic performance, the YRB contributes 20% of China’s GDP, underscoring its importance to national productivity27. However, the basin’s economic development faces structural challenges. Heavy reliance on traditional industries has led to resource over-exploitation, environmental degradation, and inefficiencies in economic growth. Resource shortages, particularly in water and minerals, are becoming critical constraints. Soil erosion and the degradation of cultivated land further weaken agricultural productivity, jeopardizing food security and rural livelihoods28.
Environmental challenges in the basin are deeply intertwined with resource pressures. The region’s fragile ecological systems are vulnerable to overuse and high-intensity human activities, which have caused severe damage. Widespread soil erosion, deforestation, and overgrazing have destabilized ecosystems, while extensive water extraction has contributed to persistent water shortages. Pollution of air, land, and water adds another layer of complexity, severely impacting public health and ecological sustainability29,30.
The combined impact of these pressures—population growth, resource depletion, environmental degradation, and economic constraints—has created a critical need for balance. Historically, development in the YRB has been marked by conflicts between economic expansion and environmental protection, particularly as high-intensity human activities have strained the basin’s resources and ecosystems31,32. Achieving sustainable development in the basin requires reconciling these conflicts through coordinated efforts to harmonize population growth, resource management, environmental restoration, and economic restructuring.
Research methods
Entropy-Topsis model
The entropy-Topsis model has been widely applied in urban complex systems coordination research33. First, data standardization is required to eliminate differences in data caused by different dimensions.
where, i represents the city i in YRB, j represents the indicator of the index system, (X_ij) is the initial value, and (Y_ij) represents the normalization result of (X_ij).
Then, the entropy value (E_j) and indicator weight (W_ij) would be calculated to build the weighted normalized decision matrix. And the weighted matrix R of the PREE index system is constructed.
where, (r_ij) should satisfy (r_ij = W_j times Y_ij).
Next, according to the weighted matrix R, the optimal scheme (Q_j^ + ) and the worst scheme (Q_j^ – ) are determined. Calculate the Euclidean distance between each measurement scheme (d_i^ + ) and the optimal and worst schemes (d_i^ – ).
Last, calculate the relative proximity (C__i ) of each measurement scheme to the ideal scheme. (C_i) ranges from 0 to 1.
Coupling coordination degree model
The coupling coordination degree is frequently used to assess the balance and interaction within urban complex systems comprising multiple subsystems, aiding in the evaluation of urban sustainability19,34.
where, C represents coupling degree of PREE system, and (P) represents population subsystem, (R) represents resource subsystem, (E_1) represents environment subsystem, (E_2) represents economy subsystem.
T is the integrated index of PREE systems. Four subsystems are equally important in this research, so the coefficients of each subsystem would be set as (alpha = beta = gamma = mu = 1/4). D is the coupling coordination degree of PREE system. The coupling coordination degree is classified into ten levels25, extreme dysfunctional decline (0 ≤ D < 0.1), serious dysfunctional decline (0.1 ≤ D < 0.2), moderate dysfunctional decline (0.2 ≤ D < 0.3), mild dysfunctional decline (0.3 ≤ D < 0.4), on the verge of dysfunctional decline (0.4 ≤ D < 0.5), barely coupling coordination (0.5 ≤ D < 0.6), primary coupling coordination (0.6 ≤ D < 0.7), moderate coupling coordination (0.7 ≤ D < 0.8), good coupling coordination (0.8 ≤ D < 0.9), quality coupling coordination (0.9 ≤ D < 1.0).
Spatial autocorrelation
Moran’s I index is often used to measure the degree to which an area is related to its neighbors. To explore the spatial correlation of the synergistic development of PREE, global autocorrelation was carried out to measure the CCD16.
where, (W_ij) is the spatial adjacency matrix, (x_i) represents the CCD results of city i, (overlinex) is the average value of the CCD results in the basin, n is the amount of the YRB cities.
The objective of local spatial autocorrelation is to provide a perspective on how regional differences in spatial processes impact the overall spatial pattern by focusing on variances in small-scale spatial processes. Compared with global spatial autocorrelation, it can more accurately reflect the local characteristics and spatial heterogeneity10.
where (G_i^*) represents the statistic of Getis-Ord, d represents the distance. (E(G_i^* )) is the mathematic expectation of (G_i^*), and (Var(G_i^* )) represents the deviation.
Kernel density estimation
Kernel density estimation is a key non-parametric method that does not rely on assumptions about data distribution. It generates a continuous probability density curve based on the data’s inherent distribution characteristics, enabling a visual representation of the variables’ temporal evolution trend35.
where (Kleft( fracx – X_i h right)) represents the kernel function, (X_i) is the CCD results of PREE system, (overlinex) is the mean value, n represents the amount of YRB cities.
GeoDetector model
The geodetector model aims to detect the consistency of the spatial stratified heterogeneity between the dependent variable and independent variables and measures the explanation degree and the interactions between independent variables36. The factor detection and interaction detection models will be used to explore the impact, as confirmed by previous studies37,38. In the factor detection model, q is the key value to evaluate the explanation degree of independent variables to dependent variable.
where h = 1, L represents the strata of the dependent variable Y or independent variable X. (N_h) and (N) represent the units of strata h and research area. SSW represents the Within Sum of Squares, and SST represents the Total Sum of Squares.
The interaction detection model is set to identify the interaction among the independent variables. Specifically, it aims to evaluate whether the combination of independent variables X1 and X2 would increase or decrease the explanation power, or whether the impacts of these factors on Y are independent.
Indicator selection
Index construction
The Population-Resource-Environment-Economy (PREE) index system was developed following scientific, systematic, and comprehensive guidelines to ensure a holistic evaluation of regional sustainable development (Table 1). The selection of indicators was carefully considered to reflect the multidimensional aspects of each subsystem.
For the population subsystem, indicators were selected based on the scale-structure-quality framework39. The total population and natural growth rate were included to assess overall population size and growth dynamics, reflecting demographic trends25. The urbanization rate was chosen to represent the structural shift from rural to urban areas, providing insight into urban development and population distribution40. Hospital and educational infrastructure were selected as indicators of living standards because they directly impact the quality of life and social well-being18. These indicators represent the core dimensions of population development, ensuring a balanced assessment of demographic size, structure, and quality.
In the resource subsystem, indicators were chosen to capture resource attributes, structure, and utilization efficiency. Per capita water and arable land reflect the availability of essential resources for human and agricultural use, which are critical for sustainability17. The proportion of agriculture in water and land use was included to reflect resource structure, indicating the extent of land and water resources dedicated to agricultural production41. For utilization efficiency, water and energy consumption relative to GDP were selected to measure how effectively resources are being utilized in economic activities42. These indicators provide a comprehensive view of resource availability, structural use, and efficiency.
The environmental subsystem indicators were based on the Pressure-State-Response (PSR) framework19,43, assessing environmental pressures, conditions, and responses. The pressure dimension includes indicators for major pollution sources, such as carbon dioxide emissions, PM2.5 levels, and industrial sulfur dioxide emissions, reflecting the environmental burden from human activities24. The state dimension measures overall environmental conditions through indicators like NDVI (Normalized Difference Vegetation Index) and park green space area per capita, reflecting urban greenery and ecosystem health25. In the response dimension, the green coverage rate of built-up areas and the proportion of days with good air quality were selected. The latter was chosen to reflect the effectiveness of air quality management and the success of measures taken to improve environmental quality, as more days of good air quality indicate better environmental governance and successful mitigation of pollution42. This indicator was placed in the response dimension because it directly measures the outcome of efforts to improve air quality and environmental health.
For the economy subsystem, indicators followed the scale-structure-quality framework. GDP and fixed asset investment were selected to assess the economic scale, providing insight into overall economic size and infrastructure investments44. The proportion of second and tertiary industries was chosen to represent the economic structure, highlighting the shift from primary industries (e.g., agriculture, mining) to secondary and tertiary industries (e.g., manufacturing, services) that contribute to higher economic value and sustainability24. Finally, the annual GDP growth rate and urban per capita disposable income were selected to evaluate economic quality, reflecting dynamic economic performance and residents’ standard of living34.
Driving factors selection
To explore the influencing factors of CCD in YRB, this study chose seven driving factors to identify the driving mechanism (Table 2). GDP per capita (X1) represents the economic development quality. It encompassed not only the pace and scale of economic growth but also the sustainability of economic growth, the improvement of social welfare, the preservation of the environment, and the rationality of economic structure10. The impact of population density (X2) on CCD was reflected in the tension of resource allocation and the pressure on the ecological environment. While high population density is likely to bring dynamism to the urban economy and benefit economic growth40. Industrial advancement (X3) can improve economic output and efficiency, realize the sustainable use of resources, improve the urban ecological environment, and promote the optimization of urban population structure45. With clean technology, green innovation (X4) could foster sustainable economic growth, population growth, resource efficiency, environmental protection, and population quality46. Moreover, the development of openness (X5) could attract more population agglomeration, encourage the process of urbanization, support the coordinated development of resources and economy, promote the improvement and preservation of the environment, and promote the transformation and upgrading of the economy47. The degree of environmental regulation (X6) can help direct employment and population movement, improve resource allocation, and find a balance between environmental preservation and economic growth48. The governance degree (X7) will support the government’s efforts to better regulate and control the macroeconomic environment, guide resource flow toward environmentally friendly and efficient areas, and ultimately aid in maximizing the efficiency of the economy.
Data sources
This research was conducted in 60 cities from 2011 to 2021 in the YRB. Related statistical data was acquired from the China Urban Statistical Book and China Urban and Rural Construction Statistical Yearbook. Water resource data was collected from the Water Resource Bulletin in each province. NDVI data was acquired from MOD13A3 datasets published by NASA on a regular basis. PM2.5 data was collected from the Atmospheric Composition Analysis Group of Washington University in St. Louis. The green innovation data was collected from the patent search and analysis database of the China National Intellectual Property Administration. Missing data were filled by interpolation.
Results
Spatiotemporal distribution of subsystems
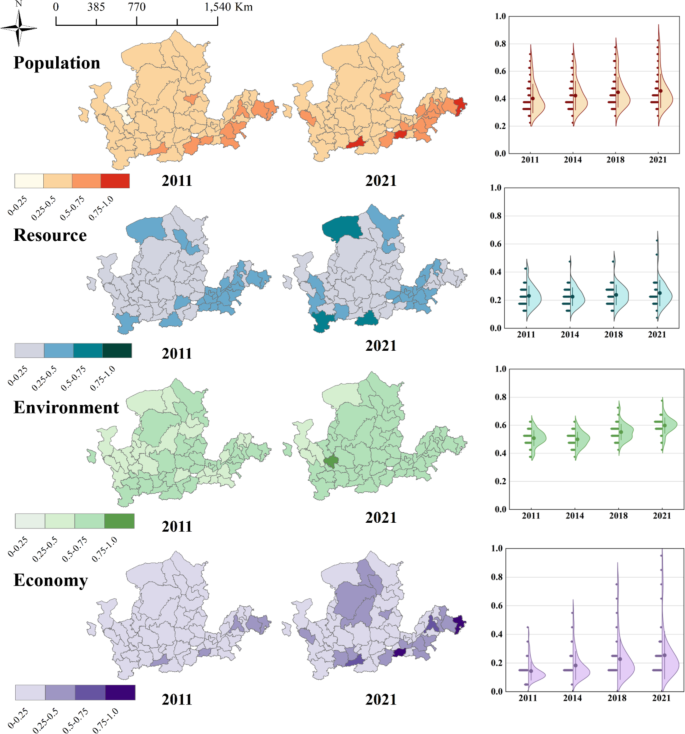
Based on the calculation of the PREE system in the YRB, the results of the spatiotemporal distribution of subsystems were shown in Fig. 3. First, the population subsystem exhibited a steady growth trend, increasing from 0.40 in 2011 to 0.45 in 2021. As can be observed from the violin chart, the values mostly concentrated around 0.4 with a dispersion tendency. Also, the range of population subsystem has become wider during the research period. In terms of geographical distribution, cities with high values gathered in midstream and downstream, such as Zhengzhou (0.84), Xi’an (0.79), and Qingdao (0.75) in 2021. Second, the resource subsystem performed a steady tendency with an increased rate of 8% from 2011 to 2021. Its distribution displayed a concentration of 0.2, and the variance became larger at the end of the research period. The spatial patterning showed a comparative scatter characteristic, with high-value distribution in upstream and midstream, Shangluo (0.62), Bayannur (0.54), and Longnan (0.50) were all located in upstream and midstream. Then, the environmental subsystem showed relatively higher results, climbing from 0.51 in 2011 to 0.59 in 2021. The geographical distribution demonstrated a balanced feature, and Guyuan reached 0.75 in 2021. In contrast, the economy subsystem exhibited a dispersion and strong growth tendency that became more evident throughout the years, with an average value rise of 76% during the research period. Additionally, there is a substantial disparity in the spatial distribution of streams, with Qingdao (0.92) and Zhengzhou (0.81) situated downstream in 2021. Zhongwei (0.12) and Wuzhong (0.13) had the lowest YRB values and were situated in the middle. In summary, the subsystems exhibited unique features associated with their spatial distribution and generally exhibited an increasing trend.
Spatiotemporal distribution of CCD
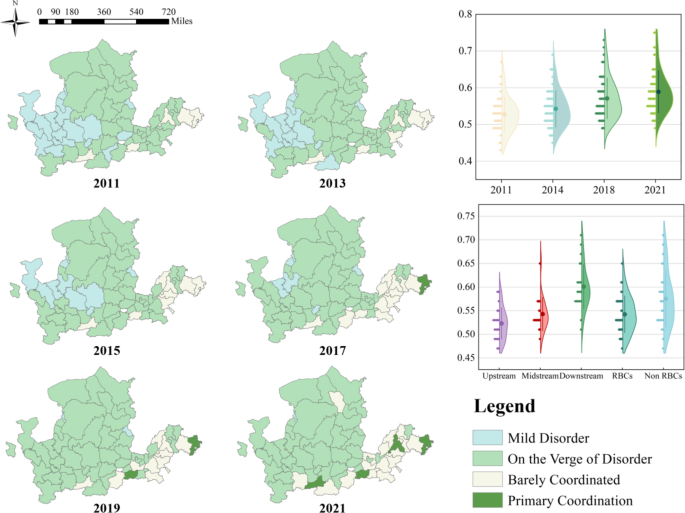
According to Fig. 4, the spatiotemporal distribution of CCD has demonstrated a growing tendency and evident regional differences during the research period. In terms of time distribution, CCD has increased from 0.53 to 0.58 and was at a medium to upper level. In terms of spatial pattern, CCD has demonstrated evident regional differences. Different classifications in YRB have also shown a distinctive feature. In terms of stream distribution, it showed an increasing trend from upstream to downstream. And based on resource dependency, resource-based cities (RBCs) performed lower than the cities that were not resource-based (Non-RBCs) which was coherent with the previous study49.
The graph showed that the number of cities experiencing mild dysfunctional decline had been steadily diminishing, and disappeared in 2021, which were clustering in upstream. With 37 cities in 2011 and 39 cities in 2021, a substantial percentage of the cities in YRB were on the verge of dysfunctional decline. Concerning the distribution of barely coordinated cities, it can be observed that their number is increasing within the basin. Specifically, in 2011 cities that were barely coordinated only included Xi’an, Zhengzhou, Jinan, Qingdao, and Weifang. The number of cities that are in this classification reached 16 in 2021. In terms of cities in primary coordination, there were no cities involved in 2011. In 2017, Qingdao was the only city to achieve this labeling; however, in 2021, the distribution of primary coordination cities spread out and four cities were at the primary coupling coordination level.
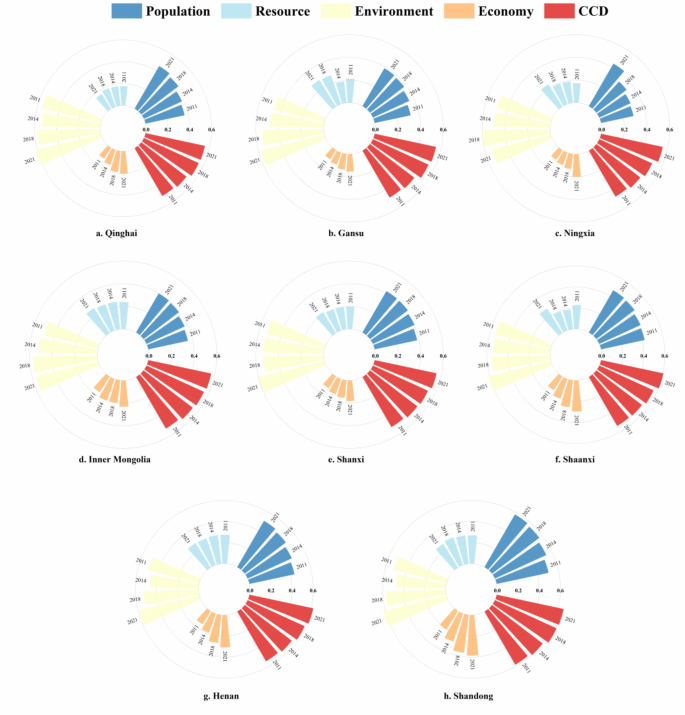
To further discover the regional differences, Fig. 5 exhibited the performance of subsystems and CCD of each province. It could be observed that there were apparent provincial differences in the YRB, and provinces faced different issues regarding subsystem development. In terms of CCD value, only Henan and Shandong exceeded 0.6 at the stage of primary coordination by the end of the research period, while the rest of the provinces were quite close. The population subsystem also exhibited that the results of Ningxia in 2021was greater than 0.4, while other provinces such as Shaanxi, Henan, and Shandong have exceeded 0.4 for a long period. The resource and environment subsystems both showed a generally stabilized tendency in provinces. However, the economy subsystem was differentiated from the provinces. Shandong and Henan were at the upper level. Inner Mongolia, Shanxi, and Shaanxi were at the medium level, while Ningxia, Gansu, and Qinghai were at the lower level.
Spatial autocorrelation
Global spatial autocorrelation
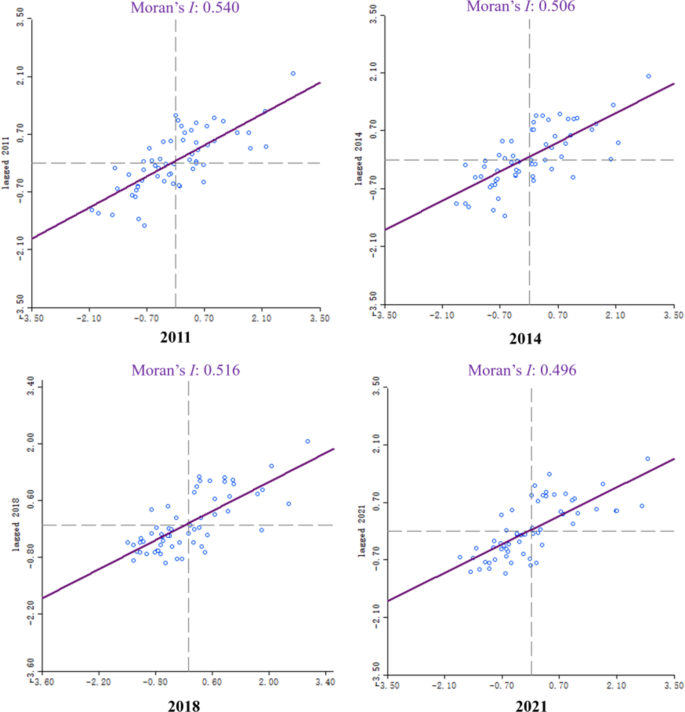
Figure 6 demonstrated Moran’s I index to explore the spatial agglomeration of CCD in the YRB. As could be seen from the graph, Moran’s I index of selected years was all greater than 0, demonstrating the positive spatial correlation of CCD. Moreover, the values around 0.5 can prove the strength of correlation, indicating CCD has strong spatial agglomeration.
Local spatial autocorrelation
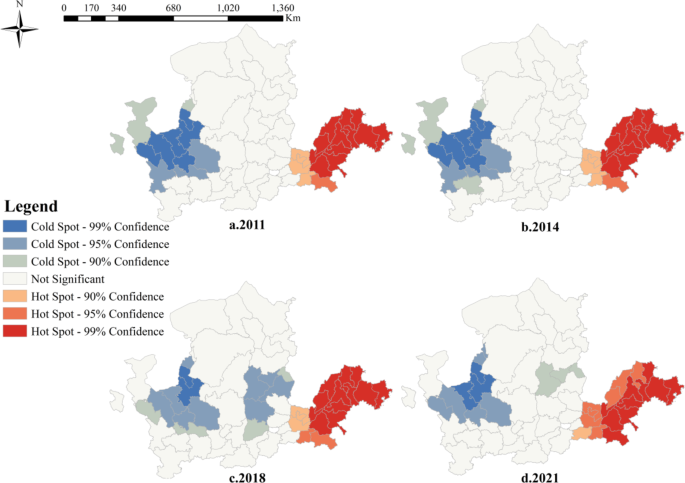
To explore the spatial agglomeration of CCD in the YRB, local spatial autocorrelation could identify the high-value and low-value clusters. Figure 7 displayed the spatial distribution of hot spots and cold spots of the results. It could be observed that the hot spots were concentrated in the downstream of the basin, while the cold spots were concentrated in the upstream. The hot spots have expanded from 2011 to 2021, while cold spots have been gradually shrinking. The number of cold spots has decreased from 13 cities in 2011 to 11 cities in 2021.
Kernel density estimation
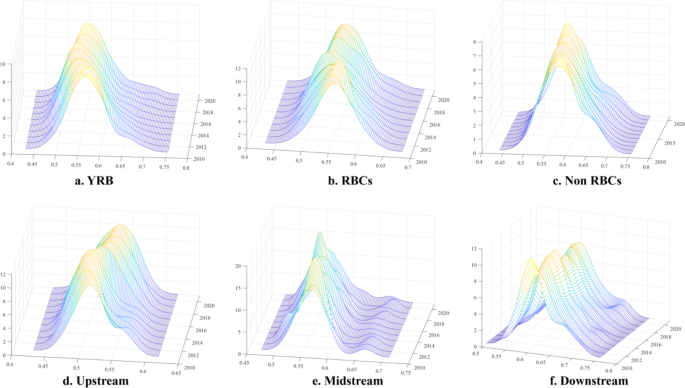
Kernel density estimation could visualize the time evolution process in the YRB. Based on the spatial distribution feature, the differences in branches and resource dependency were also considered and exhibited in Fig. 8. The kernel density curve of YRB has slightly moved to the right side, indicating the CCD has improved during the research period. And the width has become broader, which meant the regional disparity turned into more serious.
Regarding the classification of resource dependency, the difference between Resource-Based Cities (RBCs) and non Resource-Based Cities (Non-RBCs). The kernel density curve of RBCs has moved to the left side, indicating the CCD has decreased. While the curve of non RBCs demonstrated a stable tendency, the width was wider than the RBCs, indicating the regional disparity in non RBCs was more serious than the RBCs.
Regarding the location’s distribution, the upstream curve showed progress in moving to the right side, indicating the improvement of CCD. While the curve of midstream and downstream exhibited two polar, demonstrating a trend of polarization. Notably, the internal regional disparity of downstream was more serious than upstream and midstream due to the width of the curve.
Geodetector results
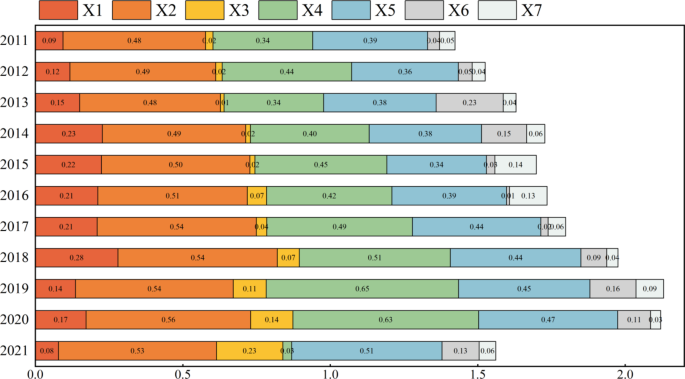
Based on the geodetecor analysis results, there were changes in the q-value and rank of the driving factors in different years, which was displayed in Fig. 9. From 2011 to 2021, the average q-value of driving factors ranked: X2(0.51) > X4(0.43) > X5(0.41) > X1(0.17) > X6(0.09) > X7(0.07) > X3(0.07), showing that population density (X2), green innovation (X4), openness (X5), and economic development (X1) had a major influence, while the remaining driving factors had a smaller effect on CCD. In terms of time variation of driving factors, population density (X2) showed a continued increasing trend, demonstrating the level of urban agglomeration could affect the CCD performance. Moreover, the q value of openness (X5) has constantly raised during the research period and demonstrated the influence on the spatial differentiation of CCDs was also increasing. Notably, the q value of green innovation level (X4) had shown a gradually strong impact, while the q value dropped to 0.03 in 2021 the possible reason for the shock of COVID-19. However, the q value of economic development (X1) exhibited a fluctuated tendency, indicating that economic development could accelerate the CCD in the beginning, and gradually become weakened. Additionally, industrial advancement (X3) had an increasing impact on CCD from 2011 to 2021, illustrating the transformation of industry could exert impacts on CCD performance.
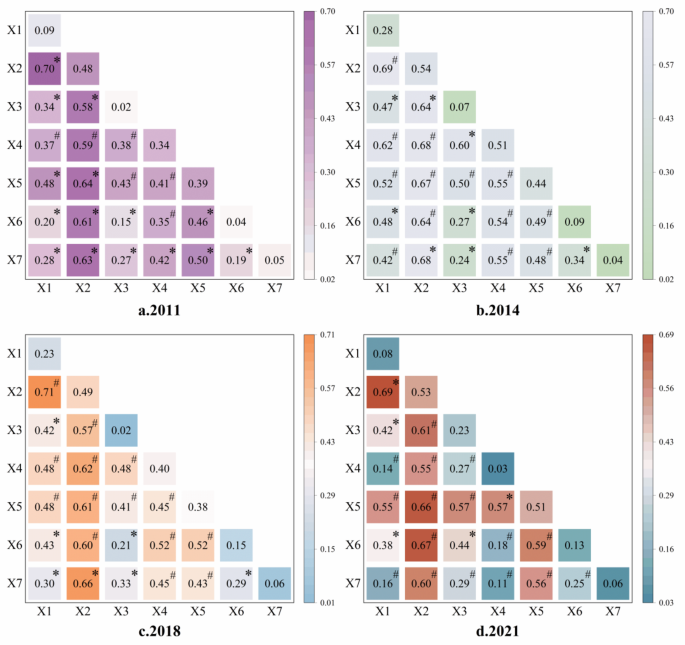
Figure 10 illustrated the interactive detection of driving factors in YRB from 2011 to 2021. It aimed to examine whether the effects of these factors on the CCD were independent of each other, and results showed that each pair of factors existed non-linear or bi-linear enhancements.
In 2011, most of the interaction results exhibited non-linear enhancements. The synergy effect between economic development (X1) and population density (X2) had the largest explanation degree (0.70) of CCD. Then, the interaction effects between population density(X2) and openness (X5), population density (X2) and environmental regulation intensity (X6) reached above 0.61. In 2014, most of the non-linear enhancements transferred to bi-linear enhancements. It was noticeable that the synergy effect between population density (X2) and green innovation level (X4) increased to 0.68 with the non-linear effects. In 2018, the interaction effect between openness (X5) and environmental regulation intensities (X6) reached 0.52. Notably, the synergy effect between population density and other factors was mostly above 0.60. In 2021, the synergy effect remained the stable increasing trend. Specifically, the interaction between openness (X5) and industrial advancement (X3), and green innovation level (X4) both gained 0.57, indicating the increasing explanation power of the interaction results.
Discussion
This study aimed to address the gap in the literature by constructing a population-resource-environment-economy (PREE) index system to assess regional sustainable development in the Yellow River Basin (YRB). The results contribute to a more comprehensive understanding of how the subsystems of population, resources, environment, and economy interact, and how their coordination affects sustainable development in this ecologically sensitive and resource-dependent region. By integrating all four subsystems, this study provides a more holistic perspective compared to previous studies that focused on individual systems or pairwise interactions50,51.
The analysis of subsystem performance revealed that the environment subsystem ranked the highest, followed by population, resources, and economy. This is consistent with earlier studies2,49 and can be attributed to the positive impacts of key environmental policies, such as the Three-North Shelterbelt Forest Program and the Grain for Green Project, which have contributed to increases in forest coverage and reductions in carbon emissions52. On the other hand, the economy subsystem ranked lower, mainly due to the region’s reliance on an underdeveloped industrial structure and traditional development models53. These findings highlight the challenge of balancing economic growth with environmental sustainability in the region. Additionally, the resource subsystem exhibited a stable trend, indicating that short-term changes in population or economy have little impact on the overall availability and distribution of land and water resources. This stability underscores the importance of sustainable resource management to meet growing demands as urbanization continues41.
A key finding of this study was the spatial distribution of the coordination degree (CCD) across the YRB. The downstream cities exhibited higher coordination levels due to rapid urbanization and economic development, while upstream areas, though ecologically healthier, are limited by smaller populations and slower economic growth. This geographical disparity is consistent with prior studies54,55, which have shown that different regions within the YRB face unique challenges in balancing economic development with environmental preservation. The midstream region, rich in natural resources but ecologically fragile, faces the dual challenge of managing resource extraction while protecting the environment.
The analysis of driving factors revealed that population density, green innovation, and openness were the primary drivers of CCD in the YRB. Population density fosters agglomeration effects, promoting resource utilization efficiency and economic growth26. Green innovation and openness have increasingly driven industrial transformation and reduced environmental pollution, suggesting a growing recognition of the importance of sustainable growth. Notably, the synergy between population density and economic quality remained consistently high, indicating the critical role of their interaction in driving sustainable development56. Furthermore, the rising interaction between green innovation and environmental regulation provides support for the Porter Hypothesis, which posits that stricter environmental regulations can spur innovation and enhance competitiveness. Interestingly, the analysis also showed an increasing complexity in the driving mechanism over time, with bi-linear interactions becoming more significant. This suggests that as the region continues to develop, the interdependencies between the population, economy, resources, and environment are becoming more intricate, necessitating more nuanced interventions to achieve coordinated development across all subsystems.
The main contribution of this study lies in its development of the PREE index system, offering a systematic framework for assessing regional sustainable development. By integrating all four subsystems, the study provides valuable insights into the interdependencies between population, resources, economy, and environment. This approach allows for a more comprehensive assessment of regional development and contributes to the understanding of how these systems coordinate to achieve sustainability in the YRB.
Conclusion and policy implications
Conclusion
This study assessed the sustainable development of the Population-Resource-Environment-Economy (PREE) system in 60 cities within the Yellow River Basin (YRB) from 2011 to 2021 using a coupling coordination degree (CCD) model. The findings indicate the following:
-
(1)
CCD Trends: The CCD in the YRB showed a medium level with an upward trend over the study period. Most cities were at risk of dysfunctional decline, though cities in the primary coordination stage consistently improved. The economy subsystem was relatively underdeveloped compared to the other subsystems, with significant spatial distribution disparities.
-
(2)
Spatial Distribution and Evolution: The geographical distribution of CCD exhibited clear spatial clustering patterns. The downstream region had higher CCD values, while the upstream region showed lower values. This disparity was largely due to differences in regional prosperity, population agglomeration effects, and the effectiveness of resource exploitation policies. Additionally, the varying levels of resource dependency across regions were influenced by industrial structure, resource endowment, economic development types, and policy support.
-
(3)
Driving Factors: Population density emerged as the dominant driving factor for PREE development in the YRB, with green innovation and openness also playing significant roles. The interaction between these factors became more complex over time, highlighting the growing importance of technological advancements. Despite this complexity, the agglomeration effects of population and economy continued to drive PREE development, underscoring technology’s role in achieving coordinated growth.
Like current other research, this study also had some limitations. First, due to the availability, some data were not able to be acquired or largely missing which are not considered in the indicator system. Second, the regional disparity in the YRB could be deeply explored the behind reason and quantify the regional gap. Third, it could analyze the spatial spillover effect of the driving factors and introduce more related methods to study the driving mechanism in the future.
Policy implications
-
(1)
When implementing policies for coordinated growth, it is imperative to consider the diverse development of the population, resources, environment, and economy in YRB. Optimize population concentration in places with strong economic and environmental sectors to improve living conditions and human resources. Encourage green innovation to reduce pollution and resource consumption while strengthening environmental governance. To support YRB’s economic development and promote regional collaboration for shared benefit, bolster trade and economic cooperation internationally.
-
(2)
YRB’s upstream, midstream, and downstream development strategies need to take into consideration their distinctive features. Upstream places a higher priority on ecological preservation, guaranteeing sustainable water use with initiatives like soil conservation and replanting. Midstream balances environmental preservation with the green shift of resource-based sectors, emphasizing resource development and economic change. High-quality economic growth, innovation, and environmental governance are prioritized downstream. Improve regionally coordinated development through project collaboration and policy advice.
-
(3)
Resource-based and non-resource-based cities have distinct patterns of CCD, requiring customized approaches. Resource-based cities ought to modernize their sectors, broaden their economic bases, and lessen their reliance on natural resources. Non-resource cities ought to capitalize on comparative advantages, promote innovation, and develop competitive industries. To support YRB’s all-encompassing growth, intensify cooperation between resource-dependent and non-dependent cities by sharing resources, docking marketplaces, and collaborating technologically.
Data availability
Data will be made available on request from the corresponding author Yi Xiao and Huan Huang.
References
-
Dahiya, B. Cities in Asia, 2012: Demographics, economics, poverty, environment and governance. Cities 29, S44–S61 (2012).
-
Xiao, Y., Wang, R., Wang, F., Huang, H. & Wang, J. Investigation on spatial and temporal variation of coupling coordination between socioeconomic and ecological environment: A case study of the Loess Plateau, China. Ecol. Indic. 136, 108667 (2022).
-
Li, J., Sun, W., Li, M. & Meng, L. Y. Coupling coordination degree of production, living and ecological spaces and its influencing factors in the Yellow River Basin. J. Clean. Prod. 298, 126803 (2021).
-
Kemp-Benedict, E. The inverted pyramid: A neo-Ricardian view on the economy–environment relationship. Ecol. Econ. 107, 230–241 (2014).
-
Pimentel, D. & Pimentel, M. Global environmental resources versus world population growth. Ecol. Econ. 59(2), 195–198 (2006).
-
Gill, A. R., Viswanathan, K. K. & Hassan, S. The Environmental Kuznets Curve (EKC) and the Environmental Problem of the Day. Renew. Sustain. Energy Rev. 81(2), 1636–1642 (2018).
-
Haseeb, M., Kot, S., Iqbal Hussain, H. & Kamarudin, F. The natural resources curse-economic growth hypotheses: Quantile–on–Quantile evidence from top Asian economies. J. Clean. Prod. 279, 123596 (2021).
-
Ait-Aoudia, M. N. & Berezowska-Azzag, E. Water resources carrying capacity assessment: The case of Algeria’s capital city. Habitat Int. 58, 51–58 (2016).
-
Zhou, R. et al. Connection number based model for coordination development evaluation of regional water resources, social economy and ecological environment complex system. J. Environ. Manag. 339, 117913 (2023).
-
Luo, J., Xing, X., Wu, Y., Zhang, W. & Chen, R. S. Spatio-temporal analysis on built-up land expansion and population growth in the Yangtze River Delta Region, China: From a coordination perspective. Appl. Geogr. 96, 98–108 (2018).
-
Shi, T., Yang, S., Zhang, W. & Zhou, Q. Coupling coordination degree measurement and spatiotemporal heterogeneity between economic development and ecological environment––Empirical evidence from tropical and subtropical regions of China. J. Clean. Prod. 244, 118739 (2020).
-
Cai, E., Zhao, X., Zhang, S. & Li, L. Spatial agglomeration and coupling coordination of population, economics, and construction land in Chinese prefecture-level cities from 2010 to 2020. Land 12(8), 1561 (2023).
-
Lu, X., Xue, M. & Hu, M. Dynamic simulation and assessment of the coupling coordination degree of the economy–resource–environment system: Case of Wuhan City in China. J. Environ. Manag. 230, 474–487 (2019).
-
Bai, Z., Ling, H., Liu, H., Liangzhi, L. & Jiang, X. Assessment of coordinated development between urban land use efficiency and ecological carrying capacity: Case study of the cities in Inner Mongolia. Ecol. Indic. 155, 110933 (2023).
-
Ren, Y. et al. Conflict or coordination? Analysis of spatio-temporal coupling relationship between urbanization and eco-efficiency: a case study of urban agglomerations in the Yellow River Basin, China. Land 11(6), 882 (2022).
-
Huang, L., Yang, P., Zhang, B. & Hu, W. Spatio-temporal coupling characteristics and the driving mechanism of population-land-industry urbanization in the Yangtze River Economic Belt. Land 10(4), 400 (2021).
-
Wang, J. et al. Factors affecting phase change in coupling coordination between population, crop yield, and soil erosion in China’s 281 cities. Land Use Policy 132, 106761 (2023).
-
Gan, L., Shi, H., Hu, Y., Lev, B. & Lan, H. Coupling coordination degree for urbanization city-industry integration level: Sichuan case. Sustain. Cities Soc. 58, 102136 (2020).
-
Zhang, J. & Dong, Z. Assessment of coupling coordination degree and water resources carrying capacity of Hebei Province (China) based on WRESP2D2P framework and GTWR approach. Sustain. Cities Soc. 82, 103862 (2022).
-
Liu, C., Xu, Y., Lu, X. & Han, J. Trade-offs and driving forces of land use functions in ecologically fragile areas of northern Hebei Province: Spatiotemporal analysis. Land Use Policy 104, 105387 (2021).
-
Wang, X., Song, J., Duan, H. & Wang, X. Coupling between energy efficiency and industrial structure: An urban agglomeration case. Energy 234, 121304 (2021).
-
Li, W. & Yi, P. Assessment of city sustainability—Coupling coordinated development among economy, society and environment. J. Clean. Prod. 256, 120453 (2020).
-
Wang, Y. et al. Modelling and evaluating the economy-resource-ecological environment system of a third-polar city using system dynamics and ranked weights-based coupling coordination degree model. Cities 133, 104151 (2023).
-
Meng, G., Wang, K., Wang, F. & Dong, Y. Analysis of the tourism-economy-ecology coupling coordination and high-quality development path in karst Guizhou Province, China. Ecol. Indic. 154, 110858 (2023).
-
Zhu, C., Fang, C. & Zhang, L. Analysis of the coupling coordinated development of the Population–Water–Ecology–Economy system in urban agglomerations and obstacle factors discrimination: A case study of the Tianshan North Slope Urban Agglomeration, China. Sustain. Cities Soc. 90, 104359 (2023).
-
Cui, Y., Li, L., Lei, Y. & Wu, S. The performance and influencing factors of high-quality development of resource-based cities in the Yellow River basin under reducing pollution and carbon emissions constraints. Resour. Policy 88, 104488 (2024).
-
Sun, K. et al. The coupling coordination and spatiotemporal evolution of industrial water-energy-CO2 in the Yellow River Basin. Sci. Total Environ. 912, 169012 (2024).
-
Zhang, Q. et al. Dynamic responses of ecological vulnerability to land cover shifts over the Yellow river Basin, China. Ecol. Indic. 144, 109554 (2022).
-
Wang, X., Zhang, Q. & Chang, W.-Y. Does economic agglomeration affect haze pollution? Evidence from China’s Yellow River basin. Journal of Cleaner Production 335, 130271 (2022).
-
Hu, H., Tian, G., Wu, Z. & Xia, Q. Cross-regional ecological compensation under the composite index of water quality and quantity: A case study of the Yellow River Basin. Environ. Res. 238, 117152 (2023).
-
Liu, B., Pan, L., Qi, Y., Guan, X. & Li, J. Land Use and Land Cover Change in the Yellow River Basin from 1980 to 2015 and Its Impact on the Ecosystem Services. Land 10(10), 1080 (2021).
-
Feng, Y. & Zhu, A. Spatiotemporal differentiation and driving patterns of water utilization intensity in Yellow River Basin of China: Comprehensive perspective on the water quantity and quality. J. Clean. Prod. 369, 133395 (2022).
-
Zeng, P., Wei, X. & Duan, Z. Coupling and coordination analysis in urban agglomerations of China: Urbanization and ecological security perspectives. J. Clean. Prod. 365, 132730 (2022).
-
Luo, L., Wang, Y., Liu, Y., Zhang, X. & Fang, X. Where is the pathway to sustainable urban development? Coupling coordination evaluation and configuration analysis between low-carbon development and eco-environment: A case study of the Yellow River Basin, China. Ecol. Indic. 144, 109473 (2022).
-
Jiang, L., He, S. & Zhou, H. Spatio-temporal characteristics and convergence trends of PM2.5 pollution: A case study of cities of air pollution transmission channel in Beijing-Tianjin-Hebei region, China. J. Clean. Prod. 256, 120631 (2020).
-
Wang, J. et al. Geographical detectors-based health risk assessment and its application in the neural tube defects study of the Heshun Region, China. Int. J. Geogr. Inf. Sci. 24(1), 107–127 (2010).
-
Huang, S. et al. Driving mechanisms of urbanization: Evidence from geographical, climatic, social-economic and nighttime light data. Ecol. Indic. 148, 110046 (2023).
-
Niu, B., Yin, P. & Shen, P. Industrial spatio-temporal distribution of high-speed rail station area from the accommodation facilities perspective: a multi-city comparison. Land 12(2), 332 (2023).
-
Sun, Y. & Wang, N. Sustainable urban development of the π-shaped Curve Area in the Yellow River basin under ecological constraints: A study based on the improved ecological footprint model. J. Clean. Prod. 337, 130452 (2022).
-
Xiao, Y., Zhong, J.-L., Zhang, Q.-F., Xiang, X. & Huang, H. Exploring the coupling coordination and key factors between urbanization and land use efficiency in ecologically sensitive areas: A case study of the Loess Plateau, China. Sustain. Cities Soc. 86, 104148 (2022).
-
Wang, X., Zhang, S., Gao, C. & Tang, X. Coupling coordination and driving mechanisms of water resources carrying capacity under the dynamic interaction of the water-social-economic-ecological environment system. Sci. Total Environ. 920, 171011 (2024).
-
Cui, X., Fang, C., Liu, H. & Liu, X. Assessing sustainability of urbanization by a coordinated development index for an Urbanization-Resources-Environment complex system: A case study of Jing-Jin-Ji region, China. Ecol. Indic. 96, 383–391 (2019).
-
Zhang, Z., Zhu, J., Lu, N. & Yang, L. Interaction between carbon emission efficiency and ecological environment from static and dynamic perspectives. Ecol. Indic. 158, 111436 (2024).
-
Liu, Y., Zhang, Z. & Huang, X. A novel coupling cloud decision-making framework for investigating population-economy-water consumption nexus in the Inner Mongolia reaches of the Yellow River, China. Environ. Impact Assess. Rev. 98, 106923 (2023).
-
Chen, H. et al. Key indicators of high-quality urbanization affecting eco-environmental quality in emerging urban agglomerations: Accounting for the importance variation and spatiotemporal heterogeneity. J. Clean. Prod. 376, 134087 (2022).
-
Yang, J., Li, Z., Zhang, D. & Zhong, J. An empirical analysis of the coupling and coordinated development of new urbanization and ecological welfare performance in China’s Chengdu-Chongqing economic circle. Sci. Rep. 14(1), 13197 (2024).
-
Chang, Q., Sha, Y. & Chen, Y. The coupling coordination and influencing factors of urbanization and ecological resilience in the Yangtze River Delta urban agglomeration, China. Land 13(1), 111 (2024).
-
Wang, K.-L., Xu, R.-Y., Zhang, F.-Q., Miao, Z. & Peng, G. Spatiotemporal heterogeneity and driving factors of PM2.5 reduction efficiency: An empirical analysis of three urban agglomerations in the Yangtze River Economic Belt, China. Ecol. Indic. 132, 108308 (2021).
-
Feng, Y., Zhu, A., Liu, P. & Liu, Z. Coupling and coordinated relationship of water utilization, industrial development and ecological welfare in the Yellow River Basin, China. J. Clean. Prod. 379, 134824 (2022).
-
Fang, C. et al. Modeling regional sustainable development scenarios using the urbanization and eco-environment coupler: case study of Beijing-Tianjin-Hebei urban agglomeration, China. Sci. Total Environ. 689, 820–830 (2019).
-
Zhu, W. et al. Spatial distribution and aggregation of human-environment coordination and optimal paths in the Yellow River Delta, China. Ecol. Indic. 143, 109380 (2022).
-
Xu, X. et al. Ecological engineering induced carbon sinks shifting from decreasing to increasing during 1981–2019 in China. Sci. Total Environ. 864, 161037 (2023).
-
Jiang, L., Zuo, Q., Ma, J. & Zhang, Z. Evaluation and prediction of the level of high-quality development: A case study of the Yellow River Basin, China. Ecol. Indic. 129, 107994 (2021).
-
Zhang, X. et al. Spatiotemporal evolution of ecological vulnerability in the Yellow River Basin under ecological restoration initiatives. Ecol. Indic. 135, 108586 (2022).
-
Hu, H., Tian, G., Wu, Z. & Xia, Q. A study of ecological compensation from the perspective of land use/cover change in the middle and lower Yellow River, China. Ecol. Indic. 143, 109382 (2022).
-
Ramanathan, R., He, Q., Black, A., Ghobadian, A. & Gallear, D. Environmental regulations, innovation and firm performance: A revisit of the Porter hypothesis. J. Clean. Prod. 155, 79–92 (2017).
Acknowledgments
The research was supported by the Humanities and Social Sciences Youth Foundation, Ministry of Education of China (24YJCZH352), Natural Science Foundation of Sichuan Province (2024NSFSC0859), State Key Laboratory of Geohazard Prevention and Geoenvironment Protection Open Fund (SKLGP2023K028), Chengdu Philosophy and Social Science Planning Project (2024BS039), Philosophy and Social Science Foundation project of Chengdu University of Technology (YJ2024-QN013).
Author information
Authors and Affiliations
Contributions
X.X., X.Y., and H.H. wrote the manuscript text, and C.Y. prepared partial figures. All authors reviewed the manuscript.
Corresponding authors
Ethics declarations
Competing interests
The authors declare no competing interests.
Additional information
Publisher’s note
Springer Nature remains neutral with regard to jurisdictional claims in published maps and institutional affiliations.
Rights and permissions
Open Access This article is licensed under a Creative Commons Attribution-NonCommercial-NoDerivatives 4.0 International License, which permits any non-commercial use, sharing, distribution and reproduction in any medium or format, as long as you give appropriate credit to the original author(s) and the source, provide a link to the Creative Commons licence, and indicate if you modified the licensed material. You do not have permission under this licence to share adapted material derived from this article or parts of it. The images or other third party material in this article are included in the article’s Creative Commons licence, unless indicated otherwise in a credit line to the material. If material is not included in the article’s Creative Commons licence and your intended use is not permitted by statutory regulation or exceeds the permitted use, you will need to obtain permission directly from the copyright holder. To view a copy of this licence, visit http://creativecommons.org/licenses/by-nc-nd/4.0/.
About this article
Cite this article
Xiang, X., Xiao, Y., Chen, Y. et al. Assessment of coupling coordinated degree and driving mechanism of population-resource-environment-economy (PREE) system in Yellow River Basin, China.
Sci Rep 14, 31135 (2024). https://doi.org/10.1038/s41598-024-82419-2
-
Received: 12 September 2024
-
Accepted: 05 December 2024
-
Published: 28 December 2024
-
DOI: https://doi.org/10.1038/s41598-024-82419-2
Keywords
Search
RECENT PRESS RELEASES
Related Post
