Bitcoin Bull Market Starts With a 4.5% Move? History and Charts Finally Align
January 11, 2026
Bitcoin price is sitting at a decision point after a quiet pullback. Since peaking on January 5, BTC has slipped but avoided any major breakdown. Year-over-year, Bitcoin remains down approximately 4.5%, maintaining a slightly negative annual performance.
That small red number matters more than it looks. A narrow price window now separates Bitcoin from a rare historical signal that last appeared in 2020. Whether Bitcoin flips or fails may decide the next trend.
SponsoredSponsored
A recent historical analysis highlighted a rare setup. When Bitcoin’s 1-year price change turns negative and then flips back positive, it has often marked major trend shifts. This rare move surfaced in July 2020, which was followed by a strong bull phase.
Right now, Bitcoin is hovering just below that flip point. A move of roughly 4.5% would turn the yearly change green and repeat that historical condition.
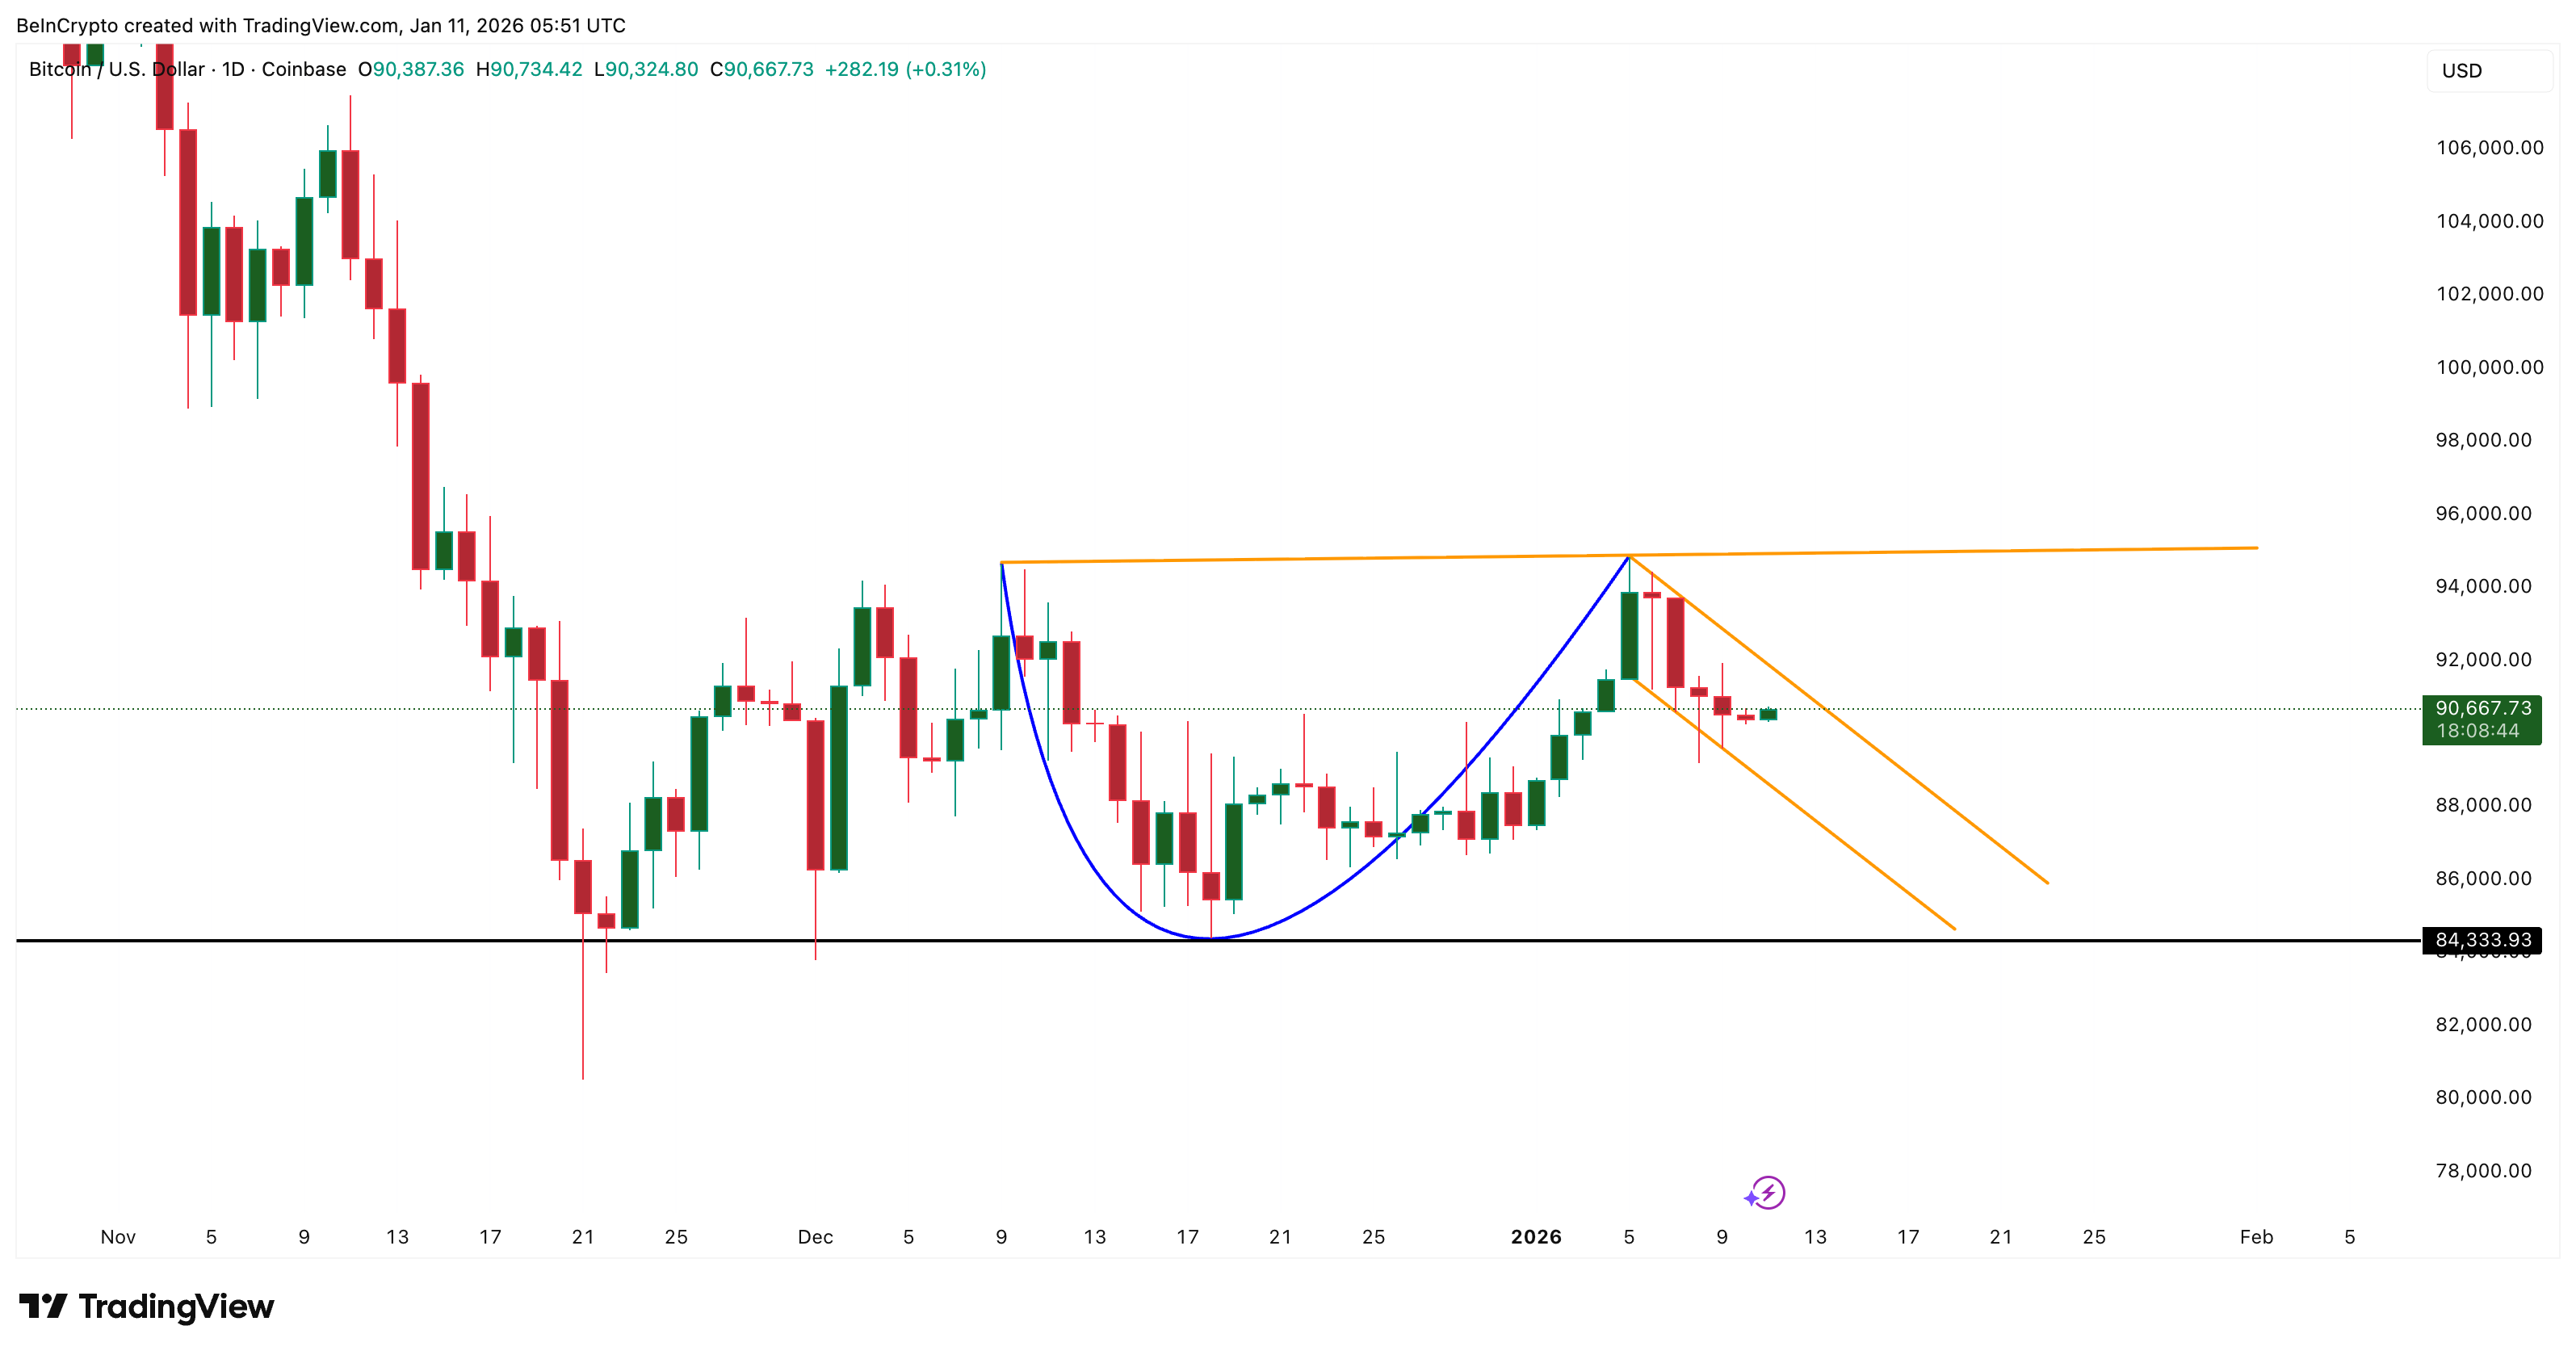
The chart structure supports why this matters. Bitcoin is trading inside the handle of a cup and handle pattern, a bullish formation where price pauses after a rounded recovery before attempting a breakout.
Want more token insights like this? Sign up for Editor Harsh Notariya’s Daily Crypto Newsletter here.
It would be interesting to see if the measured breakout distance of this pattern (above the neckline) closely aligns with that same 4–5% zone?
SponsoredSponsored
Short-term trend behavior is reinforcing the bullish case.
An exponential moving average (EMA) gives more weight to recent prices and helps track short-term trend direction. Bitcoin has recently reclaimed its 20-day EMA and is holding above it. The last time BTC reclaimed this level in early January, the price rallied nearly 7% within days.
Losing the 20-day EMA in mid-December led to a 6.6% drop, showing how reactive the price has been around this level. For now, holding above it keeps upside momentum intact.
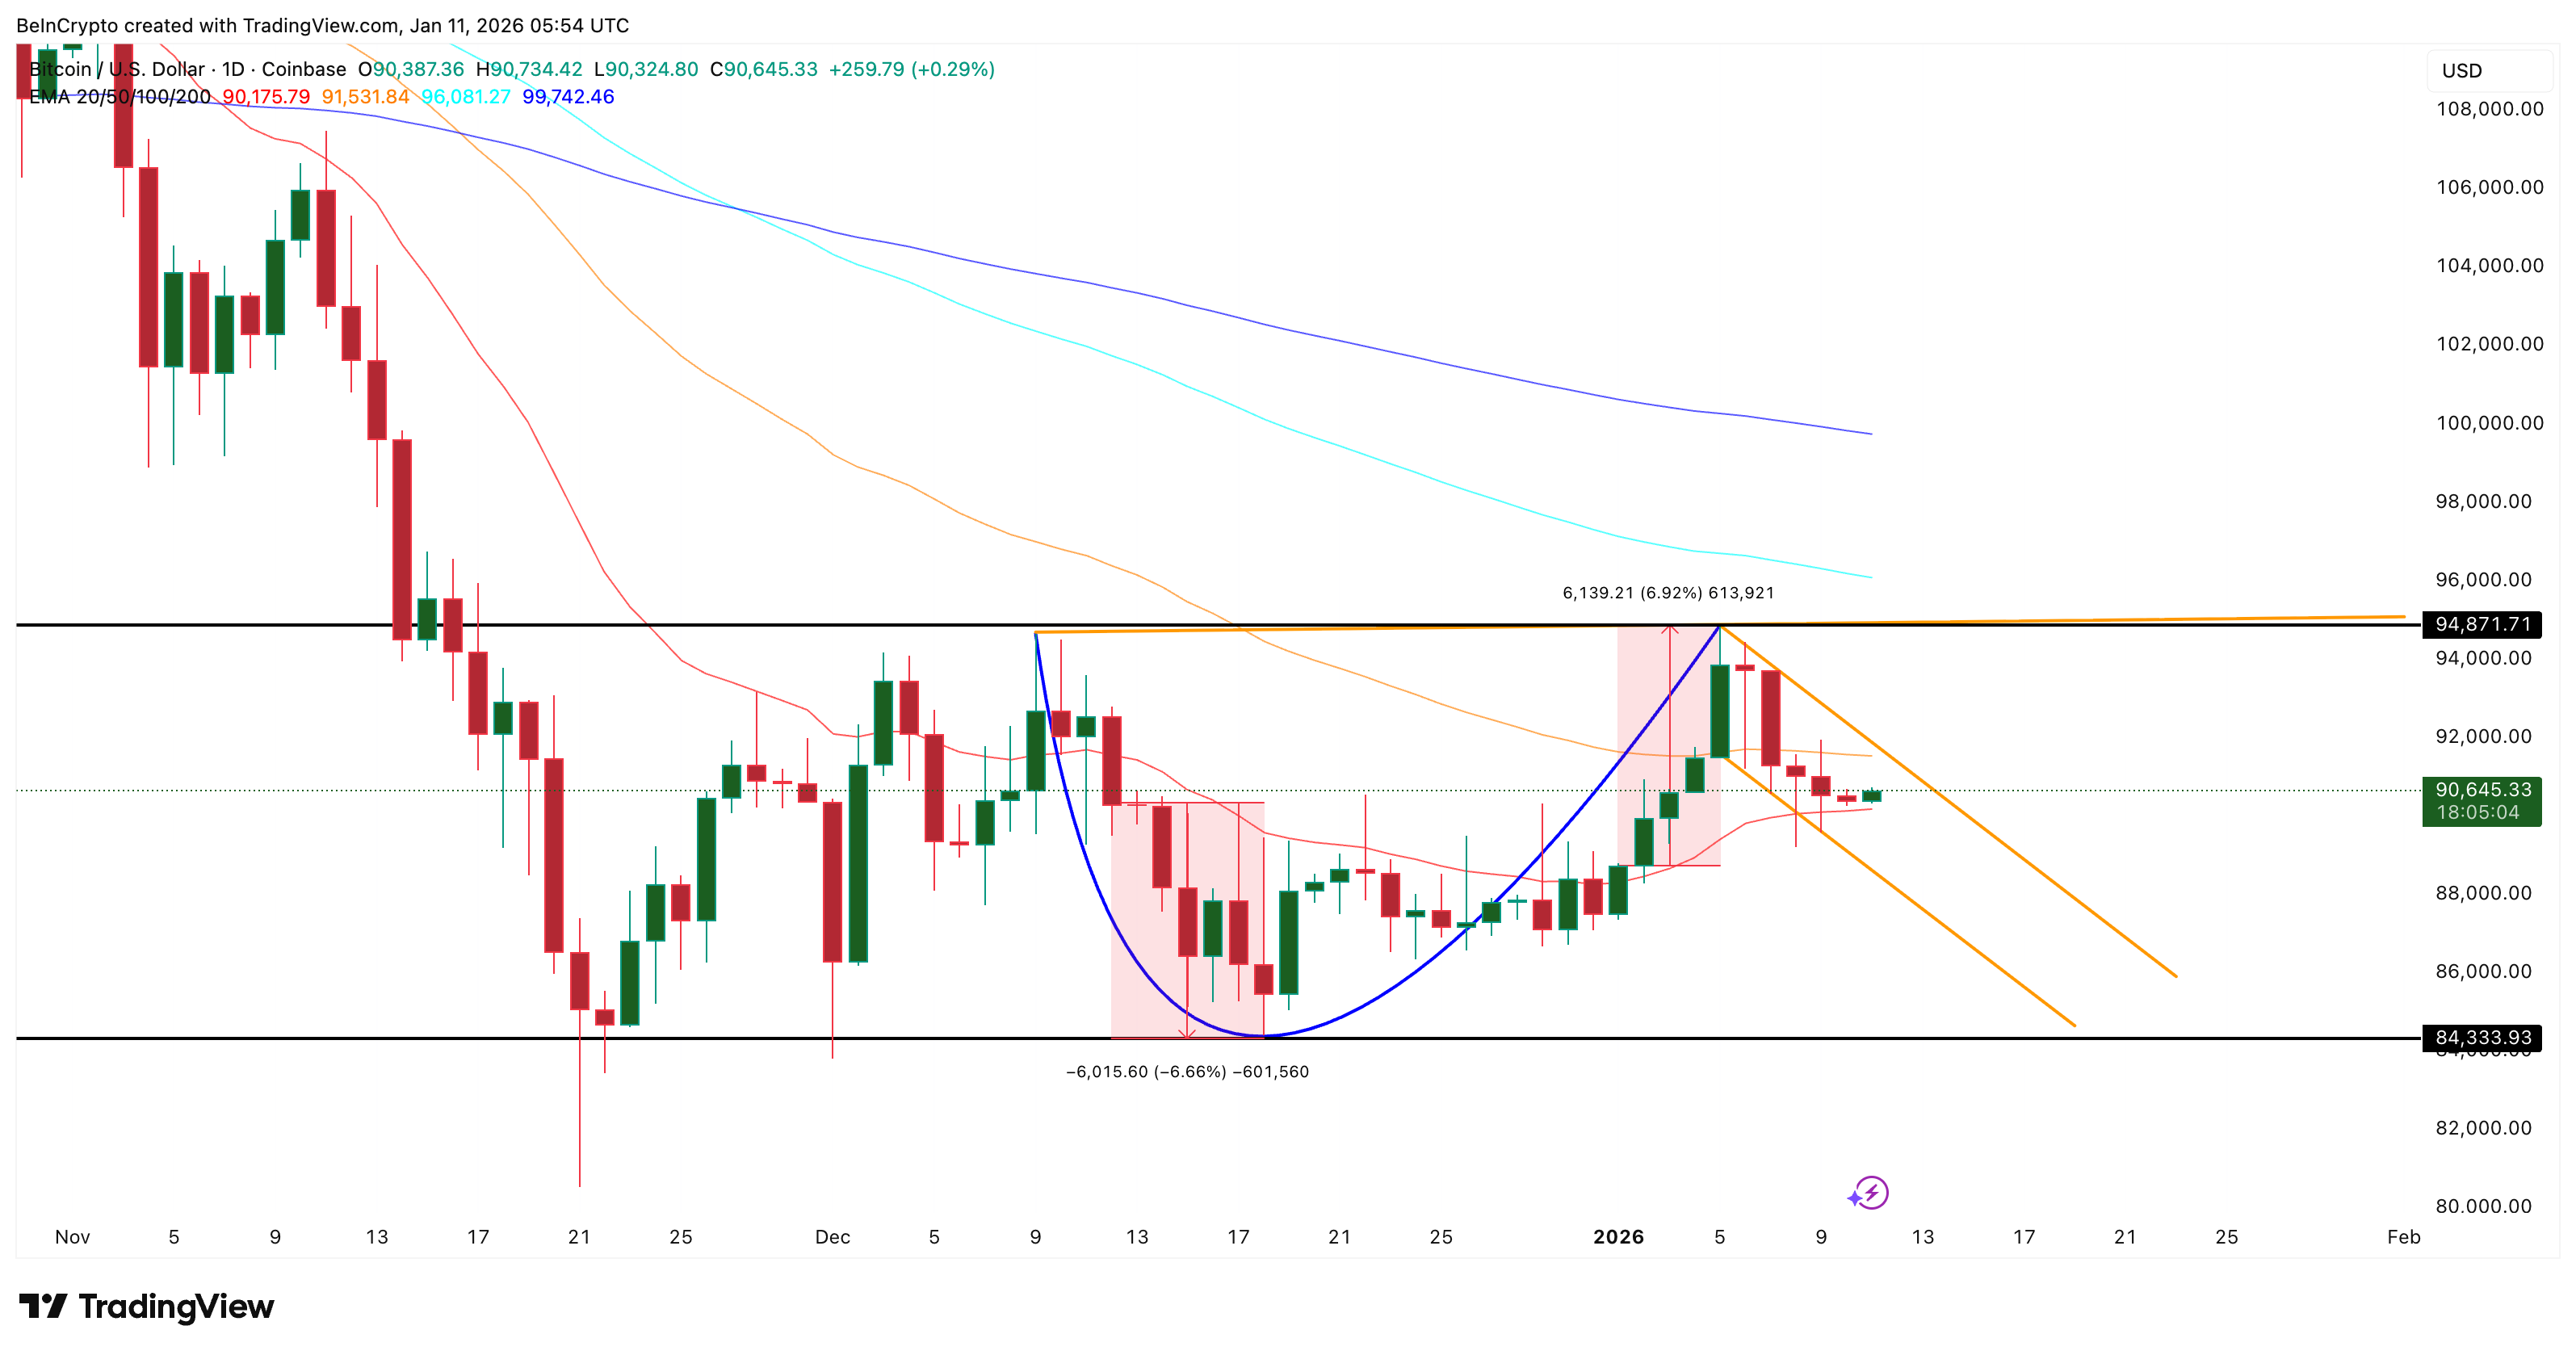
The next hurdle is the 50-day EMA. Bitcoin lost this level on January 12 and corrected shortly after. A clean reclaim would signal a stronger trend recovery and align with the cup and handle breakout structure.
On-chain data adds weight. Exchange inflow, which tracks coins moving to exchanges and often signals selling intent, has collapsed to a six-month low. Daily inflows have dropped from roughly 78,600 BTC on November 21 to about 3,700 BTC now, a decline of more than 95%.
SponsoredSponsored
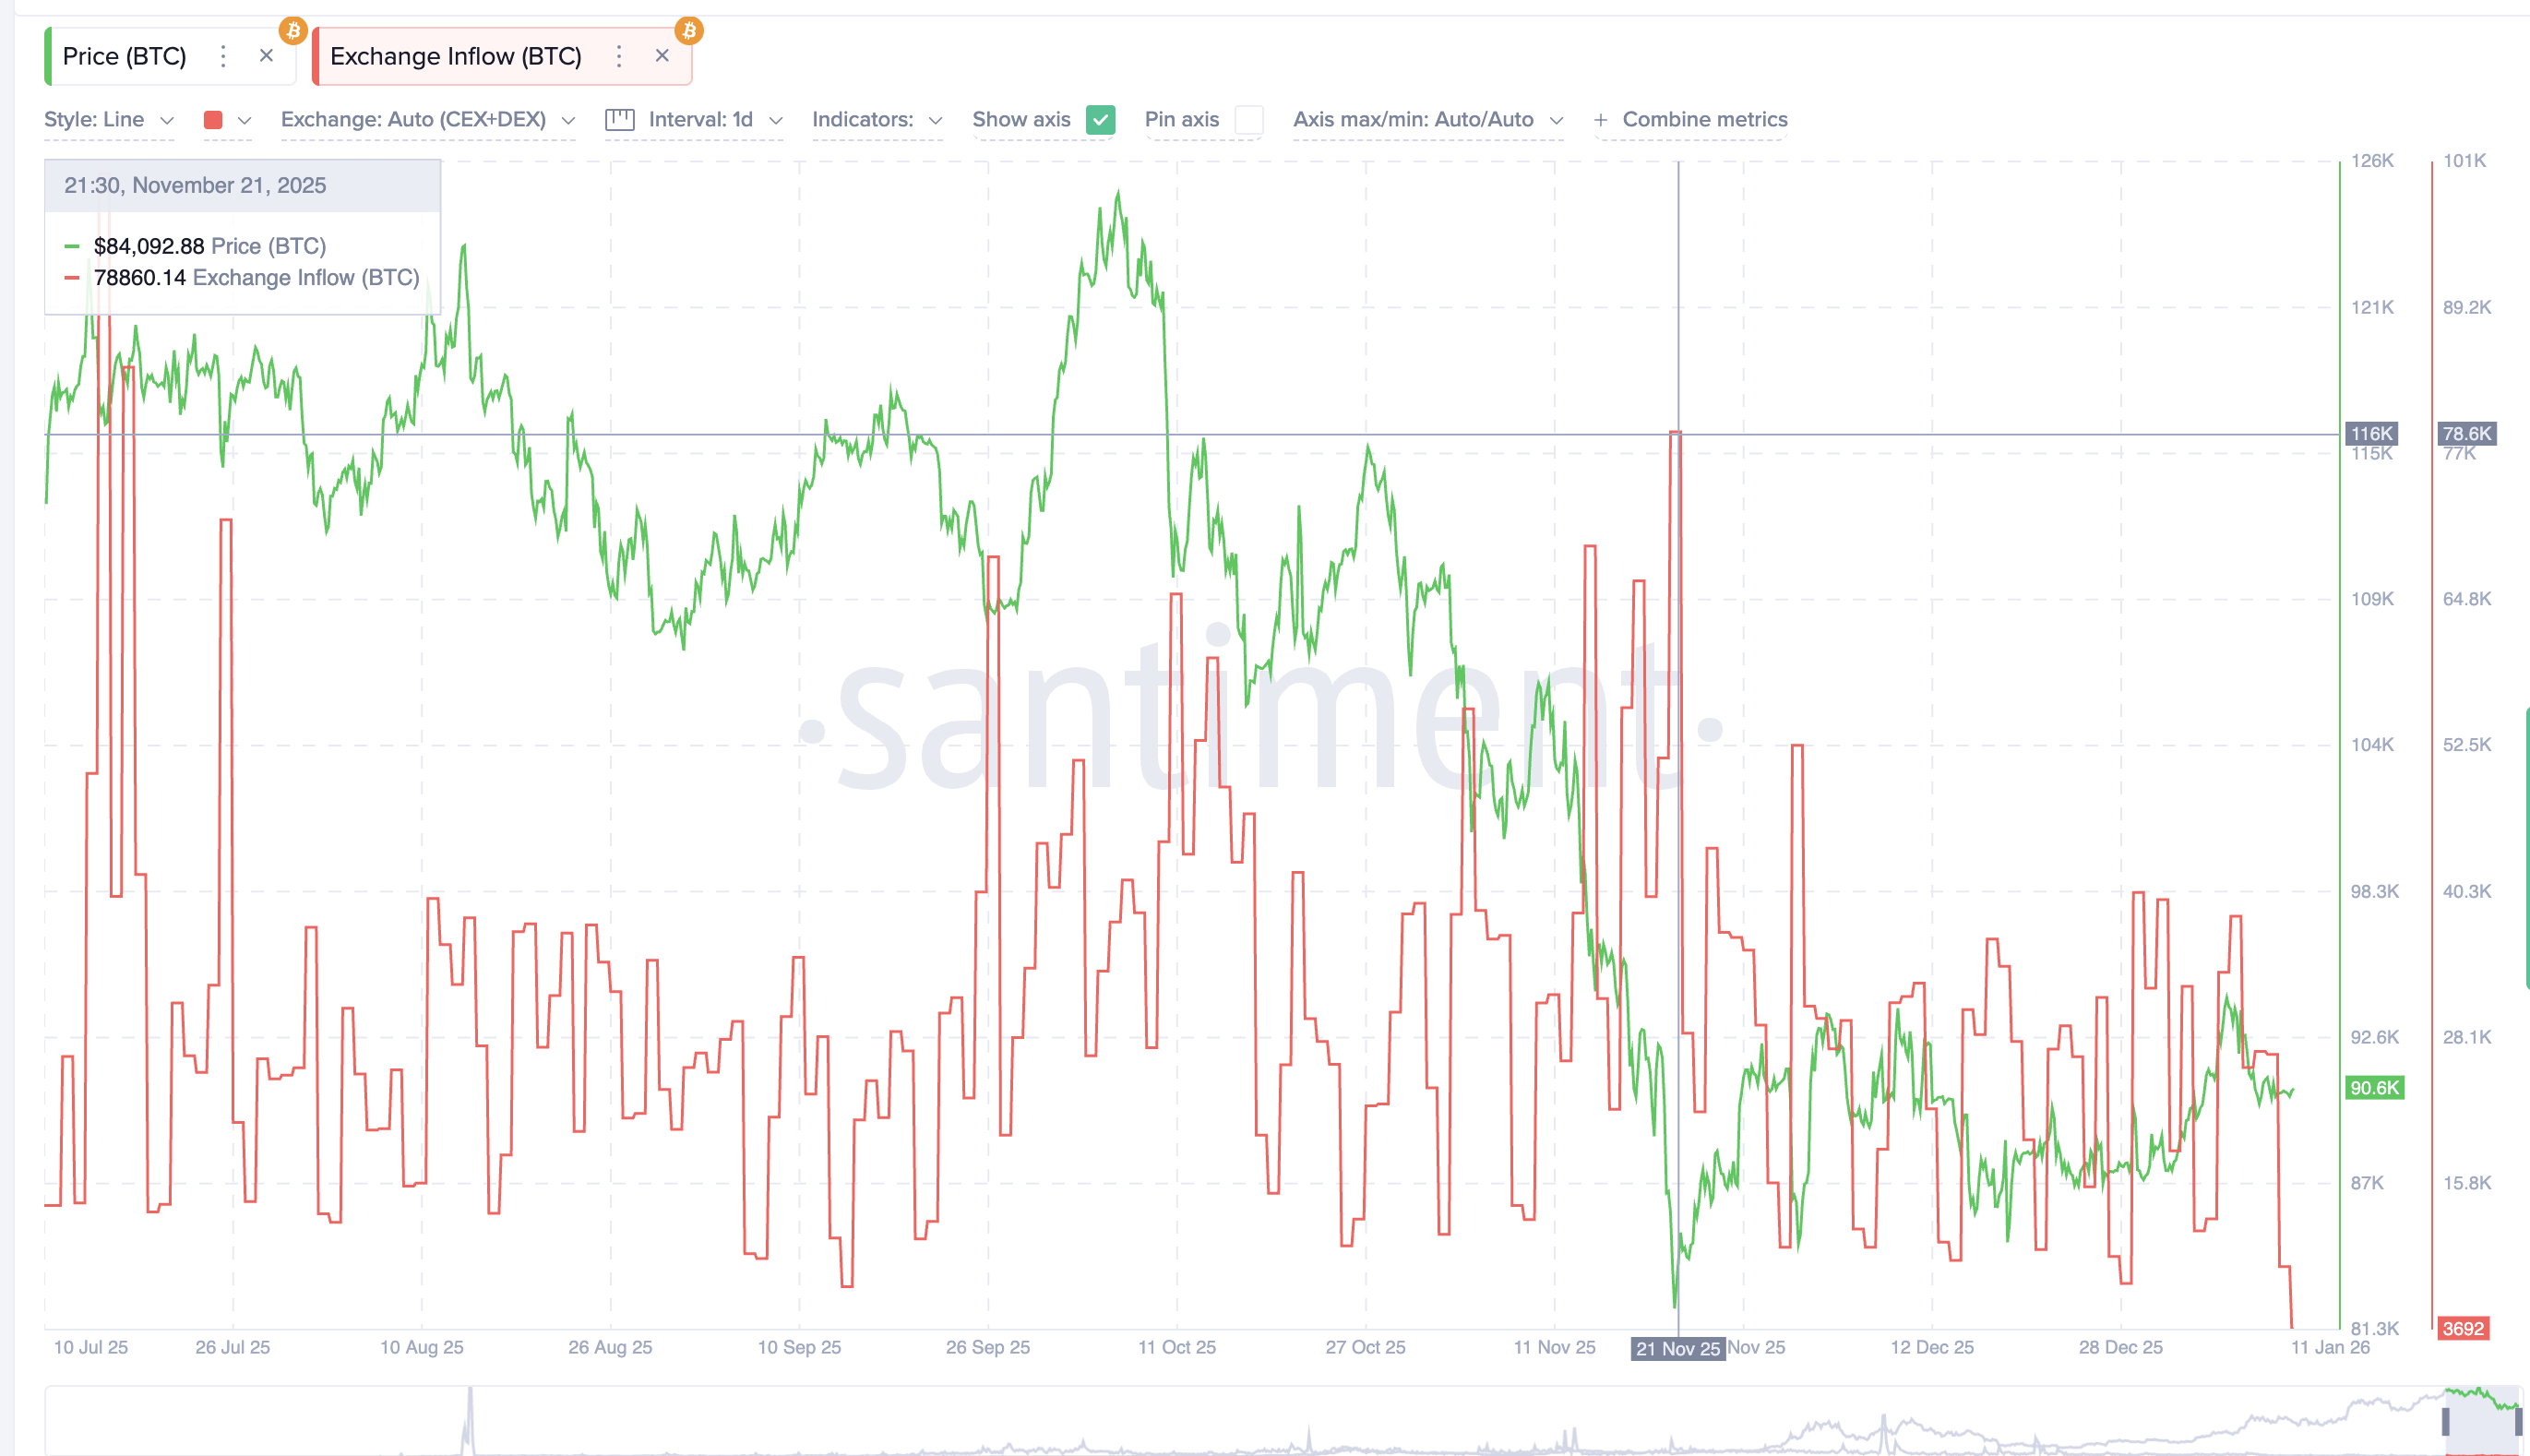
This sharp fall suggests selling pressure has dried up. Fewer coins are being sent to exchanges, reducing the supply available to sell into rallies.
Leverage positioning adds another layer.
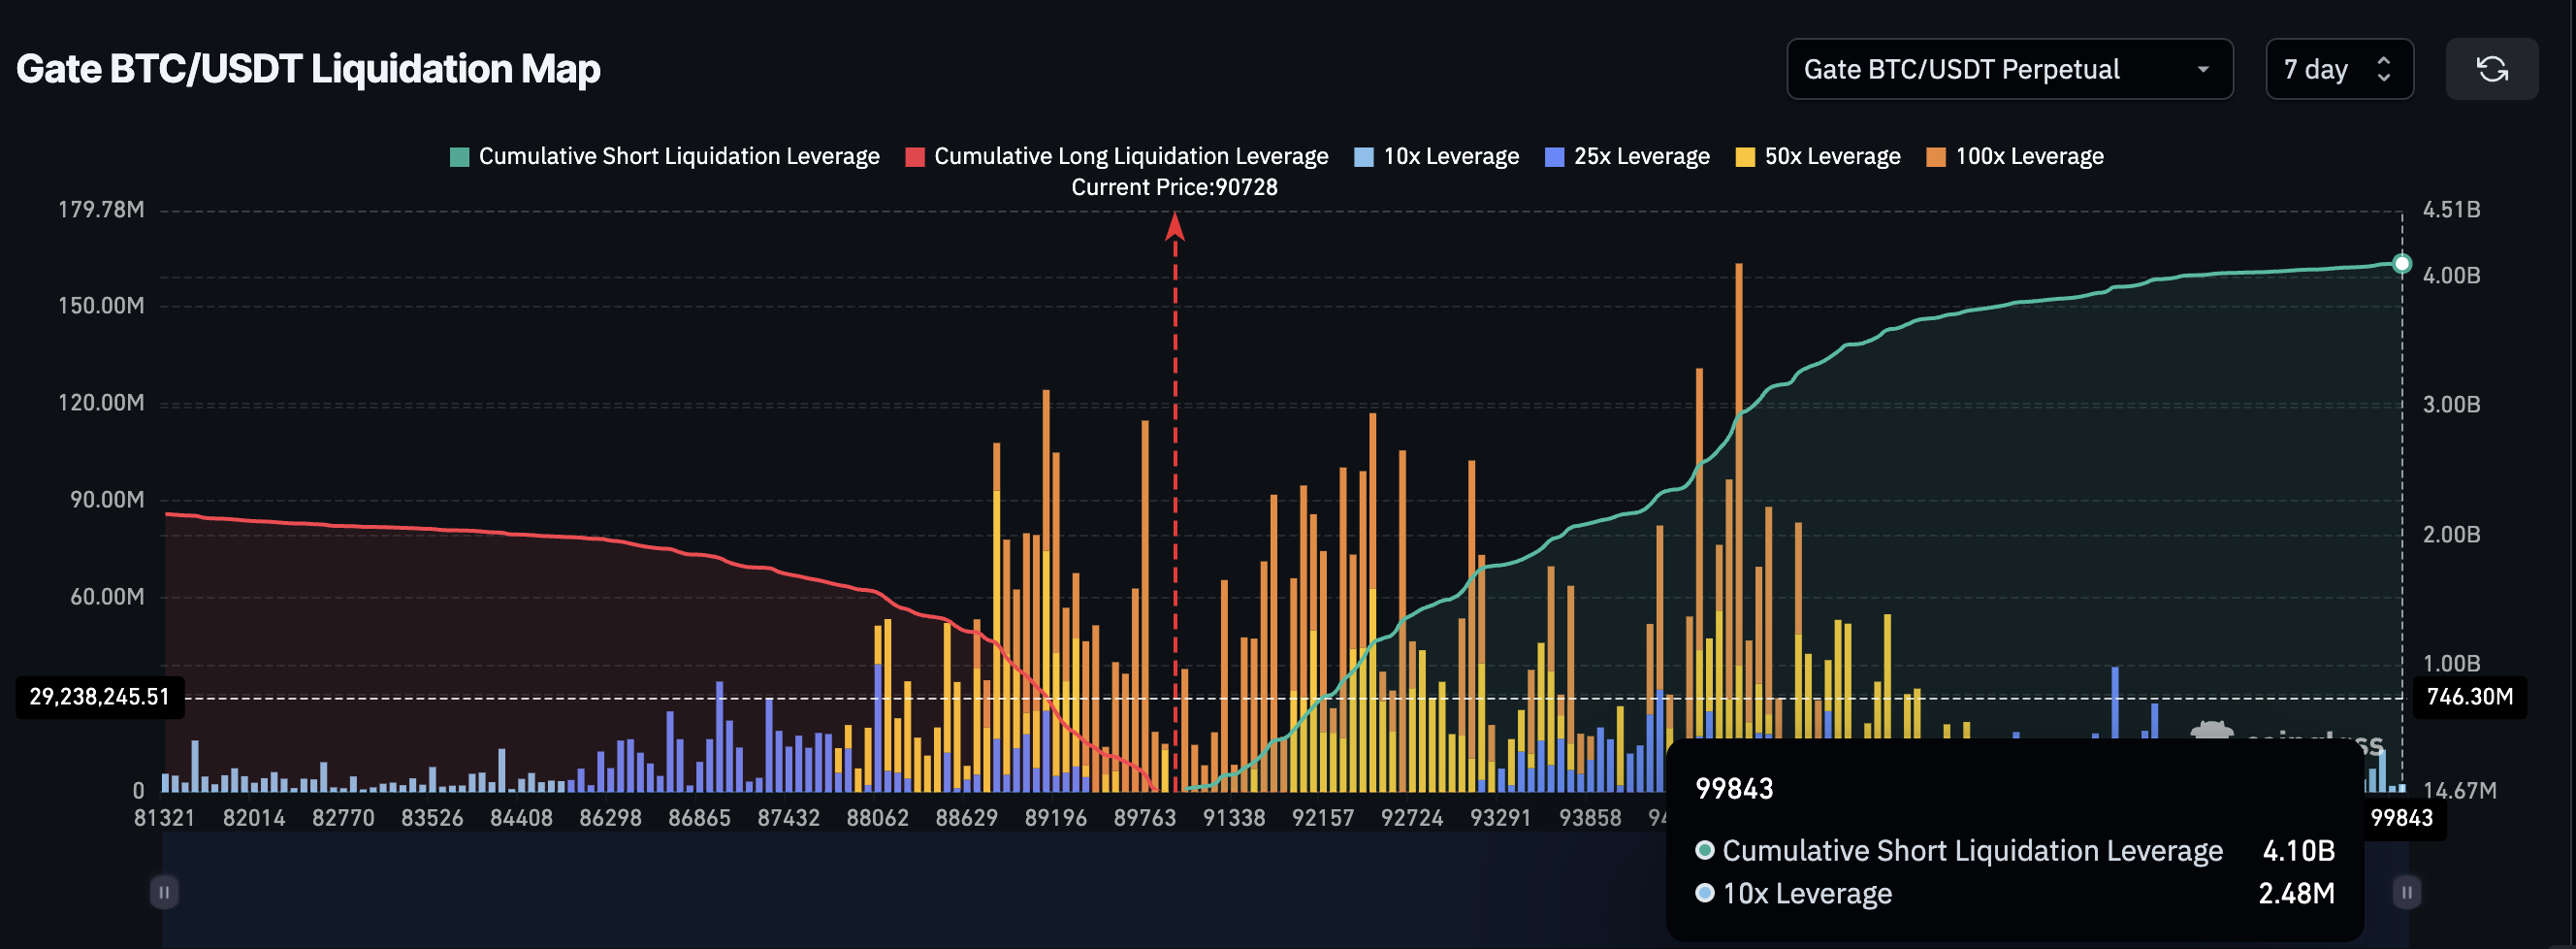
Over the next seven days, cumulative short liquidation leverage sits near $4.10 billion, while long liquidation exposure is around $2.17 billion. That puts short exposure roughly 89% higher than longs.
SponsoredSponsored
Crowded short positioning creates fuel. If the BTC price starts moving higher, forced short covering can add automatic buying pressure. Bitcoin has repeatedly moved against leverage bias over the past year, making this imbalance notable rather than bearish.
All of this converges at clear price levels.
A daily close above $94,880 would complete the cup and handle breakout and align with the 4.5% yearly flip. From there, upside targets sit near $99,810, followed by $106,340 based on Fibonacci extensions and the cup’s breakout projection.
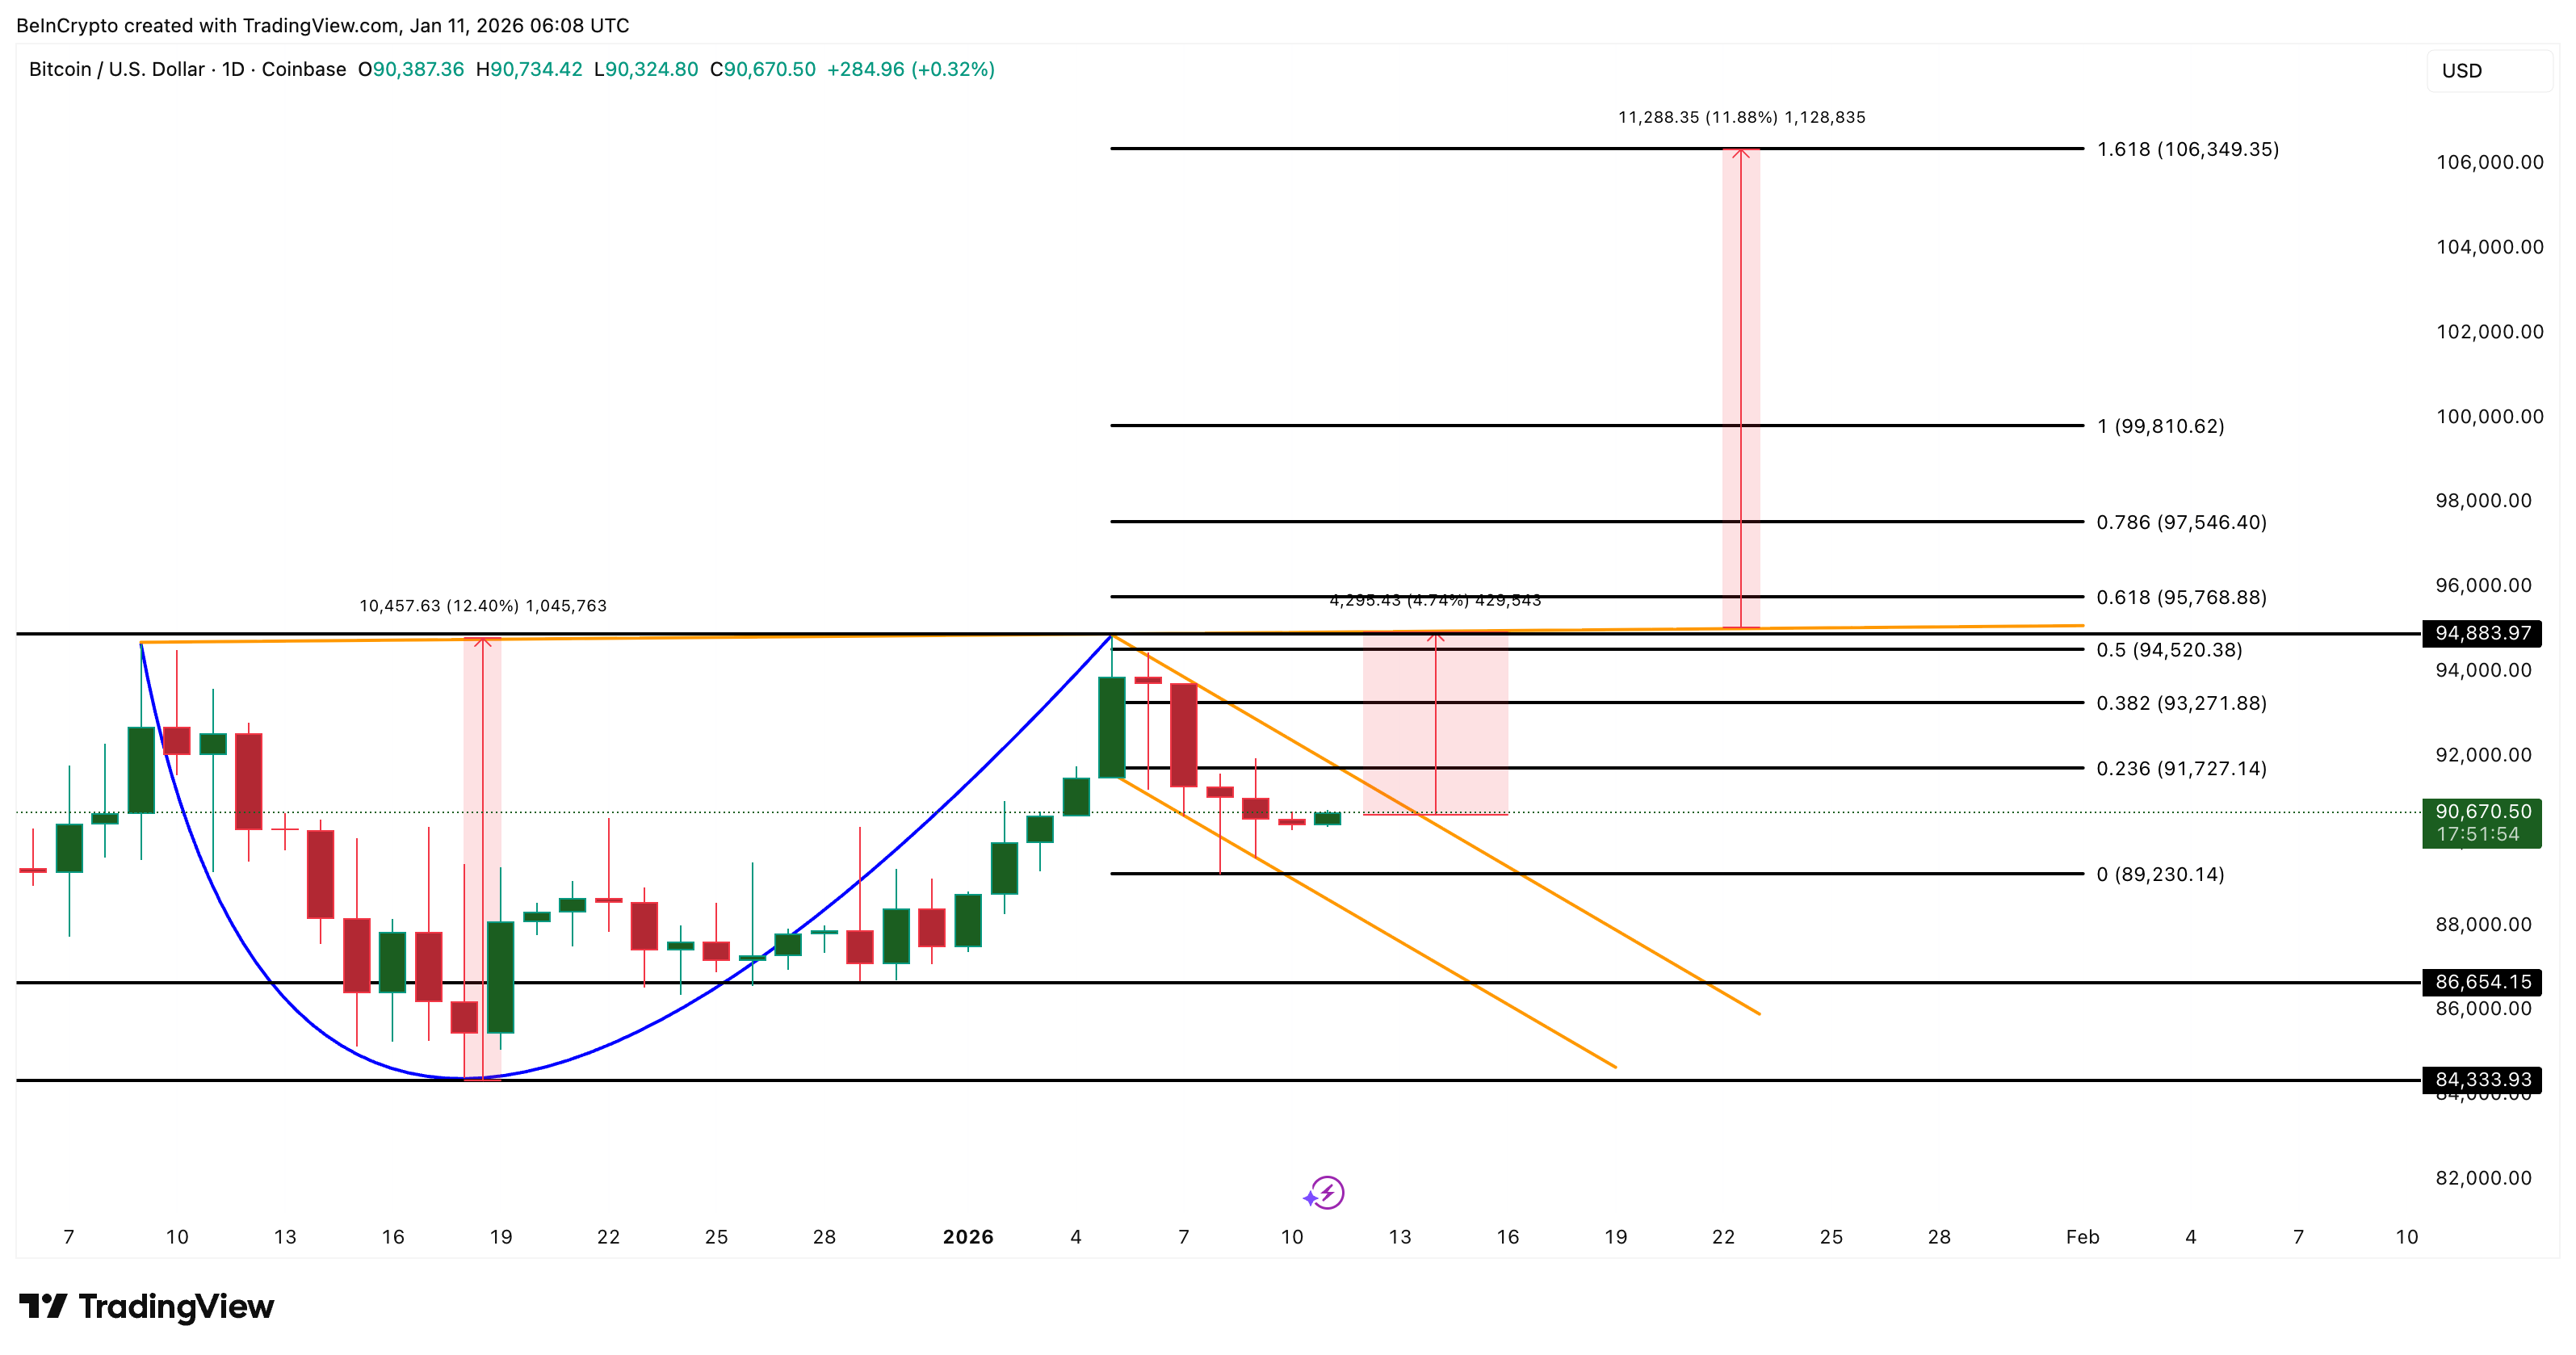
On the downside, $89,230 is the first key support. A loss of that level would expose $86,650 and invalidate the bullish structure.
For now, the Bitcoin price sits in a narrow corridor.
Selling pressure is at a six-month low, short-term trend support is holding, and a rare historical signal is just 4.5% away. Whether Bitcoin reaches it may define what comes next.
Search
RECENT PRESS RELEASES
Related Post


