Bitcoin Price Today: BTC Price Holds $96K Support While Bulls Wait for a Break Above $103K
November 15, 2025
Bitcoin (BTC) is holding near the $96,000 level today, slipping only slightly despite renewed focus on the unfilled CME gap around $92K.
With trading volume remaining strong and BTC’s market cap firmly above $1.8 trillion, analysts say the market structure still favors a potential rebound toward the $101K–$103K zone. High-timeframe demand, cooling bearish momentum, and improving liquidity conditions continue to support the outlook, even as traders debate whether the CME gap will act as a short-term magnet.
CME Gap at $92K Continues to Influence Price Expectations
A key talking point among traders remains the open CME futures gap near $92,000, an area that historically attracts price due to futures-spot dislocations. Independent analysts tracking futures behavior note that the gap continues to shape short-term sentiment.
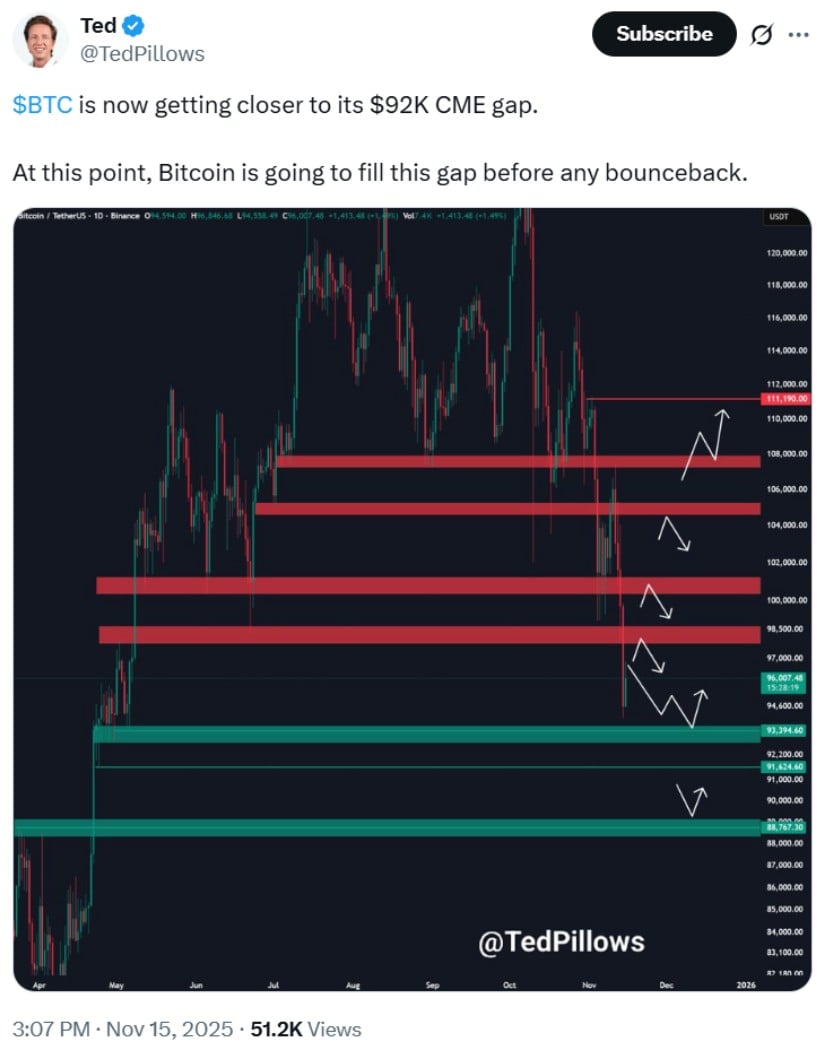
Bitcoin approaches the $92K CME gap, likely filling it before any rebound. Source: @TedPillows via X
One such analyst, Ted (@TedPillows), who frequently comments on Bitcoin futures structure, observed, “$BTC is now getting closer to its $92K CME gap. At this point, Bitcoin is going to fill this gap before any bounceback.”
Charts shared across the trading community show Bitcoin facing resistance between $99K and $111K before pulling back into the mid-$90K zone. While some traders view this as the beginning of a deeper correction, others frame it as a standard retracement within an ongoing macro uptrend.
Overall sentiment remains split:
-
Bearish participants expect a deeper probe into $92K or even the $88K–$90K range.
-
Long-term holders and technical analysts highlight similarities to earlier consolidation periods that preceded trend continuation.
Key Support Zone at $88K–$90K Gains Attention
In a separate market update, analysts monitoring weekly structure pointed to the $88,000–$90,000 region as an important technical area due to its alignment with long-standing trendline support originating in mid-2024. As Ted noted in his second commentary, “BTC is approaching a crucial support zone. I think the $88,000–$90,000 level will be the local bottom for Bitcoin.”
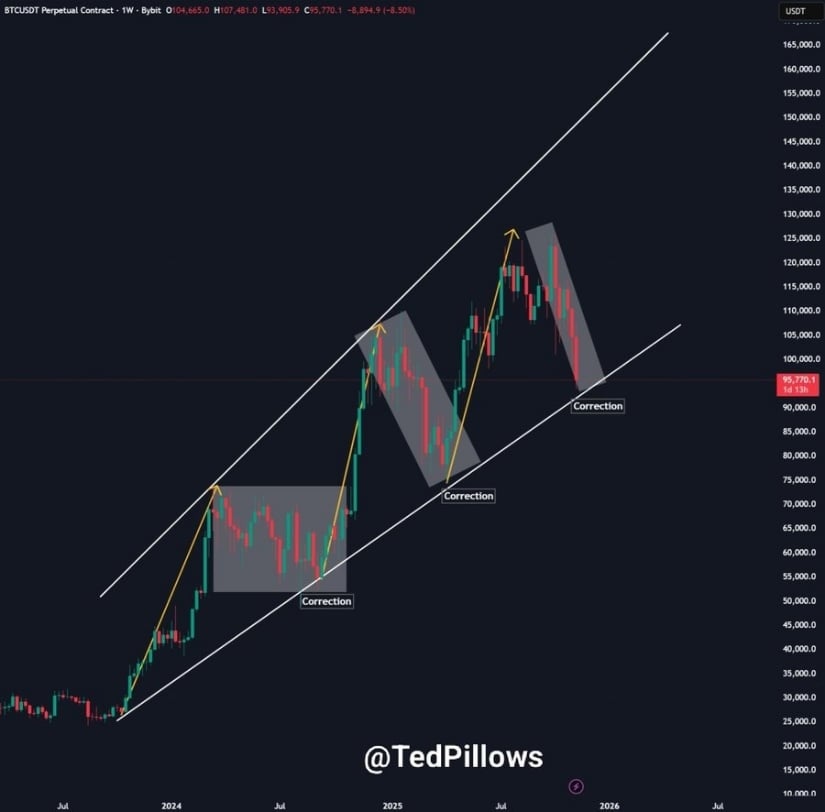
Bitcoin nears key support at $88K–$90K, with a potential drop to April 2025 lows if the zone fails. Source: @TedPillows via X
Historical price data shows that Bitcoin has repeatedly rebounded from this trendline, creating higher highs over the past year. While a decisive break below the zone would weaken the bullish macro structure, the trendline remains intact for now.
Institutional data also provides context. According to daily disclosures from Bitcoin ETF issuers—including BlackRock, Fidelity, and Grayscale—demand has remained relatively consistent despite recent volatility. Although inflows vary week-to-week, analysts note that regulated ETF channels continue to support long-term market participation.
Daily Structure Shows Signs of Bullish Repricing
Beyond price levels, several high-timeframe indicators suggest early signs of stabilization. Analysts tracking liquidity patterns and momentum tools highlight:
-
A sell-side liquidity sweep of the June–July lows
-
A direct test of a Daily Fair Value Gap (FVG) aligned with a demand zone
-
High-volume rejection wicks, indicating that buyers stepped in
-
The Alligator indicator is showing slowing bearish momentum
These signals are often interpreted as part of a potential shift from corrective behavior to re-accumulation. Still, they are contingent on continued demand and broader market liquidity conditions.
1H Timeframe: Setup Favors Short-Term Long Plays
On the lower timeframes, Bitcoin is showing early signs of structural support after tapping into a key daily demand zone. The 1H chart has already formed an accumulation pattern, sweeping short-term liquidity and triggering bullish displacement—signals that often indicate the beginning of a short-term reversal phase.
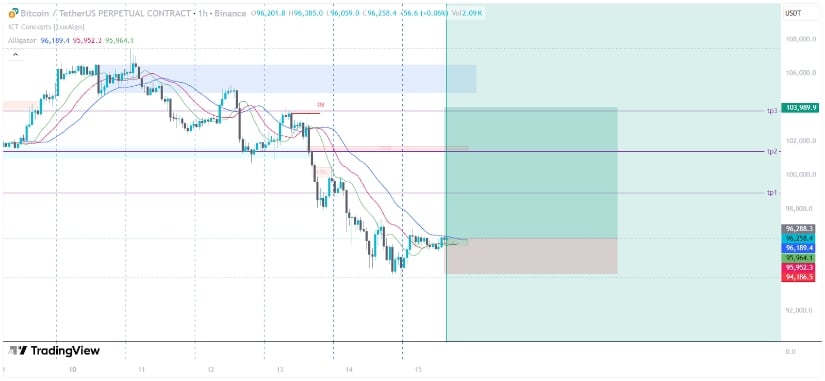
Bitcoin tests daily demand zones with bullish momentum building, eyeing a potential move toward $101K–$104K. Source: origami_capital33 on TradingView
Analysts origami_capital33 who track liquidity-based models note that this structure aligns with a potential continuation setup, with technically derived levels suggesting a constructive path upward. The expected entry region sits between $96,200 and $96,400, with structural invalidation below $94,180, while inefficiency targets remain open at $101,013, $102,934, and $103,989. These targets reflect areas where price previously moved with low resistance, making them natural magnets if bullish momentum continues to build.
Market Outlook
Bitcoin’s next move will likely depend on how the price behaves around the mid-$90K range and whether liquidity conditions favor a relief bounce or a deeper retest of lower inefficiencies. Sentiment remains mixed as traders balance the threat of a gap-fill scenario with technical stabilization on higher timeframes.
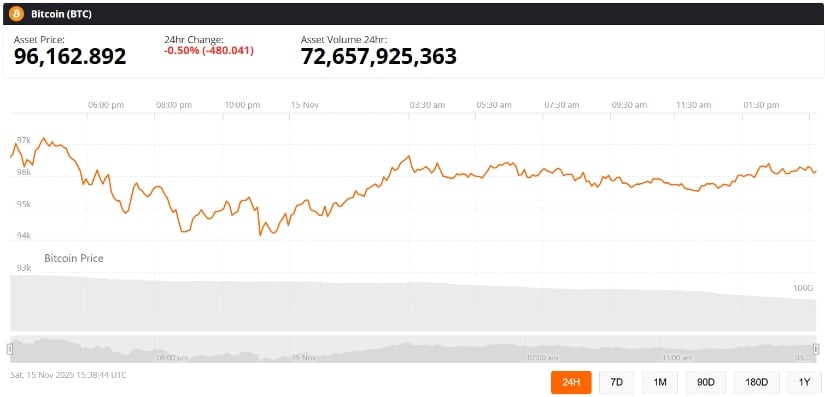
Bitcoin was trading at around 96,162, down 0.50% in the last 24 hours at press time. Source: Bitcoin price via Brave New Coin
Despite the uncertainty, the interplay of demand zones, improving microstructure, ETF-supported institutional participation, and moderation in downside momentum supports the broader argument that Bitcoin’s macro trend remains constructive unless major support levels fail.
For now, market participants are watching whether Bitcoin can hold above $96K and attempt a move toward $101K–$103K, even as the $92K CME gap continues to attract attention as a potential downside magnet.
Search
RECENT PRESS RELEASES
Related Post


