Bitcoin’s Countdown to $1 Million: Could It Happen as Early as 2028?
October 9, 2025
Author: TechFlow
The one-day Binance frenzy has come to an end.
After the excitement faded, a small number of people achieved significant results, while the majority were left with regret and introspection.
 Compared to the short-term regret of missing out on this viral Meme trend, the inability to hold BTC long-term and secure steady returns represents another form of ‘cyclical’ regret that recurs periodically.
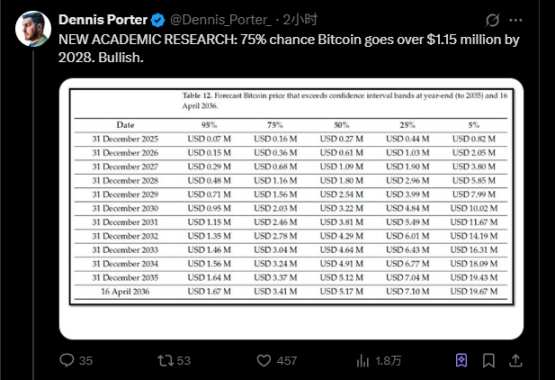
For instance, during the National Day holiday, the following predictive chart frequently appeared in social media discussions. Even if one had purchased BTC three years ago and held onto it, they would still have enjoyed substantial gains by now.

Prudent investors may still be wondering: as a bellwether for the cryptocurrency market, how much higher can BTC go?
Previously, MicroStrategy predicted that Bitcoin would reach $2.4 million by 2036, while ARK Invest made an even bolder forecast of $3.8 million by 2030. These figures have consistently been criticized as overly optimistic or self-serving.
However, a relatively more neutral and rigorous academic study has recently provided theoretical support for these forecasts.
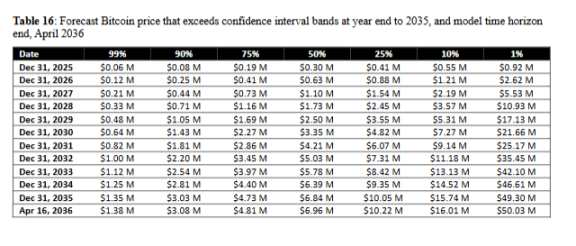
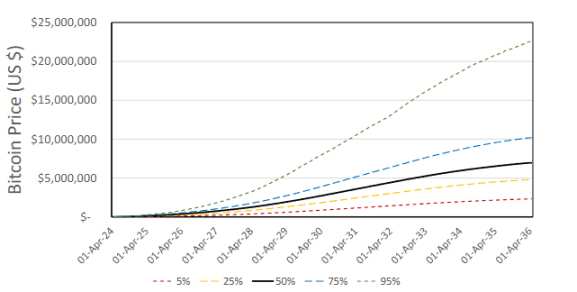
The latest research paper from Satoshi Action Education (a non-profit research organization) shows that based purely on supply and demand analysis, there is a 75% probability that Bitcoin will exceed $4.81 million by 2036. This is 25% higher than the most aggressive predictions made by institutions.
Meanwhile, the study also forecasts a 50% probability that BTC will exceed USD 3.35 million by 2030, which is not far from ARK’s prediction of USD 3.8 million.
Although theoretical research does not necessarily reflect actual trends, understanding different analytical approaches, rather than blindly following market hype, can also aid in asset allocation decision-making.
USD 1 million may arrive as early as 2028.
First, let us outline several key conclusions of the study.
Bitcoin has a 75% probability of surpassing USD 4.81 million by April 2036, with a median forecast of approximately USD 6 million, corresponding to a market capitalization of about USD 125 trillion. This is roughly 6 to 8 times the current global gold market value.
More importantly, the timeline.
The study predicts that Bitcoin will most likely surpass USD 1 million between the end of 2027 and the end of 2028. Specifically, under a 50% probability (median) scenario, Bitcoin will have already reached USD 1.1 million by the end of 2027.
Under a 75% probability range, this milestone will occur within 2028. This aligns closely with ARK Invest’s forecast of USD 3.8 million by 2030.
Unlike institutional forecasts, this study focuses more on the changes in Bitcoin’s supply and demand, which is the first principle in the economic sense. More specifically:
It does not consider Bitcoin’s historical price trends, nor does it presuppose that it will replace the market share of gold or other assets,
but rather is based solely on the fixed supply cap of 21 million coins (supply), combined with currently observable purchasing behavior (demand), such as ETF inflows, corporate purchases, miner hoarding, and other data, to calculate how the supply-demand equilibrium evolves over time.
The greatest advantage of this method is that all key variables can be continuously tracked and verified.
Daily net inflows of ETFs are publicly available through financial terminals like Bloomberg, exchange balances can be queried in real-time via on-chain data, and statistics on the proportion of long-term holders are provided by analytical platforms such as Glassnode and CryptoQuant.
Notably, the conclusions drawn from this supply-demand model align with the order of magnitude predicted by institutions using entirely different methodologies.
MicroStrategy’s Bitcoin24 model assumes a yearly decrease in Bitcoin’s price growth rate, and its baseline scenario also predicts that BTC will reach $2.4 million by 2036.
Institutions are sweeping up supplies at ten times the rate of availability.
Contrasting with the contraction in supply is robust purchasing demand. The study tallied the average daily purchase volume across various types of buyers:
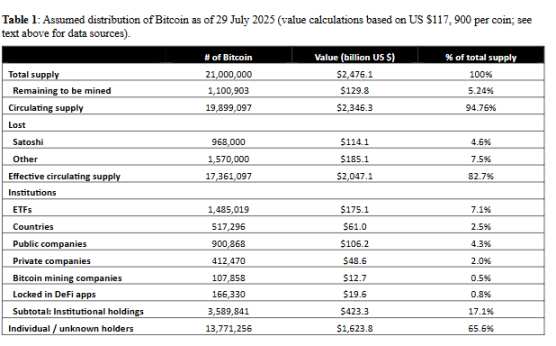
The average daily net inflow of U.S. spot Bitcoin ETFs was approximately 2,900 BTC as of July 2025. As of July 29, the 11 ETFs collectively held around 1.485 million BTC, accounting for 7.1% of the total supply. Among them, Blackrock’s IBIT holdings have exceeded 730,000 BTC.
On the public company front, as of July 28, the top 100 companies collectively held more than 923,000 BTC. MicroStrategy (now renamed Strategy) alone holds over 607,000 BTC and continues to increase its holdings at a pace of approximately 1,000 BTC per day. Some Bitcoin mining companies are also stockpiling their production: Marathon mined 950 BTC in May 2025 but sold none, resulting in net additions equivalent to about 31 BTC per day that month.
By aggregating ETF inflows, corporate purchases, miner stockpiling, and retail buying, research estimates that between 5,000 to 6,000 BTC are currently exiting circulation on a daily basis.
Following the fourth halving, miners can only produce 450 new coins per day. This implies that daily demand is 11 to 13 times greater than daily supply.
However, a more critical question arises: how many of the 19.9 million BTC already mined are truly circulating in the market?
As of July 29, 2025, 19.9 million BTC have been mined, with the remaining 1.1 million to be slowly released over the next 115 years.
Research team statistics show that approximately 970,000 BTC mined by Satoshi Nakamoto in the early days have never moved and are widely believed to be inaccessible. A conservative estimate suggests that about 1.57 million BTC have been permanently lost due to private key loss. Of the remaining 17.36 million BTC classified as ‘effective circulating supply,’ 14.4 million BTC have not moved on-chain for more than 155 days and are categorized as ‘non-liquid supply.’
These 14.4 million ‘dormant’ BTC represent the greatest uncertainty.
The research assumes that 40% of these (approximately 5.76 million BTC) will permanently exit the market, potentially being used as corporate strategic reserves, collateral for DeFi protocols, or locked up long-term as a credit base.
Based on this calculation, the actual supply that may flow back into the market is approximately 8.64 million tokens, plus the currently known 3 million tokens circulating on exchanges, bringing the total liquid supply to approximately 11.64 million tokens.
This imbalance between supply and demand is not a theoretical deduction but an ongoing reality, and it is accelerating.
On-chain data shows that non-liquid supply increased from 13.9 million tokens on January 1, 2025, to 14.37 million tokens on June 26, equivalent to approximately 2,650 tokens per day moving into long-term holding status. Statistics indicate that 70-90% of these bitcoins transferred out of exchanges have remained unmoved for over 155 days.
Once they leave exchanges, they are unlikely to return for a long time.
From 2019 to 2020, a similar supply contraction occurred: Bitcoin continuously flowed out of exchanges, and liquid supply gradually tightened.
In August 2020, MicroStrategy began purchasing, followed by Square in October. In the subsequent months, prices accelerated from $10,000 to $69,000 by early 2021. The current rate of contraction is faster.
If the pace of ETF and corporate purchases continues, coupled with the effect of reduced mining output, the decline in liquid supply will be steeper than in the previous cycle.
At the current rate, prices may accelerate within 3 to 5 years.
The core finding of this research is: when liquid supply drops below 2 million tokens, prices may enter a phase of nonlinear growth.
Why is the number 2 million significant?
The study found through simulations of different daily BTC withdrawal volumes that when the tradable supply of Bitcoin in the market falls below 2 million, each new buy order will significantly push up prices, and rising prices incentivize more holders to hoard coins rather than sell, creating a self-reinforcing positive feedback loop.
Once within this range, every purchase by new buyers will have a disproportionate impact on price.
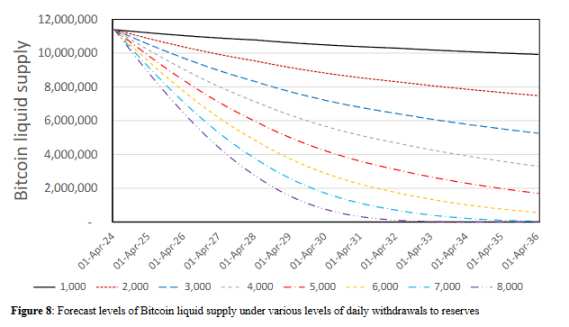
Specifically, the forecast results for 2036 under different withdrawal rates are as follows:
- If 1,000 BTC are withdrawn daily (far below current levels), by 2036, there will be 9.92 million BTC in circulating supply, with a price of approximately USD 1.39 million and an annualized return of 29.11%; this represents a relatively moderate growth trajectory.
- If 2,000 BTC are withdrawn daily (close to the benchmark assumption in the study), there will be 7.48 million BTC remaining, with a price of USD 1.6 million and an annualized return of 30.64%.
- If 4,000 BTC are withdrawn daily, the remaining supply will be 3.3 million BTC, with a price of USD 2.41 million and an annualized return of 35.17%.
- When daily withdrawals reach 6,000 BTC (around current actual levels), the circulating supply will drop to 560,000 BTC, with prices surging to USD 5.86 million and an annualized return of 45.57%. At this point, the market is approaching a critical threshold.
From a time perspective, at the current rate, this critical threshold may be reached within 3 to 5 years.
The study shows that if daily withdrawals remain at 6,000 BTC, the circulating supply will fall below 2 million BTC before the end of 2029; if the withdrawal rate accelerates to 7,000 BTC per day, this point will be reached between 2028 and 2029.
More intuitively, the change in price trajectory is evident.
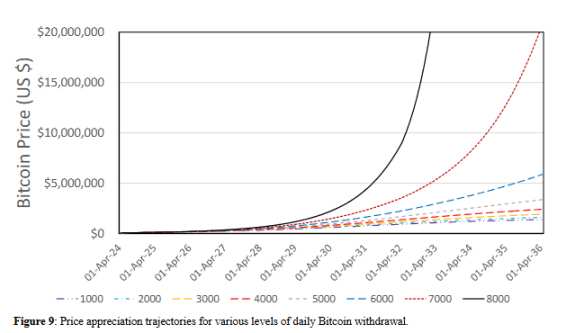
In all scenarios where fewer than 6,000 units are removed from circulation daily, the price curve maintains a relatively smooth upward trend.
However, once the amount removed from circulation reaches 7,000 units, the price curve begins to rise noticeably in 2032;
At a rate of 8,000 units per day, this upward curvature appears as early as 2030 and becomes almost vertical after 2032.
Will the anxiety over selling pressure awaken the 14.4 million dormant BTC?
The research does not assert that an accelerated price increase will necessarily occur. The greatest uncertainty lies in:
How much of the 14.4 million bitcoins that have remained unmoved for over 155 days will flow back into the market when prices rise?
The study assumes that 40% of them (approximately 5.76 million) will permanently exit the market, either being held as corporate strategic reserves, used as DeFi collateral, or because their private keys are truly irretrievable.
However, this assumed percentage may not be accurate, so the paper conducted 10,000 simulations, allowing the initial liquid supply to vary randomly between 5 million and 13 million units. The results show:
Even under the most optimistic scenario (13 million tradable tokens), there is still a 50% probability of exceeding USD 6 million by 2036.
The second variable is whether buyers will ‘flinch.’ When Bitcoin rises from USD 120,000 to USD 500,000 and then to USD 1 million, will institutions maintain their current pace of purchasing 2,900 coins per day?
The study established a parameter to measure this: if the price triples and buyers reduce their purchase volume by half, the price in 2036 may only reach USD 1.39 million.
From the current perspective, institutional buyers are not sensitive to price.
During Bitcoin’s rise from USD 65,000 to USD 118,000 (an 81% increase), the buying pace of ETFs and listed companies remained largely unchanged. If this pattern continues, price increases may not be sufficient to curb demand.
Which BTC metrics should you pay attention to?
The value of this study lies not only in providing a price figure but also in offering a set of indicators that can be continuously monitored.
Since all key variables in the model are based on publicly available data, investors can track in real time which direction the market is evolving toward.
The study recommends focusing on four core indicators:
Bitcoin balance on exchanges
Platforms such as Glassnode and CryptoQuant update the Bitcoin holdings of major exchanges daily. If this figure continues to decline and approaches 3 million (current level), it indicates that the liquid supply is tightening.
More critically, the rate of decline should be observed. If the monthly reduction exceeds 100,000 to 150,000 coins, at the current pace, the critical zone of 2 million coins will be approached within 3 to 5 years.
ETF net inflow data
Financial terminals like Bloomberg report daily fund flows for the 11 Bitcoin spot ETFs in the U.S. If the average daily net inflow remains above 2,000 to 3,000 coins, this itself is a strong signal.
Institutional demand has not weakened due to rising prices. On the contrary, if ETFs begin to show sustained net outflows, it may indicate increasing price sensitivity and the market is self-adjusting.
Proportion of supply held by long-term holders
On-chain analytics platforms track the percentage of Bitcoin that has not moved for over 155 days. Currently, this figure is approximately 72% (14.4 million / 19.9 million).
If this proportion continues to rise and exceeds 75%, it means an increasing number of coins are exiting circulation. More importantly, observe the growth rate: from January to June 2025, BTC’s illiquid supply increased from 13.9 million to 14.37 million (approximately 2,650 coins per day). If this pace accelerates to 3,000–4,000 coins per day, caution is warranted.
Comprehensive calculation of daily BTC net withdrawal from circulation
By adding ETF inflows, disclosed purchases by listed companies, and miner hoarding data, then subtracting the new supply (approximately 450 coins per day based on mining rates), a rough estimate of how many coins are exiting circulation daily can be calculated.
If this figure stabilizes between 5,000 to 6,000 coins, we are in the mid-range scenario predicted by the research; if it exceeds 7,000 coins and persists for several months, it may indicate the approach of conditions that could trigger accelerated price increases.
Of course, the study has certain limitations. For instance, the impacts of derivatives and credit intermediaries have not been fully incorporated into the model. Moreover, all these predictions are based on an assumption: the absence of significant black swan events such as protocol vulnerabilities or regulatory bans.
However, even after considering these uncertainties, the direction of change in supply and demand fundamentals is clear:
The daily addition of 450 coins is guaranteed by the protocol, institutional purchases of thousands of coins daily are publicly available data, and the contraction of liquid supply is observable on-chain.
Returning to the question posed at the beginning of the article: How high can Bitcoin still rise?
Overall, this research does not provide a definitive answer, but it reveals a mechanism:
When the fixed cap of 21 million coins meets the continuously growing institutional demand, prices may enter a phase of non-linear growth. A 75% probability points to $4.81 million by 2036, but more importantly, key milestones along the way include $1 million by 2028 and $3.35 million by 2030.
Anyone who purchased and held Bitcoin three years ago at any price level is still in profit today.
Perhaps in a few years’ time, looking back, the current price of $120,000 may become another moment when people wonder, ‘How could we have thought it was expensive?’ Or, the market will prove with facts that models are, ultimately, just models.
The answer lies in time. But at least now, you know which numbers to watch.
Search
RECENT PRESS RELEASES
Related Post


