Can AES’s Recent Stock Rebound Continue After New Renewable Energy Project Approval?
October 3, 2025
If you’re looking at AES stock, you’re probably wondering if it’s finally positioned for a turnaround, or if the challenges that have weighed on it are here to stay. The last few weeks have brought a noticeable uptick in AES’s share price, gaining 9.7% over the last 7 days and rising 6.6% over the past month. While those short-term gains are encouraging, it’s hard to ignore the longer-term context. The stock is still down 20.9% over the past year, and has lagged even further behind over the past three years.
Investors have been watching AES closely as the company navigates major market trends, especially shifts in global energy demand and the transition to cleaner power sources. These changes appear to be sparking renewed optimism about AES’s growth potential, even as some risks still linger. So, is this recent momentum a sign of a lasting recovery, or just a brief reprieve?
To help answer that, it’s smart to look at the numbers. AES scores a 5 out of 6 on our valuation check, meaning it’s currently undervalued by nearly every metric we use. That’s a rare mark for a stock with this kind of mix of short-term excitement and longer-term underperformance.
But raw numbers only tell part of the story. Next, we’ll dig into each of the valuation methods that underpin that score and see what they reveal about AES. At the end, we’ll talk about why there might be an even better way for investors to understand the company’s true worth.
Why AES is lagging behind its peers
Advertisement
Approach 1: AES Discounted Cash Flow (DCF) Analysis
The Discounted Cash Flow (DCF) model tries to estimate what a company is worth today by projecting its future cash flows and then discounting those amounts back to today’s value. For AES, this model uses the 2 Stage Free Cash Flow to Equity approach, capturing both near-term analyst estimates and longer-term forecasts.
Currently, AES’s last twelve months’ Free Cash Flow stands at -$3.03 Billion. Analysts expect the company’s Free Cash Flow to turn positive, projecting it to reach $1.38 Billion by the end of 2028. While estimates from analysts are available for the next few years, longer-term projections are extrapolated to paint a fuller picture of growth. These projections assume cash flow continues to rise steadily into the next decade.
Based on this DCF approach, AES’s intrinsic value is calculated at $19.28 per share. Compared to the current share price, this result implies the stock is trading at a 25.9% discount, suggesting it is undervalued by a substantial margin.
Result: UNDERVALUED
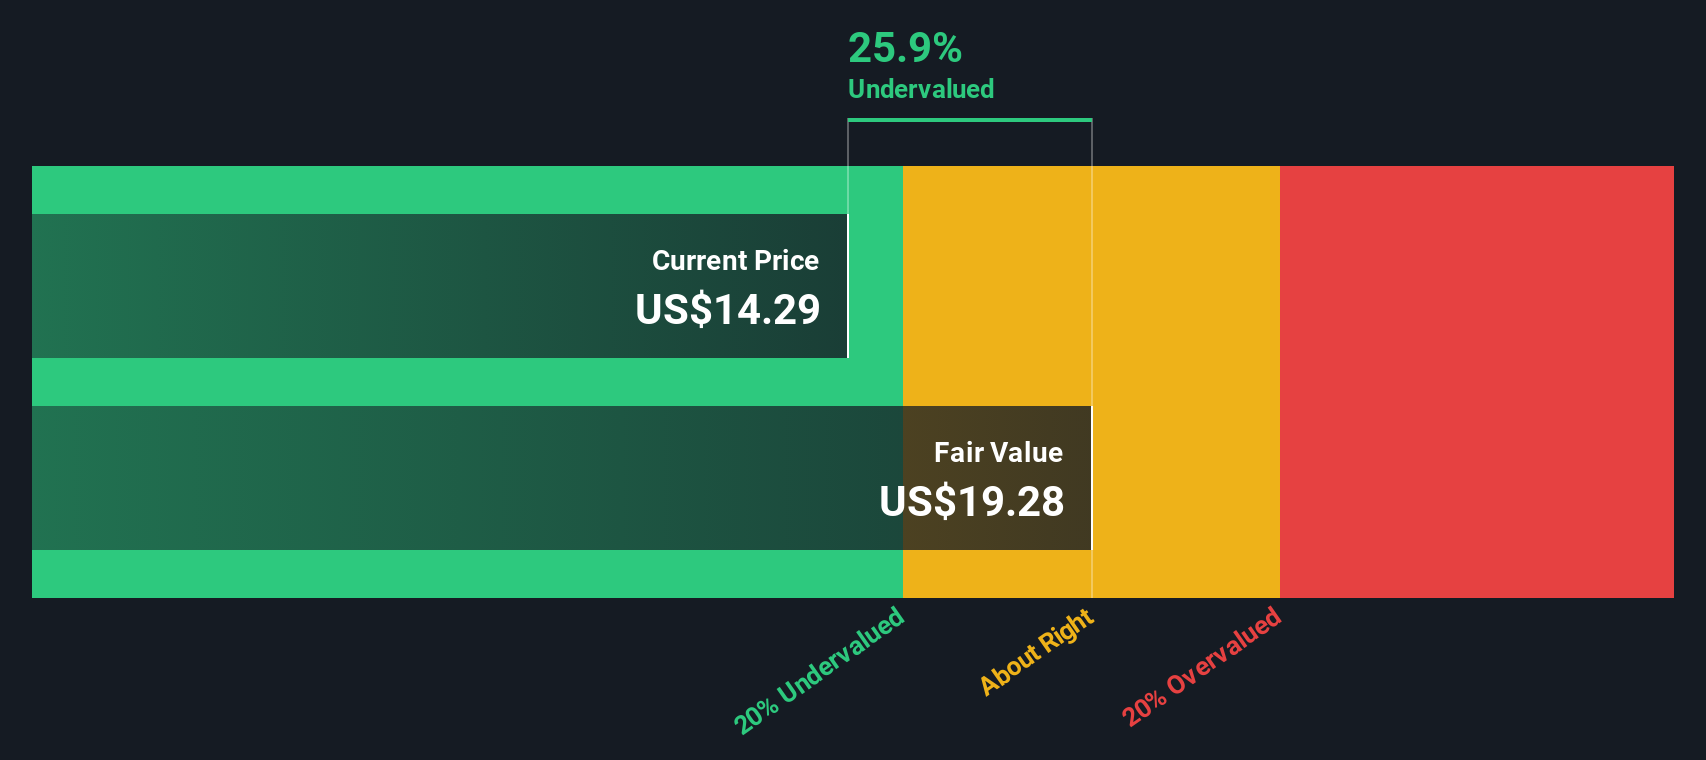
Our Discounted Cash Flow (DCF) analysis suggests AES is undervalued by 25.9%. Track this in your watchlist or portfolio, or discover more undervalued stocks.
Approach 2: AES Price vs Earnings
The Price-to-Earnings (PE) ratio is especially useful for valuing established, profitable companies like AES because it shows how much investors are willing to pay for each dollar of current earnings. A company’s PE ratio can vary depending on how much growth the market expects and how much risk investors are willing to take on. Companies with stronger growth prospects and lower perceived risk often trade at higher multiples. Riskier or slower-growing firms tend to have lower PE ratios.
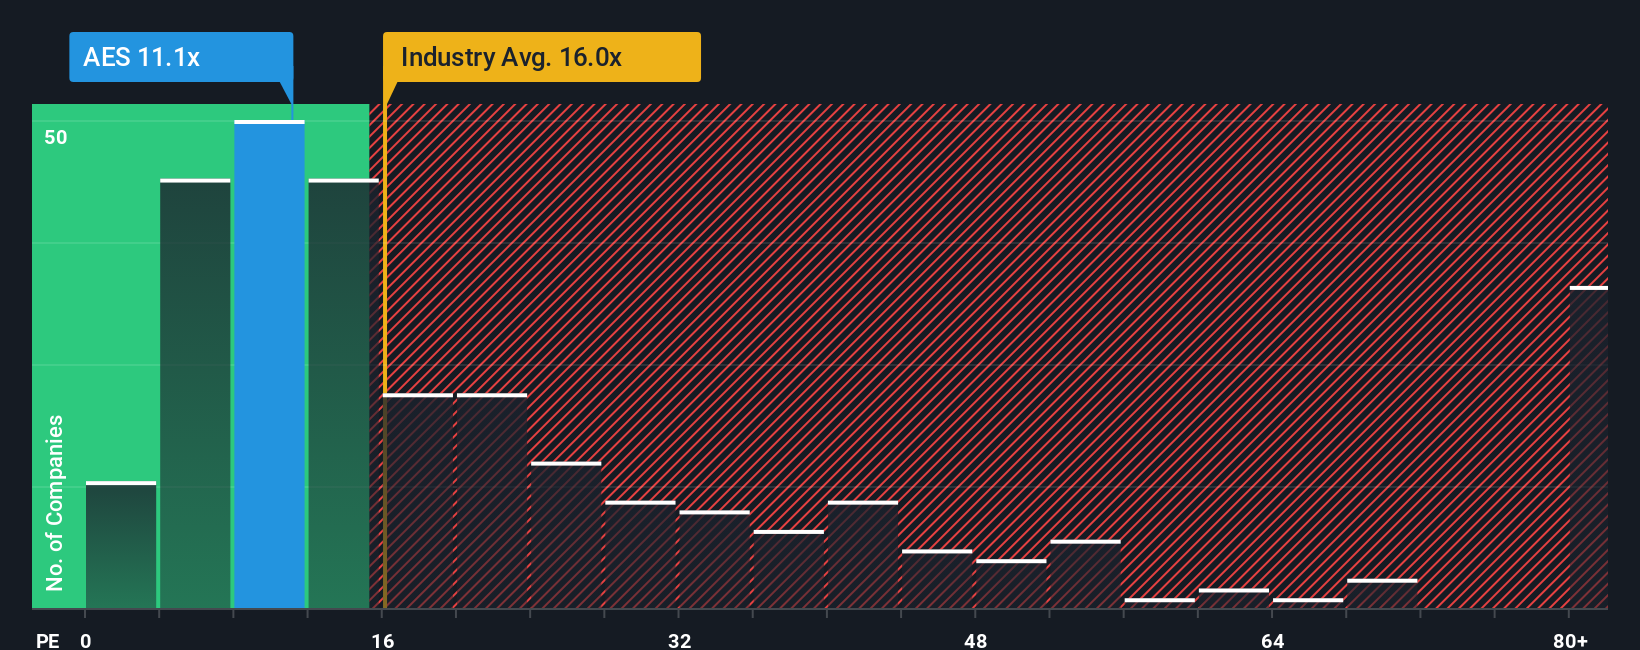
Currently, AES trades at a PE ratio of 11.1x. For context, the average PE ratio for the Renewable Energy industry is 16.0x, while AES’s peer group trades at an average of 56.9x. This means AES is valued far below both industry and peer benchmarks.
To get a sharper view of fairness, we turn to Simply Wall St’s proprietary “Fair Ratio.” This metric estimates the PE multiple that appropriately reflects AES’s unique growth prospects, risks, profit margins, industry dynamics, and size. Unlike simple comparisons to industry averages or competitors, the Fair Ratio is tailored to the company’s specific fundamentals and the market environment, providing a more relevant benchmark for investors.
For AES, the Fair Ratio stands at 29.1x, which is significantly higher than its actual PE ratio of 11.1x. This large gap suggests that the market may be underestimating the company’s potential relative to its underlying fundamentals.
Result: UNDERVALUED
PE ratios tell one story, but what if the real opportunity lies elsewhere? Discover companies where insiders are betting big on explosive growth.
Upgrade Your Decision Making: Choose your AES Narrative
Earlier we mentioned that there’s an even better way to understand a company’s valuation, so let’s introduce you to Narratives. A Narrative is your personal story about what’s driving a company’s future, allowing you to link your expectations, such as future revenue, profit margins, and fair value, to a financial forecast and ultimately to a buy or sell decision.
Narratives are designed to make investment analysis more accessible and reflective of your unique perspective, helping you go beyond just the numbers by capturing the reasons behind them. On Simply Wall St’s Community page, millions of investors are already building and comparing Narratives for companies like AES.
With Narratives, you can see clearly how different assumptions or outlooks affect a company’s Fair Value compared to its current Price. This makes it easier to identify when an opportunity may appear or disappear. Narratives also auto-update as new information, such as news or quarterly results, shifts the outlook to ensure your opinion stays relevant and actionable.
For example, one investor might believe AES deserves a Fair Value closer to $23.00 based on strong renewables growth and margin expansion, while another might see it as worth just $5.00, citing subsidy risk and capital pressures. Both Narratives can coexist, and yours can always be tailored to your own insights.
Do you think there’s more to the story for AES? Create your own Narrative to let the Community know!

This article by Simply Wall St is general in nature. We provide commentary based on historical data
and analyst forecasts only using an unbiased methodology and our articles are not intended to be financial advice. It does not constitute a recommendation to buy or sell any stock, and does not take account of your objectives, or your
financial situation. We aim to bring you long-term focused analysis driven by fundamental data.
Note that our analysis may not factor in the latest price-sensitive company announcements or qualitative material.
Simply Wall St has no position in any stocks mentioned.
New: Manage All Your Stock Portfolios in One Place
We’ve created the ultimate portfolio companion for stock investors, and it’s free.
• Connect an unlimited number of Portfolios and see your total in one currency
• Be alerted to new Warning Signs or Risks via email or mobile
• Track the Fair Value of your stocks
Have feedback on this article? Concerned about the content? Get in touch with us directly. Alternatively, email editorial-team@simplywallst.com
Search
RECENT PRESS RELEASES
Related Post


