Construction of dynamic trafficability map for unmanned vehicles considering multiple environmental factors and path planning
March 22, 2025
Abstract
Comprehensively considering the off-road trafficability of multiple environmental factors and carrying out optimal path planning is very important for assisting commanders to formulate battlefield maneuvering plans. Previous studies have had issues such as insufficient consideration of environmental factors that affect vehicle trafficability, failure to take into account the impact of meteorological factors on off-road trafficability, failure to consider spatiotemporal dynamic changes in influencing factors, and inaccurate construction of trafficability maps. Therefore, this article constructs a dynamic trafficability map of unmanned vehicles that integrates multiple environmental factors, considers the impact of meteorological factors on vehicle trafficability, takes into account the spatiotemporal dynamic changes of vehicle influencing factors, and conducts research on unmanned vehicle path planning based on the constructed trafficability map and improved A* algorithm. The results indicate that the constructed vehicle dynamic trafficability map can reflect the trafficability of different vehicles at different times. The paths planned by the traditional A* algorithm and the improved A* algorithm are different, and the improved A* algorithm is superior to the paths planned by the traditional A* algorithm. The relevant research provides theoretical and technical guidance for evaluating the trafficability of different vehicles at different times within a region.
Introduction
With the rapid development of technologies such as artificial intelligence, cloud computing, and sensors, unmanned vehicles are widely used for various tasks such as material distribution, patrol and surveillance, and battlefield support, playing an important role in off-road environments. Path planning, as one of the important technologies for autonomous driving of unmanned vehicles1, is an important means to assist commanders in formulating battlefield maneuvering plans and is also an important factor in effectively completing collaborative operations2. However, most current path-planning solutions for unmanned vehicles are essentially for environments with prominent structured features3,4. Compared with these environments, off-road environments lack road information, have rugged terrain, variable landforms, and unpredictable climate conditions. Various factors, such as elevation, slope, soil, and climate, have important limitations and impact on the off-road trafficability of unmanned vehicles5,6,7,8. Therefore, when conducting path planning in off-road environments, it is necessary to comprehensively consider the impacts of multiple environmental factors on unmanned autonomous vehicle trafficability.
Many researchers have conducted qualitative and quantitative studies on the various factors affecting off-road mobility. Wang et al. considered the actual trafficability effects of terrain slope and soil strength on vehicle mobility and determined the GO or NO GO tabu table for the terrain grid9. Liu et al. comprehensively considered the impact of slope, aspect, and surface coverage on vehicle traffic, and further divided slope angles into uphill and downhill angles, separately considering the traffic cost for uphill and downhill angles10. Khan et al. utilized LULC, Slope, Topographic Wetness Index, Terrain Roughness Index, and ground conditions to assess the potential of off-road traffic in a study area for military operations11. Sadiya et al. used land use/land cover classified satellite images of the study area, which were divided into four categories based on trafficability: NO-GO, SLOW-GO, MODERATE-GO, and GO, using a weighted overlay analysis with floor area and flooding maps, a digital elevation model (DEM), slope, soil information, and hill shape images12. Kankare et al. assessed the trafficability of static forests based on the topographic wetness index, amount of vegetation, ground water height, and ditch depth13. He et al. comprehensively considered the impact of 10 factors, such as geological hazards, slope, and land cover on vehicle traffic and quantified them using the AHP-WIC method to obtain a vehicle traffic map of the study area14. While these studies involved research on various factors that affect vehicle trafficability and achieved fruitful results, they did not consider the impact of meteorological factors on off-road traffic, nor did they consider the dynamic changes in these factors, resulting in the constructed trafficability maps (TMs) for each element being static. Owing to the dynamic changes in soil moisture, rainfall, wind, and other factors that affect vehicle trafficability, the TMs constructed for each factor should be dynamic. Therefore, previous research is limited by incomplete consideration of factors affecting vehicle trafficability, failure to consider the impact of meteorological factors on off-road trafficability, failure to consider the spatiotemporal dynamic changes of influencing factors, and inaccurate construction of TMs.
The path planning of unmanned autonomous vehicle in off-road environments is usually achieved by optimizing certain objective functions, such as the shortest path, shortest arrival time, and minimum transportation cost15,16, while satisfying multiple constraint conditions to generate a feasible optimal path from the starting point to the endpoint17,18. The A* algorithm, a commonly used static environment path-planning algorithm19, is a combination of Dijkstra’s algorithm and the breadth-first search algorithm. It has the advantages of a simple principle and short search path20. In previous studies, the A* algorithm has typically used distance as an evaluation index to determine the shortest path between two points21, and very few studies have used off-road trafficability as an evaluation index.
To solve the above-mentioned problems in path planning in off-road environments, this paper constructs a dynamic TM for unmanned vehicles that integrates multiple elements, considers the influence of meteorological factors on vehicle trafficability, and takes into account the spatiotemporal dynamic changes of vehicle influencing factors. And using off-road trafficability as an evaluation indicator, the traditional A * algorithm was improved. Based on the constructed TM and the improved A* (IA*) algorithm, path planning for different vehicles at different times is studied. Firstly, an off-road environment trafficability indicator system was constructed and the trafficability of each indicator was quantified. Then, a quantitative evaluation model for vehicle trafficability was constructed based on the analytic hierarchy process and reference comparison empirical threshold method (AHP-RCTM), and the TMs of wheeled and tracked vehicles in the study area were constructed for different times. Simultaneously, to prevent the impassable areas of individual environmental elements from being mistakenly classified as passable, the constructed TM was improved. Finally, the A* algorithm was also improved, using the cost of trafficability as an evaluation metric. A study was conducted on the path planning of different vehicles at different times under the same starting and ending points using the A* and IA* algorithms based on the constructed vehicle TM. The results indicated that the dynamic vehicle TM constructed in this study accurately reflects the trafficability of different vehicles at different times in the study area. The overall and average trafficability of the IA* algorithm for path planning were superior to those of the A* algorithm, and the IA* algorithm performed better in planning paths in areas with complex terrain. The main contributions of this paper are reflected in the following areas:
-
1.
A dynamic TM of unmanned vehicles integrating multiple factors is constructed, which solves the problems of incomplete consideration of vehicle trafficability influencing factors in previous studies, neglect of the spatial and temporal dynamic changes of influencing factors, and inaccurate construction of TM.
-
2.
The traditional A* algorithm is improved by using the off-road trafficability as the evaluation index. The path with the best trafficability is planned in the off-road environment.
-
3.
Based on the constructed vehicle dynamic TM, traditional A* algorithm and IA* algorithm are used to study the path planning of different vehicles at different times, verifying the feasibility of the proposed method.
Study area and data
In order to facilitate the consideration of the impact of off-road environmental factors on vehicle trafficability, Dengfeng City in Henan Province was chosen as the research area, shown in Fig. 1. Dengfeng City is located at the southern foot of Mount Song in the west-central part of Henan Province, between 34°31′-34°29′N latitude and 112°45′-113°15′E longitude. It is bordered by the Songshan Mountains to the north, and the Jishan and Xiongshan Mountains to the south. The elevation gradually decreases from north and south towards the middle, to hills and rivers, with a mixture of mountains, hills, basins, valleys, and small plains. Mountains, hills, and flat areas account for approximately 47%, 36%, and 17% of the total area, respectively. The slopes of the hills are mostly above 6°, with elevations ranging from 215 to 1479 m. Vegetation is abundant, making it easy to consider the impact of factors such as elevation, slope, land type, and soil on vehicle traffic.
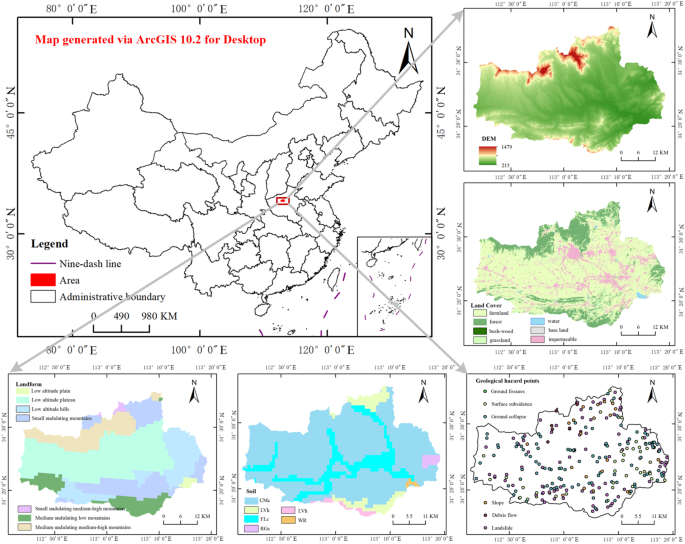
Study area (maps generated using Arc GIS 10.2).
This study comprehensively considered 11 factors of vehicle trafficability, including elevation, slope, terrain position index (TPI), topography, land cover, soil, geological hazards, rainfall, snowfall, wind power, and horizontal visibility. Dynamic TMs were constructed for wheeled and tracked vehicles. Seven types of data were utilized: DEM, landform, land cover, soil, soil moisture, historical geological hazards, and meteorological data. Digital elevation model data was downloaded from NASA with a spatial resolution of 30 m. The landform data were downloaded from the Geographic Remote Sensing Ecological Network (http://www.gisrs.cn/) with a spatial resolution of 1000 m. The land cover data was the 30 m resolution land cover data released by Yang et al. from 1985 to 202222. The soil data used the World Harmonious Soil Database China Soil Dataset, which is based on the soil data provided by the second national land survey in Nanjing, with a spatial resolution of 1 km. The soil moisture data was collected using the daily scale 1 km resolution soil moisture dataset provided by Shang et al.23. The spatial distribution data of geological hazard points came from the Geographic Remote Sensing Ecological Network (http://www.gisrs.cn/). The daily meteorological data was sourced from the National Environmental Information Center (NCEI, https://www.ncei.noaa.gov/data/global-summary-of-the-day/archive/) under the United States National Oceanic and Atmospheric Administration (NOAA), which provided rainfall, snowfall, wind force, and horizontal visibility data. The slope and TPI data were calculated based on DEM data.
Digital elevation model data are essentially a digital representation of Earth surface terrain features and are used to depict height changes of the terrain. Unless extreme events occur, the DEM data in most areas are relatively stable in the short term. Landform is a general term for various forms of the Earth’s surface, and significant changes that occur in a short period of time are relatively rare. There were relatively few cases of significant changes in land cover and geological hazard data over a short period of time. Soil can be affected by both natural (such as rainfall) and human factors (such as pollution), leading to changes in the soil. The interaction of various physical, chemical, and biological processes in the atmosphere leads to continuous changes in meteorological data at different temporal and spatial scales. Therefore, we assumed that the elevation, slope, TPI, landform, land cover, and geological hazard elements in the study area remained unchanged in the short term, whereas soil, rainfall, snowfall, wind force, and horizontal visibility changed dynamically.
Methods
Research framework
The study was divided into seven parts: data collection and preprocessing, construction of an off-road environment trafficability indicator system and quantification of trafficability, weighting of 11 environmental elements based on the analytical hierarchy process (AHP), construction of a vehicle trafficability quantitative evaluation model, construction and improvement of the dynamic vehicle TM, improvement of the A* algorithm, and comparative analysis of path planning. The technical route is illustrated in Fig. 2. This study used M151 wheeled vehicles and M1 tracked vehicles as examples to construct the dynamic TMs of two types of vehicles passing through the study area at different times. The optimal path for the two types of vehicles was planned based on the constructed TMs and the IA*algorithm.
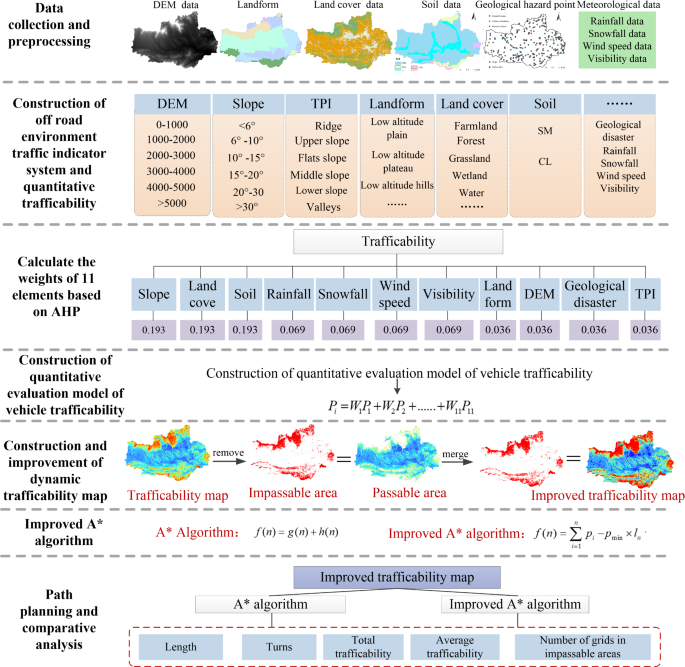
Technical flowchart (figure drawn by Microsoft Visio 2010 and ArcGIS 10.2).
Construction of off-road environment trafficability indicator system and quantification of trafficability
The off-road environment is a fundamental factor affecting vehicle trafficability and involves various factors, such as geography, geology, meteorology, and hydrology. As a complex and comprehensive system, the off-road environment cannot fully and accurately evaluate the trafficability of a vehicle with a single environmental element. Therefore, it is necessary to comprehensively consider the multiple factors that affect vehicle trafficability in off-road environments and construct an off-road environment trafficability index system. First, the off-road environment trafficability elements were divided into three categories–geographical, geological, and meteorological–and the three types of elements were further classified. Geographical elements were divided into terrain (elevation, slope, and TPI), landform, and land cover. Geological elements were separated into soil and geological hazards elements. The meteorological elements were divided into rainfall, snowfall, wind force, and horizontal visibility. The trafficability of each element was quantified based on its impact on the passage of wheeled and tracked vehicles. The construction of the off-road environment trafficability indicator system and quantification of the trafficability characteristics of each element were as follows.
Geographical elements
Geographical factors are among the basic factors affecting vehicle trafficability in off-road environments. This study focused on the influence of terrain, landform, and land cover on vehicle trafficability.
Terrain
Terrain is a general term for the shapes of land features and landforms, specifically referring to the various states of high and low undulations exhibited by fixed objects distributed above the Earth’s surface. Hundreds of terrain factors have been proposed. Based on the influence of various terrain factors on vehicle trafficability, elevation, slope, and TPI were selected to study the degree of influence of terrain on vehicle trafficability in the research area.
Elevation
As the altitude increases, the maneuvering speeds of the tracked and wheeled vehicles also change. Based on the relationship between vehicle speed changes and altitude described in the book ‘Military topography’24, the altitude was divided into five categories: 0 –1000 m, 1000 –2000 m, 2000 –3000 m, 3000 –4000 m, 4000 –5000 m. According to the changes in the speed of the two types of vehicles with increasing altitude, the trafficability of the two types of vehicles at 0 –1000 m was quantitatively set to 1. The formula for calculating the trafficability of the two types of vehicles at the other altitude ranges is shown in Eq. (1).
Where (V_0 – 1000) is the maneuvering speed of the vehicle at an altitude of 0 –1000 m; (T_0 – 1000) is the trafficability of the vehicle at an altitude of 0 –1000 m; (V_elevation_range) is the maneuvering speed of the vehicle at a certain altitude range; (T_elevation_range) is the trafficability of the vehicle at a certain altitude range.
Slope
Changes in the terrain slope can seriously affect or limit the mobility of vehicles25. Based on the motion speeds of different vehicles on different slopes described in the book ‘Military topography’24, we divided the slopes into eight categories: 0°–3°, 3°–6°, 6°–10°, 10°–15°, 15°–20°, 20°–30°, 30°–35°, and > 35°. We set the trafficability of two types of vehicles on the ground with a slope of 0°–3° to 1 and on the ground with a slope of 3°–6° to 0.9. Moreover, according to the change law of the maneuvering speed of the two vehicles with an increase in the slope, we set the trafficability of the vehicles in other slope ranges proportionally according to Eq. (2).
where (V_3^texto – 6^texto) is the speed at which a vehicle moves on a slope of 3°-6°, (S_3^circ – 6^circ ) is the trafficability of the vehicle on a slope of 3°-6°, (V_slope_range) is the speed at which the vehicle moves within a certain range of slopes, and (S_slope_range) is the trafficability of the vehicle within a certain range of slopes.
Topographic position index
The TPI value of a point on the ground is equal to the difference between the elevation of that point and the average elevation of other points in its neighborhood. It reflects the relative position relationship between a point and other points in its neighborhood on the terrain. The calculation formula is shown in Eq. (3).
where (TPI) is the TPI, Z is the elevation value of the research object, and (bar Z) is the average elevation value of the neighborhood.
This study calculated the TPI of the research area based on DEM data. Referring to the slope classification method of Andrew26, the landform of Dengfeng City was divided into six categories: ridges, upper slope, middle slope, flats slope, downhill, and valleys. Simultaneously, we set the trafficability of various landforms according to He et al.14. The trafficabilities of wheeled and tracked vehicles at different elevations, slopes, and terrain location indices are listed in Table 1.
Landform
The landform is the dominant element of natural geographical complexes, directly affecting and even determining the spatial distribution characteristics of other elements, and is one of the most important geographical elements27. Understanding the geomorphological types of the research area is of great significance for the theoretical and methodological analysis of off-road environmental trafficability. Based on the downloaded landform data of the study area, it was found that the study area covered seven geomorphological types. According to the maneuvering speed of different maneuvering equipment on different geomorphic units described by Chen et al.28, the trafficability of the two types of vehicles on different geomorphic types was quantitatively set. The trafficabilities of the two vehicles for different landform types are listed in Table 2.
Land cover
Land cover is a combination of natural and man-made structures covering the Earth’s surface, and has a significant impact on the trafficability of vehicles. According to the downloaded land cover data, it can be seen that the study area mainly includes 8 land types, namely farmland, forest, grassland, bush-wood, wetland, water, impervious layer and bare land. The impact coefficients of different land types on the trafficability of different vehicles described by He et al.14 and Kankare et al.13 were set for the trafficability of the two types of vehicles on different land types. The trafficability of the two types of vehicles on different land cover types is listed in Table 3.
Geological elements
Soil
Soil is an important component of off-road mobility and its interaction with vehicles varies under different conditions. The cone index method is commonly used to quantitatively evaluate soil traffic conditions in the field of ground vehicle mechanics. It is widely used because of its simplicity and feasibility29. Many researchers currently calculate soil strength by constructing mathematical models between cone index, soil type, and soil moisture to determine vehicle trafficability30,31. However, these studies were all based on the Unified Soil Classification System (USCS), and obtaining soil data based on the USCS for soil classification is difficult, creating an obstacle to the further application of the cone index method for determining soil trafficability. Based on this, we processed the obtained soil data and used a mathematical model between the cone index, soil type, and soil moisture to calculate soil trafficability in the study area. The calculation process for the trafficability of the two types of vehicles in different soils was as follows.
â‘ Calculated soil data classified by USCS within the research area were calculated. The soil data used in this study were obtained from the China Soil Dataset of the World Harmonious Soil Database, which includes the composition ratios of clay, silt, and sand. According to the different compositions of clay, silt, and sand, the soil texture classification table of the United States Department of Agriculture (USDA) was used to classify the soil types in the study area. Referring to the rules proposed by Ruben and Susan32 for converting the USDA soil classifications to USCS classifications, the USDA soil types were converted to those classified by the USCS to obtain the USCS soil types in the study area.
â‘¡ Calculated soil strength. The mathematical model between the soil strength, type, and moisture constructed by Mason and Baylot33 was used to calculate the soil strength, as shown in Eq. (4).
where (RCI) represents the soil strength; (V_w) is the volume of water; (r_w) is the unit weight of water; (V_s) is the volume of soil; (r_s)is the unit weight of soil; a and b are the coefficient corresponding to each type of soil classified by the USCS, as shown by Mason and Baylot33.
â‘¢ Calculated the trafficability of soil. The Vehicle Cone Index (VCI) characterizes the required soil pressure-bearing capacity of a vehicle and can be used to determine its trafficability based on the remodeling cone index (RCI) and VCI. If the RCI value of the soil was greater than the VCI value required by the vehicle, the terrain was considered passable, and the trafficability was set to 1. Otherwise, the trafficability was set to 0. The VCI values of the two vehicle types are provided by Stevens et al.34. This study compares the VCI values of each vehicle that can pass through at least one time with the calculated RCI values of the soil in the study area to determine the trafficability of the soil.
Geological hazards
Natural disasters within the research area must be considered when vehicles pass through the area. Natural disaster points around roads and nonroad traffic environmental factors can affect vehicle trafficability in off-road environments. This study focused on the impact of geological hazards on vehicle trafficability. Using historical geological hazard data, sensitive areas prone to geological hazards in off-road environments can be identified, thereby improving the safety of planned routes. Kernel density analysis was conducted on historical disaster point data in the study area, the results were normalized, and the risk level value of geological disasters in each grid in the study area was obtained. Finally, the geological hazard trafficability of each grid was calculated using Eq. (5).
where (L_p) is the trafficability of geological disasters in each grid, and (L_d) is the risk degree value of geological disasters in each grid.
Meteorological elements
Rainfall can significantly reduce the ground adhesion coefficient, decrease tire adhesion, and lower vehicle stability, thereby affecting vehicle trafficability. Snowfall will reduce the friction coefficient of the ground, thereby affecting vehicle braking performance. Accumulation from heavy snowfall can make it impossible for vehicles to pass. Wind forces can affect the speed and stability of vehicles, increasing their risk. Horizontal visibility can affect vehicle trafficability, with lower visibility having a greater impact on vehicle trafficability. Therefore, the impact coefficients of rainfall, snowfall, wind force, and horizontal visibility on vehicle traffic were set based on the description by Zhou35, and the results are listed in Table 4.
Weighting based on the hierarchy process method
The AHP is a hierarchical weighting analysis method that combines qualitative and quantitative analyses. It is a widely used subjective weighting method that has the advantage of simplifying complex problems and calculations36,37,38. Therefore, this study used AHP to determine the weights of various factors affecting the trafficability of vehicles. Based on Saaty’s 1–9 proportional scaling method39 and considering the actual situation of the research area, combined with expert experience and the research of other investigators, the AHP judgment matrix constructed in this study and the weights calculated for the impact of each element on vehicle trafficability are listed in Table 5.
By using the consistency index and random consistency ratio (CR) of the matrix to test the consistency of the matrix, it was calculated that the CR of the AHP judgment matrix constructed in this study was 0.0009. Therefore, the judgment matrix passed the consistency test (CR < 0.1), and the weights of the calculated elements on the impact of vehicle traffic could be used.
Construction of a quantitative evaluation model for vehicle trafficability based on the AHP and reference comparison empirical threshold method
The AHP assumes that each element is independent, but in reality, there may be interactions between each element; therefore, it is difficult to determine the correlation between factors using only the AHP. The reference comparison experience threshold method (RCTM) quantitatively evaluates the trafficability of various factors based on expert knowledge, field experience, and reference to the work of other researchers, which is beneficial for understanding the obstacles caused by various factors to off-road trafficability; however, it cannot determine the correlation between factors. By combining the AHP with the RCTM, the relationship between a single factor and vehicle trafficability can be determined, and the weights of multiple factors affecting vehicle trafficability can also be calculated. Therefore, based on Eq. (6), we constructed a quantitative evaluation model for vehicle trafficability based on the weight coefficients of each element calculated by the AHP and the trafficability characteristics of each factor provided by the RCTM.
where (P_i) is the comprehensive vehicle trafficability of the 11 elements in the i-th grid; (W_1 – W_11) is the weight of the influence of the 11 elements on the vehicle trafficability; (P_1 – P_11) is the vehicle trafficability value of the 11 elements.
Construction and improvement of the dynamic vehicle trafficability map
Because this study assumed that the five elements of soil, rainfall, snowfall, wind force, and horizontal visibility change dynamically, the vehicle trafficability of each grid in the study area, calculated based on the vehicle trafficability performance quantitative evaluation model, will also change dynamically, resulting in different vehicle TMs constructed in the study area at different times. The process of constructing a dynamic vehicle TM was as follows.
-
(1)
A TM was constructed with 11 elements within the study area at a certain moment. Based on the obtained data and the trafficability of different attributes of each element, the TMs of wheeled and tracked vehicles for 11 elements in the study area were constructed and the areas where each vehicle was impassable in each element were extracted.
-
(2)
The impassable areas for each vehicle in each element were merged to form the impassable areas for wheeled and tracked vehicles within the study area.
-
(3)
Based on the constructed quantitative evaluation model for vehicle trafficability and the TM of 11 elements, we calculated the TMs of the two types of vehicles in the study area at a particular time.
-
(4)
The constructed vehicle TM was the result of a comprehensive calculation of 11 elements, which easily ignores the influence of individual elements, resulting in the incorrect classification of impassable areas as passable based on individual elements. Therefore, the constructed TM was improved. Areas where the impassable areas for the two types of vehicles merged were removed from the established TMs, leaving only the passable areas for each type of vehicle. The impassable and passable areas of the two vehicle types were merged separately to obtain the final TM for each vehicle type. Vehicle TMs constructed at different times differ; thus, a long-term dynamic vehicle TM was constructed.
A* algorithm improvement
The A* algorithm is one of the commonly used static environment path planning algorithms, performing especially well in finding the shortest path between two points. It combines the advantages of best priority search and Dijkstra’s algorithm, predicting the optimal path from the current node to the target node through an evaluation function, taking into account both the actual cost from the starting node to the current node and the estimated cost from the current node to the target node. The evaluation function (f(n)) for nodes is shown in Eq. (7).
where (f(n)) is the cost function of node, (g(n)) is the cumulative cost from the starting node to node n, and (h(n)) is the estimated cost from node n to the target node.
The traditional A* algorithm typically uses distance as the cost; however, in this study, we used trafficability as the cost. The calculation formula for (g(n)) used is shown in Eq. (8).
where (p_i) represents the trafficability of each grid in the TM and (sumlimits_i=1^n p_i) represents the cumulative trafficability cost of all grids traversed from the starting node to the current node.
In the traditional A* algorithm, (h(n)) is the Manhattan or Euclidean distance from the current node to the target node, whereas in this study, (g(n)) represents the cost of trafficability. If (h(n)) represents the cost of distance, it is difficult to balance the weights of (h(n)) and (g(n)) on (f(n)). Therefore, this study improved (h(n)). When the estimated heuristic cost (h(n)) is less than or equal to the actual cost (h(n)), the A* algorithm ensures path optimality40. Therefore, we used the product of the Euclidean distance from the current node to the target node and the minimum trafficability value in the remaining untraversed grid to represent (h(n)). Because the A* algorithm also needs to plan the shortest path as much as possible when searching for the node with the highest trafficability, we assumed that the smaller the Euclidean distance from the current node to the target node, the better; that is, the smaller the (h(n)), the shorter the planned path. We also assumed that the higher the cost of trafficability, the easier it is for vehicles to pass through. Therefore, it was necessary to identify the node with the largest (f(n)) among the neighboring nodes of the current node as the next node to pass through. The formula for the IA* algorithm is shown in Eq. (9).
where (p_min) is the minimum trafficability value in the remaining untraversed grid and (l_n) is the Euclidean distance from the current node to the target node. The larger the (f(n)), the easier it is for the vehicles to pass through.
To ensure the safety and feasibility of the path, we expanded the impassable areas within the study area by one grid to ensure the safety of vehicles.
Results
Dynamic trafficability map analysis
Using January 1, March 6, and August 6, 2020, as examples, wheeled and tracked vehicle TMs were constructed for these different time periods. Based on the quantified trafficability of different attributes of each element, the two vehicle TMs of 11 elements in the study area on August 6, 2020 are shown in Fig. 3. The two impassable areas for the 11 elements within the study area constructed on January 1, March 6, and August 6, 2020 are shown in Fig. 4. The TMs of the two types of vehicles in the study area constructed by integrating 11 elements at different times are shown in Fig. 5.
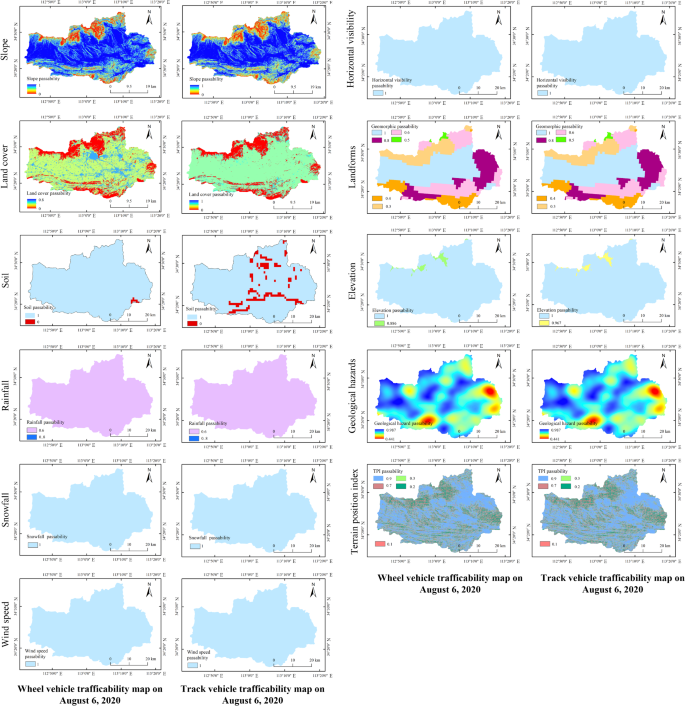
Constructed wheeled and tracked vehicle TMs for 11 elements within the study area on August 6, 2020 (Maps generated by ArcGIS 10.2).
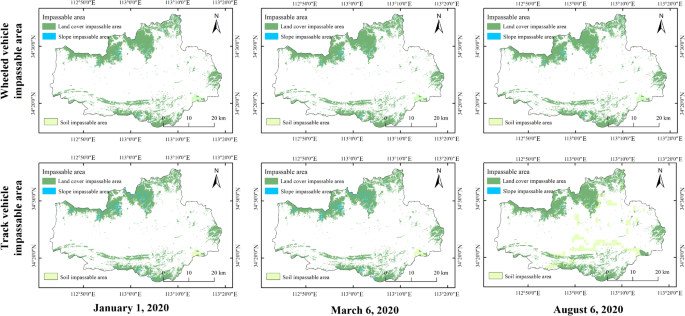
Two kinds of vehicle impassable area maps of 11 elements in the study area at different times (Maps generated by ArcGIS 10.2).
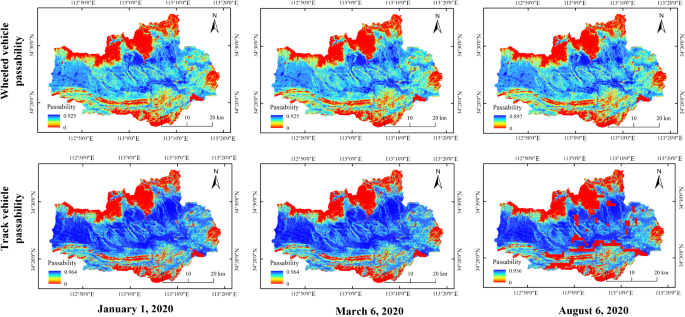
Two dynamic vehicle TMs of 11 elements in the study area at different times (Maps generated by ArcGIS 10.2).
As shown in Fig. 4, the impassable areas for wheeled and tracked vehicles differed at different times. Owing to the influences of land type, slope, and soil factors, the impassable areas for the two types of vehicles at the same time are also different. Also, due to differences in soil moisture, rainfall, snowfall, and other factors at different times, the impassable areas for the same type of vehicle may also vary at different times.
According to Fig. 5, the TMs of the wheeled and tracked vehicles differ at different times. Because of dynamic changes in factors such as soil moisture, rainfall, snowfall, wind speed, and visibility, the TMs of the same type of vehicle may also vary at different times. Therefore, a vehicle TM constructed by integrating multiple elements should be dynamic and change over time. In addition, it is difficult for both types of vehicles to pass through water bodies and steep mountainous or hilly areas. From Fig. 5, it can be seen that the trafficability of these areas in the constructed vehicle TM is 0, whereas vehicles can more easily pass through areas with small slopes and flat terrain. In the constructed vehicle TM, the trafficability of these areas was higher, indicating that the wheeled-vehicle trafficability map generated by the proposed method was reliable.
Analysis of path planning results
It is important to comprehensively consider the vehicle trafficability of multiple factors and apply the constructed multi-factor dynamic TM to practical path planning research. This study selected three different starting and ending points, and researched path planning on wheeled and tracked vehicles at different times based on the A* and IA* algorithms. The path results of the planned three sets of wheeled and tracked vehicles with different starting and end points are shown in Figs. 6 and 7, respectively. The comparison results of path planning between the A* and IA* algorithms are shown in Fig. 8.
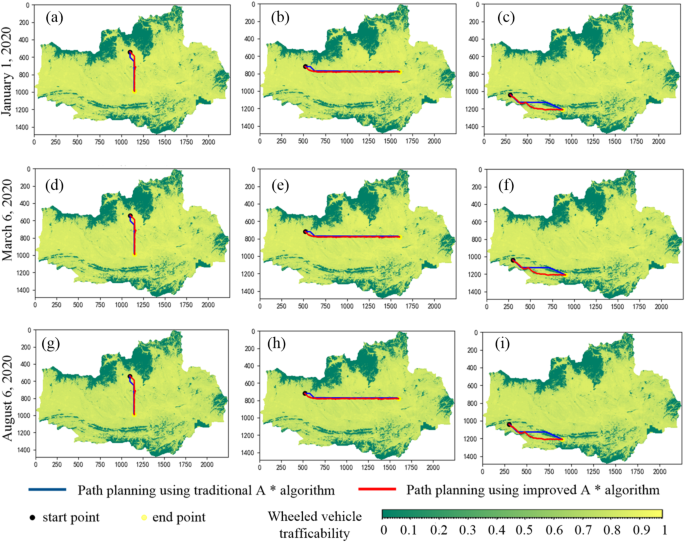
Three sets of wheeled vehicle path diagrams with different starting and end points planned at different times. (a),(d),(g) The path diagram starting from (540,1100) and ending at (990,1150). (b),(e),(h) The path diagram starting from (720, 520) and ending at (780,1600). (c),(f),(i) The path diagram starting from (1040,300) and ending at (1210,900). (Maps generated using ArcGIS 10.2 and PyCharm).
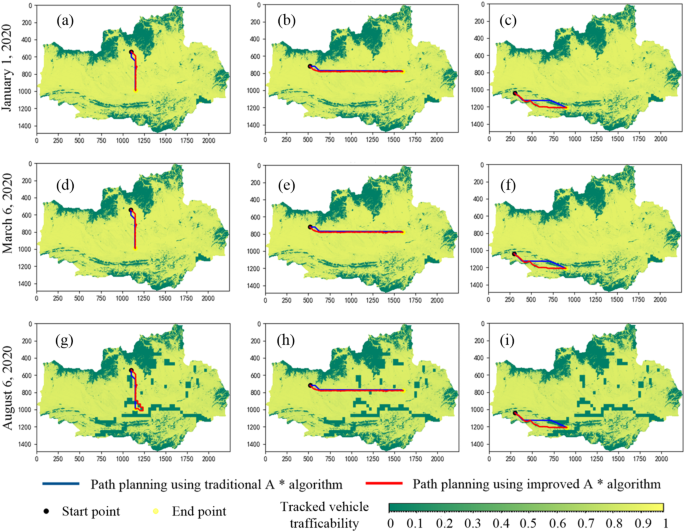
Three sets of tracked vehicle path diagrams with different starting and end points planned at different times. (a),(d),(g) The path diagram starting from (540,1100) and ending at (990,1150). (b),(e),(h) The path diagram starting from (720,520) and ending at (780,1600). (c),(f),(i) The path diagram starting from (1040,300) and ending at (1210,900). (Maps generated using ArcGIS 10.2 and PyCharm).
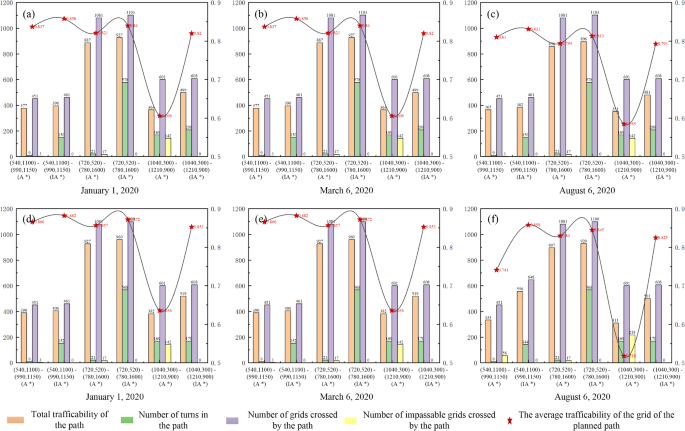
Comparison results of path planning between the A* and IA* algorithms. (a–c) Optimal path information for wheeled vehicles planned by the A* and IA* algorithms. (d–f) Optimal path information for tracked vehicles planned by the A* and IA* algorithms.
It can be seen from Figs. 6 and 7 that the path planned by the A* algorithm is different from that planned by the IA* algorithm. The path planned by the A* algorithm passes through the impassable area, while the IA* algorithm avoids the impassable area, indicating that the path planned by the IA* algorithm is safer and more feasible. Because of the different dynamic TMs constructed at different times, the paths planned by the two algorithms for different vehicles at different times were also different. Therefore, when conducting path-planning research in off-road environments, it is necessary to fully consider the spatiotemporal dynamic changes in environmental factors that affect vehicle trafficability. According to Fig. 8, it can be seen that the total and average trafficability of the path planned by the IA* algorithm are greater than those planned by the A* algorithm. With an increase in the proportion of impassable grids in the total path grid planned by the A* algorithm, the proportion of improvement in the total and average trafficability of the path planned by the IA* algorithm compared to the A* algorithm continued to increase, indicating that the IA* algorithm performs better in planning paths in areas with a large number of impassable grids.
Discussion
To solve the problems of incomplete consideration of factors affecting vehicle trafficability in off-road environments, failure to consider the impact of meteorological factors on off-road trafficability, failure to consider the spatiotemporal dynamic changes of influencing factors, and inaccurate construction of TMs, This article constructs a dynamic TM of unmanned vehicles that integrates multiple factors, taking into account the impact of meteorological factors on vehicle trafficability that other scholars have not considered, and considering the spatiotemporal dynamic changes of vehicle influencing factors. And using off-road trafficability as an evaluation indicator, the traditional A* algorithm was improved. At the same time, to verify the feasibility of the method proposed in this paper, path planning studies were conducted for different vehicles at different times based on the constructed dynamic TM and the IA* algorithm. The vehicle dynamic TM constructed in this article, which integrates multiple elements, can help commanders comprehensively, quickly, and accurately understand the vehicle trafficability in a certain area. The IA* algorithm proposed in this article can also assist commanders in formulating effective action and route plans. However, this study only constructed a historical vehicle dynamic TM based on historical data and planned the optimal path at past times, without conducting research on the trafficability and optimal path of vehicles in a certain area at a certain future time. Therefore, future research will focus on constructing dynamic TMs and optimal trafficability paths for the study area based on predicted data of various elements, in order to assist commanders in formulating timely, accurate, and rapid battlefield maneuvering plans.
Conclusion
In this paper, a dynamic TM of unmanned vehicles integrating various elements is constructed, and the traditional A* algorithm is improved. Based on the constructed dynamic TM and the IA* algorithm, the path planning is studied. Taking Dengfeng City as an example, the dynamic TMs of different vehicles at different times were constructed, and path planning research was conducted. The results were as follows:
-
(1)
The TMs of wheeled and tracked vehicles differ at different times and the TMs of the same vehicle may also differ at different times.
-
(2)
A vehicle TM constructed by integrating multiple elements is dynamic and changes over time.
-
(3)
The paths planned by the A* and IA* algorithms are different. The IA* algorithm plans safer and more feasible paths and performs better in planning paths in areas with a large number of impassable grids.
Data availability
The datasets used and/or analysed during the current study available from the corresponding author on reasonable request.
References
-
Liu, P. et al. Research on local path planning of unmanned vehicles based on improved driving risk field. Sci. Rep. 14, 29153. https://doi.org/10.1038/s41598-024-78025-x (2024).
-
Pundir, S. K. & Garg, R. D. Development of rule based approach for assessment of off-road trafficability using remote sensing and ancillary data. Quatern. Int. 575, 308–316. https://doi.org/10.1016/j.quaint.2020.07.017 (2021).
-
Miao, C., Chen, G., Yan, C. & Wu, Y. Path planning optimization of indoor mobile robot based on adaptive ant colony algorithm. Comput. Ind. Eng. 156, 107230. https://doi.org/10.1016/j.cie.2021.107230 (2021).
-
Zhang, J., Wu, J., Shen, X. & Li, Y. Autonomous land vehicle path planning algorithm based on improved heuristic function of A-Star. Int. J. Adv. Rob. Syst. 18 (5), 17298814211042730. https://doi.org/10.1177/17298814211042730 (2021).
-
Eder, M., Prinz, R., Schöggl, F. & Steinbauer-Wagner, G. Traversability analysis for off-road environments using locomotion experiments and Earth observation data. Robot. Auton. Syst. 168, 104494. https://doi.org/10.1016/j.robot.2023.104494 (2023).
-
Hua, C. et al. A global path planning method for unmanned ground vehicles in off-road environments based on mobility prediction. Machines 10 (5), 375. https://doi.org/10.3390/machines10050375 (2022).
-
Guo, C. et al. Terrain-adaptive hierarchical speed planning method for off-road environments. IEEE Trans. Veh. Technol. 73, 18363–18379. https://doi.org/10.1109/TVT.2024.3450203 (2024).
-
Pundir, S. K. & Garg, R. D. A comprehensive approach for off-road trafficability evaluation and development of modified equation for Estimation of RCI to assess regional soil variation using Geospatial technology. Quaternary Sci. Adv. 5, 100042. https://doi.org/10.1016/j.qsa.2021.100042 (2022).
-
Wang, H. et al. Off-road path planning based on improved ant colony algorithm. Wireless Pers. Commun. 102 (2), 1705–1721. https://doi.org/10.1007/s11277-017-5229-5 (2018).
-
Liu, Q. et al. Unmanned vehicle off-road path-planning method with comprehensive constraints on multiple environmental factors. Int. J. Digit. Earth. 17 (1), 2408453. https://doi.org/10.1080/17538947.2024.2408453 (2024).
-
Khan, M. N., Kashif, M. & Shah, A. Off-road trafficability for military operations using multi-criteria decision analysis. Int. J. Adv. Remote Sens. GIS. 10 (1), 3425–3437. https://doi.org/10.23953/cloud.ijarsg.489 (2021).
-
Sadiya, T. B. et al. Military terrain trafficability analysis for North-East Nigeria: A GIS and remote sensing-based approach. J. Mob. Comput. Application. 4, 34–46. https://doi.org/10.9790/0050-04013446 (2016).
-
Kankare, V. et al. Assessing feasibility of the forest trafficability map for avoiding rutting – a case study. Silva Fennica 53 (3). https://doi.org/10.14214/sf.10197 (2019).
-
He, K., Dong, Y., Han, W. & Zhang, Z. An assessment on the off-road trafficability using a quantitative rule method with geographical and geological data. Comput. Geosci. 177, 105355. https://doi.org/10.1016/j.cageo.2023.105355 (2023).
-
Baranidharan, B., Meidute-Kavaliauskiene, I., Mahapatra, G. & Čin�ikaitė, R. Assessing the sustainability of the prepandemic impact on fuzzy traveling sellers problem with a new fermatean fuzzy scoring function. Sustainability 14, 16560. https://doi.org/10.3390/su142416560 (2022).
-
Baranidharan, B. & Mahapatra, G. A new solution technique for fuzzy transportation problem using novel ranking functions on heptagonal fuzzy numbers: A case study of regional shipment. J. Comput. Cogn. Eng. https://doi.org/10.47852/bonviewJCCE42023253 (2024).
-
Park, C., Park, J. S. & Manocha, D. Fast and bounded probabilistic collision detection for high-DOF trajectory planning in dynamic environments. IEEE Trans. Autom. Sci. Eng. 15 (3), 980–991. https://doi.org/10.1109/TASE.2018.2801279 (2018).
-
Tsardoulias, E. G., Iliakopoulou, A., Kargakos, A. & Petrou, L. A review of global path planning methods for occupancy grid maps regardless of obstacle density. J. Intell. Robotic Syst. 84, 829–858. https://doi.org/10.1007/s10846-016-0362-z (2016).
-
Goldberg, A. V. & Harrelson, C. Computing the shortest path: A* search meets graph theory. SODA 5, 156–165 (2003).
-
Duchon, F. et al. Path planning with modified a star algorithm for a mobile robot. Procedia Eng. 96 (07), 59–69. https://doi.org/10.1016/j.proeng.2014.12.098 (2014).
-
Huang, B., Wu, Q. & Zhan, F. A shortest path algorithm with novel heuristics for dynamic transportation networks. Int. J. Geogr. Inf. Sci. 21 (6), 625–644. https://doi.org/10.1080/13658810601079759 (2007).
-
Yang, J. & Huang, X. The 30m annual land cover dataset and its dynamics in China from 1990 to 2019. Earth Syst. Sci. Data. 13 (8), 3907–3925. https://doi.org/10.5194/essd-13-3907-2021 (2021).
-
Shang, W. et al. China soil moisture dataset (2000–2020). A Big Earth Data Platform for Three Poles. https://doi.org/10.11888/Terre.tpdc.272415 (2022).
-
Surveying and Mapping Bureau of the General Staff Department. Military topography (PLA Press, 1997).
-
Strahler, A. N. Quantitative slope analysis. Geol. Soc. Am. Bull. 67 (5), 571–596. https://doi.org/10.1130/0016-7606 (1956).
-
Weiss, A. Topographic position and landforms analysis. In Poster presentation, ESRl user conference. SanDiego, CA. 200, (2001).
-
Cheng, W., Song, K., Zhou, C. & Tang, G. Commentaries and prospect on the geomorphic information spectrum. Adv. Earth Sci. 37 (7), 661–679. https://doi.org/10.11867/j.issn.1001-8166.2022.037 (2022).
-
Chen, Z. et al. Theory and method of land environment transportation analysis. Beijing: Sci. Press. (2023).
-
Li, J., Li, H. & Ning, J. Analysis of the mobility of tracked vehicle on soft soil. Agricultural Equip. Veh. Eng. 5, 3–6 (2010).
-
Frankenstein, S. Fast all-season soil strength (FASST). Washington: U.S. Army Corps of Engineers Washington, 62–74 (2004).
-
Lin, J., Sun, Y. & Zeng, Q. Experimental comparison of various models related soil water content and bulk density to cone index-I. A general and statistical analysis for each model. J. Basic. Sci. Eng. 16 (6), 779–786 (2008).
-
GarcÃa-Gaines, R. A. & Frankenstein, S. USCS and the USDA soil classification system. Vicksburg: US Army Engineer Research and Development Center (2015).
-
Mason, G. L. & Baylot, E. A. Predicting soil strength in terms of cone index and california bearing ratio for trafficability (2016).
-
Stevens, M. T., McKinley, G. B. & Vahedifard, F. Full-featured ground vehicle mobility analysis using different soil moisture sources. Int. J. Veh. Perform. 3 (1), 19–35. https://doi.org/10.1504/IJVP.2017.10002319 (2017).
-
Zhou, Z. Research on road trafficability analysis considering meteorological factors. Zhengzhou: Inform. Eng. Univ. (2009).
-
Balasundaram, P., Baranidharan, B. & Sivaram, N. A VIKOR based selection of phase change material for thermal energy storage in solar dryer system. Mater. Today Proc. 90, 245–249. https://doi.org/10.1016/j.matpr.2023.06.174 (2023).
-
Bavadharani, B., Mahapatra, G., Sivaram, N., Balasundaram, P. & Baranidharan, B. Selection of phase change material under uncertainty for waste heat recovery in diesel engine generator. J. Energy Storage 108 https://doi.org/10.1016/j.est.2024.114982 (2025).
-
Liu, Y., Eckert, C. M. & Earl, C. A review of fuzzy AHP methods for decision-making with subjective judgements. Expert Syst. Appl. 161. https://doi.org/10.1016/j.eswa.2020.113738 (2020).
-
Saaty, R. W. The analytic hierarchy process—what it is and how it is used. Math. Model. 9 (3–5), 161–176. https://doi.org/10.1016/0270-0255(87)90473-8 (1987).
-
Liu, Y. et al. A passage time–cost optimal A* algorithm for cross-country path planning. Int. J. Appl. Earth Obs. Geoinf. 130, 103907. https://doi.org/10.1016/j.jag.2024.103907 (2024).
Funding
This research was supported by the Key Project of the National Natural Science Foundation of China [Grant No. 42130112]; the Research Project of Central Plains scholar You Xiong Scientist studio [2020].
Author information
Authors and Affiliations
Contributions
X.Y. and Q.L. conceptualized the work. X.Z. and Q.L. carried out the analytical modeling and analysis. X.Y. and Q.L. created some graphs and tables. X.Y., Q.L. and X.Z. designed and conducted the experiments. J.Z. and Q.L. wrote the first version of the manuscript. J.Z. and Q.L. planned, coordinated, and supervised the work. All authors reviewed the manuscript.
Corresponding author
Ethics declarations
Competing interests
The authors declare no competing interests.
Additional information
Publisher’s note
Springer Nature remains neutral with regard to jurisdictional claims in published maps and institutional affiliations.
Rights and permissions
Open Access This article is licensed under a Creative Commons Attribution-NonCommercial-NoDerivatives 4.0 International License, which permits any non-commercial use, sharing, distribution and reproduction in any medium or format, as long as you give appropriate credit to the original author(s) and the source, provide a link to the Creative Commons licence, and indicate if you modified the licensed material. You do not have permission under this licence to share adapted material derived from this article or parts of it. The images or other third party material in this article are included in the article’s Creative Commons licence, unless indicated otherwise in a credit line to the material. If material is not included in the article’s Creative Commons licence and your intended use is not permitted by statutory regulation or exceeds the permitted use, you will need to obtain permission directly from the copyright holder. To view a copy of this licence, visit http://creativecommons.org/licenses/by-nc-nd/4.0/.
About this article
Cite this article
Liu, Q., You, X., Zhang, X. et al. Construction of dynamic trafficability map for unmanned vehicles considering multiple environmental factors and path planning.
Sci Rep 15, 9957 (2025). https://doi.org/10.1038/s41598-025-94377-4
-
Received: 21 December 2024
-
Accepted: 13 March 2025
-
Published: 22 March 2025
-
DOI: https://doi.org/10.1038/s41598-025-94377-4
Keywords
Search
RECENT PRESS RELEASES
Related Post


