Crypto Today: Bitcoin, Ethereum, XRP broadly stall as Middle East tensions keep markets on Edge
June 17, 2025
- Bitcoin’s price action remains relatively muted below $107,000 as tensions in the Middle East thaw.
- US President Trump leaves the G7 meeting early, calls for the evacuation of Tehran amid uncertainty in global markets.
- Ethereum holds on tightly to key support area, including the 200-day EMA, as spot ETF inflows remain steady.
- XRP struggles to gain bullish momentum and trades below a critical confluence resistance at around $2.24.
Global markets remain on the edge amid tensions in the Middle East, with Bitcoin (BTC) holding below $107,000 resistance at the time of writing on Tuesday. Leading altcoins, including Ethereum (ETH) and Ripple (XRP), are struggling to gain bullish momentum, reflecting growing uncertainty in the uptrend.
United States (US) President Donald Trump left the G7 summit in Canada early for a “much bigger” reason than the ceasefire between Israel and Iran. Reuters reported that President Trump wants a “real end” to the conflict, including Iran “giving up entirely” on the idea of nuclear weapons.
President Trump has advised residents of Tehran, the capital of Iran, to evacuate the city, hinting at a potential escalation.
Meanwhile, Bitcoin (BTC) and the larger cryptocurrency market remain on the edge as investors digest the impact of the conflict amid rising Oil prices. The largest cryptocurrency by market capitalization is trading broadly sideways after failing to make gains above the $107,000 resistance level on Monday.
Inflows into US spot Exchange Traded Funds (ETFs) extended the bullish streak from last week. SoSoValue data indicates that Bitcoin spot ETFs saw a $412 million daily net inflow on Monday, surpassing the $323 million recorded on Friday. BlackRock’s IBIT led with a net inflow of $267 million, followed by Fidelity’s FBTC with $83 million.
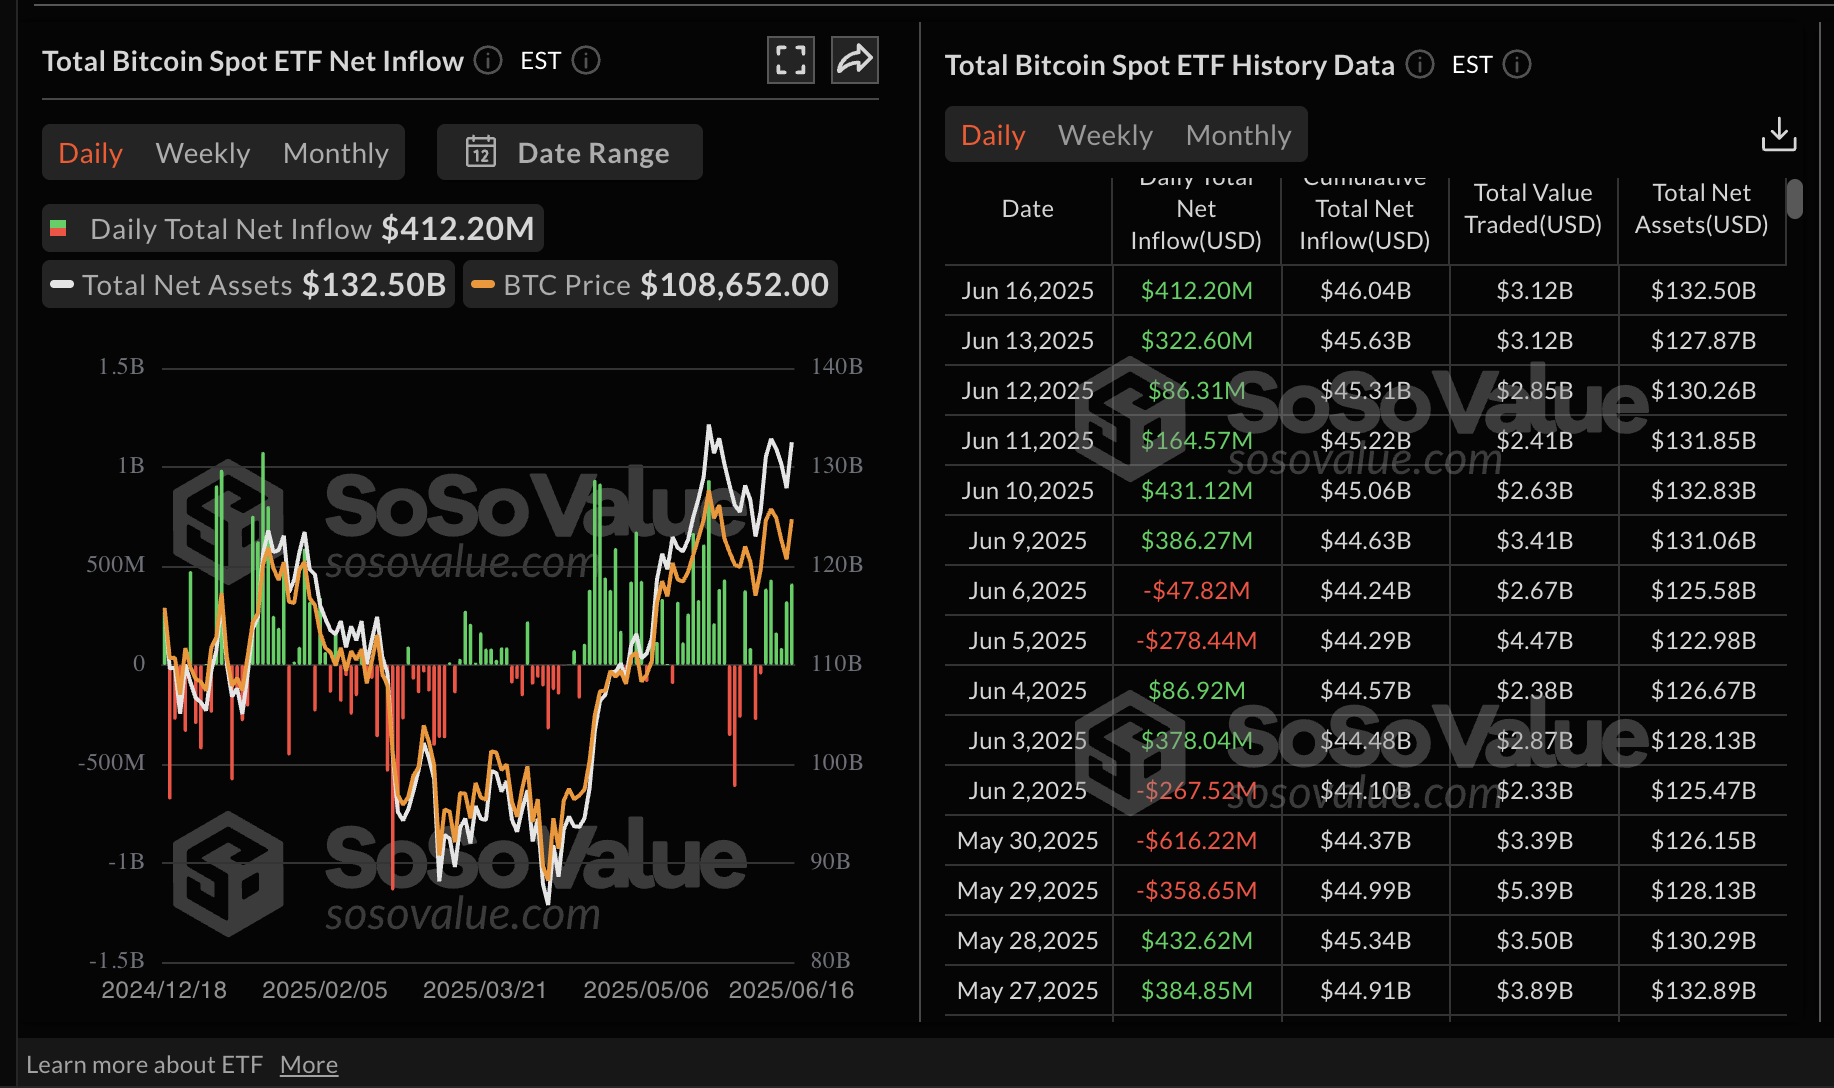
Bitcoin spot ETF inflows | Source: SoSoValue
Inflows into Ethereum spot ETFs resumed their bullish streak, with volume on Monday rising to $21 million after posting outflows totaling $2 million on Friday. BlackRock’s ETHA was the best-performing product with $16 million in net inflow, followed by Fidelity’s FETH with $5 million.
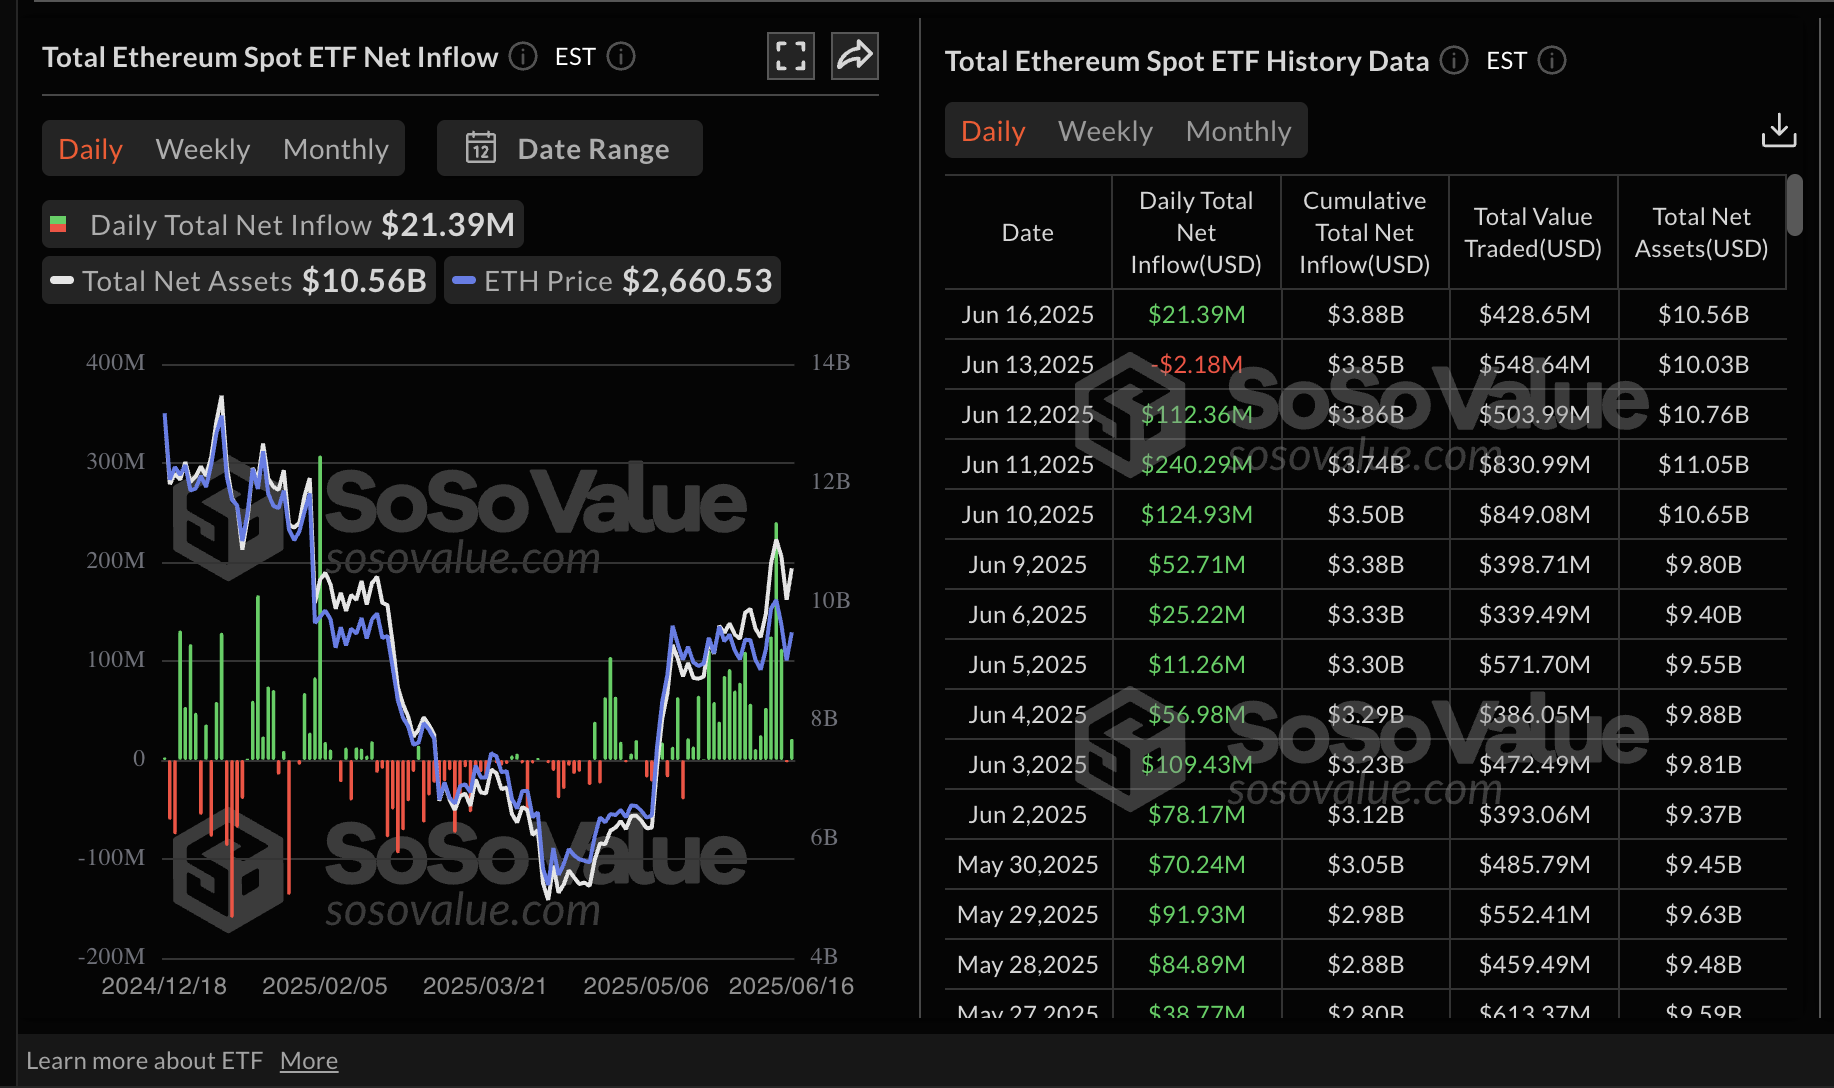
Ethereum spot ETF inflows | Source: SoSoValue
The resilience Bitcoin has exhibited since the onset of the Israel-Iran conflict on Friday can be attributed to steady interest as investors hedge against uncertainty in traditional markets.
At the same time, investors are likely awaiting the outcome of the Federal Reserve (Fed) meeting on Wednesday. While expectations lean firmly toward steady interest rates, Fed Chair Jerome Powell’s remarks could hint at the central bank’s policy direction.
Bitcoin’s price moves broadly sideways at around $106,300 at the time of writing after failing to gain momentum above resistance at $107,000 on Monday. Its technical structure, as observed from the daily chart below, shows an easing bullish bias.
The Moving Average Convergence Divergence (MACD) indicator sustained a sell signal confirmed on Thursday when the blue MACD line crossed below the red signal line. This signal often encourages traders to consider reducing exposure to Bitcoin, thereby building bearish momentum.
The Relative Strength Index (RSI) highlights the bearish bias as it slopes, approaching the 50 midline. Extended movement below this key neutral level could catalyze the downtrend, bringing the 50-day Exponential Moving Average (EMA) at $103,064, the 100-day EMA at $98,783, and the 200-day EMA at $93,083 into sight as tentative support targets.
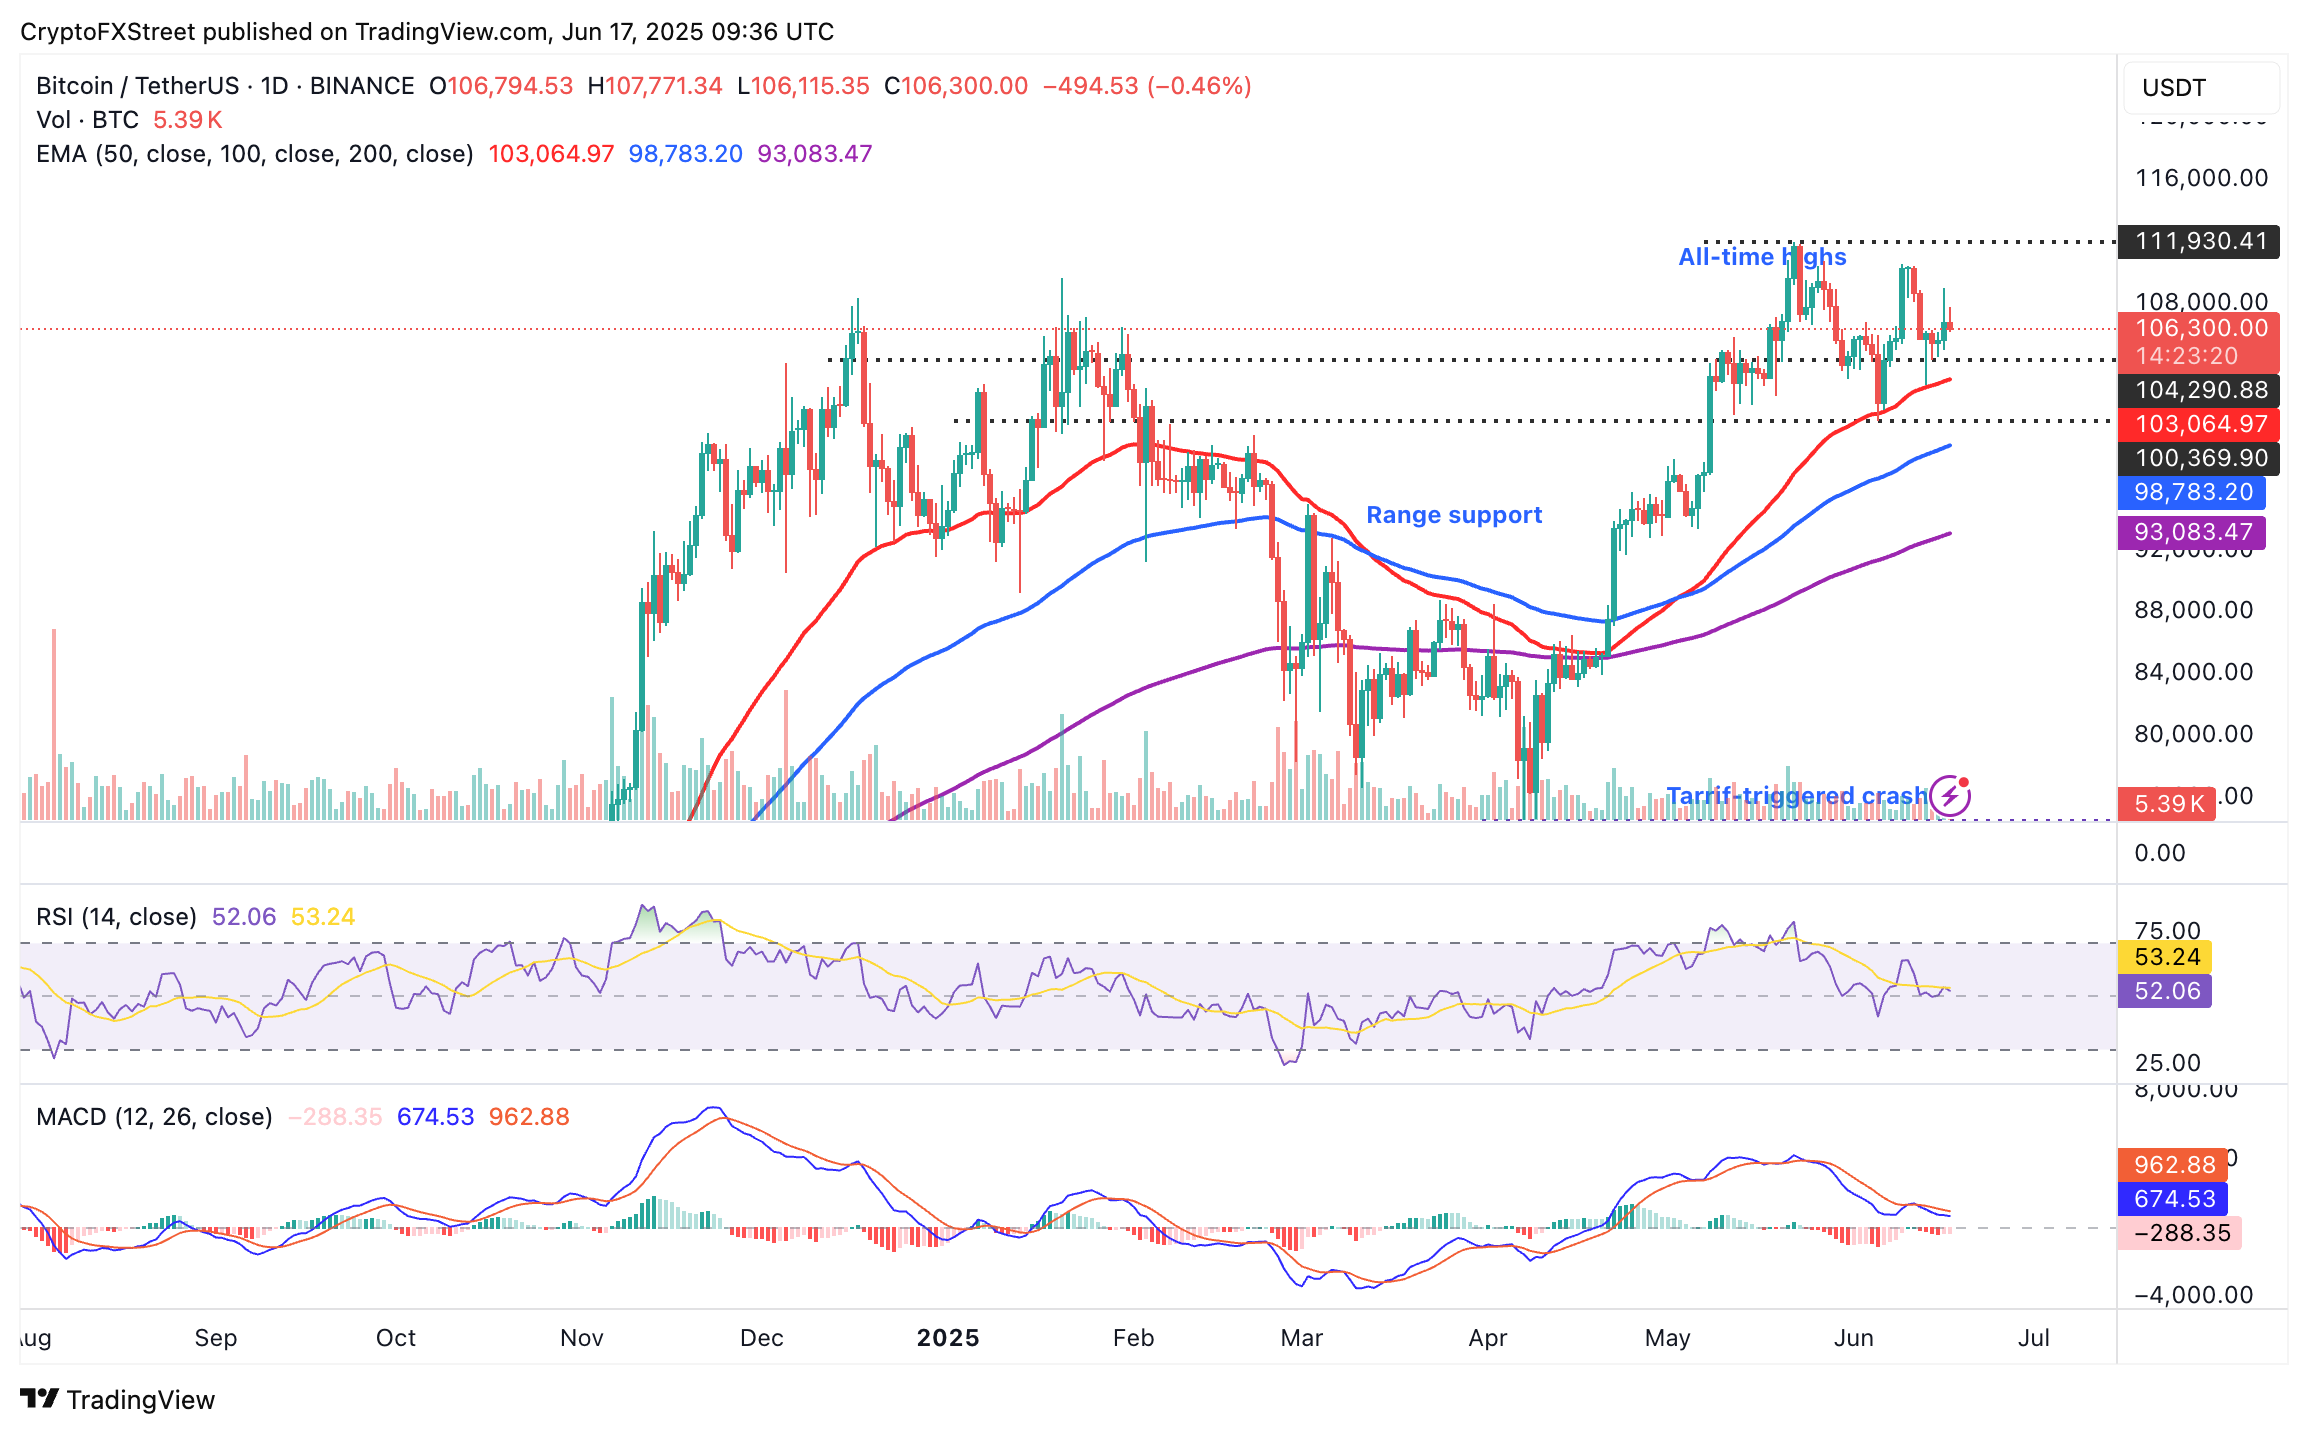
BTC/USDT daily chart
On the contrary, traders would monitor for a break above the $107,000 resistance for potential gains toward $110,000. Such a move would depend on sentiment around the Federal Open Market Committee (FOMC) meeting on Wednesday.
Ethereum’s price hovers at around $2,561 at the time of writing while holding above critical levels, including the 200-day EMA at $2,476, the 50-day EMA at $2,433 and the 100-day EMA at $2,366.
The RSI indicator offers signs of steadying above the midline after retreating from an overbought territory peak of 85 on May 10. This likely trend reversal would signal bullish momentum, whereby Ethereum’s price shoots toward resistance at $2,280 and $3,000. However, downside risks remain with a sell signal sustained by the MACD indicator since Wednesday.
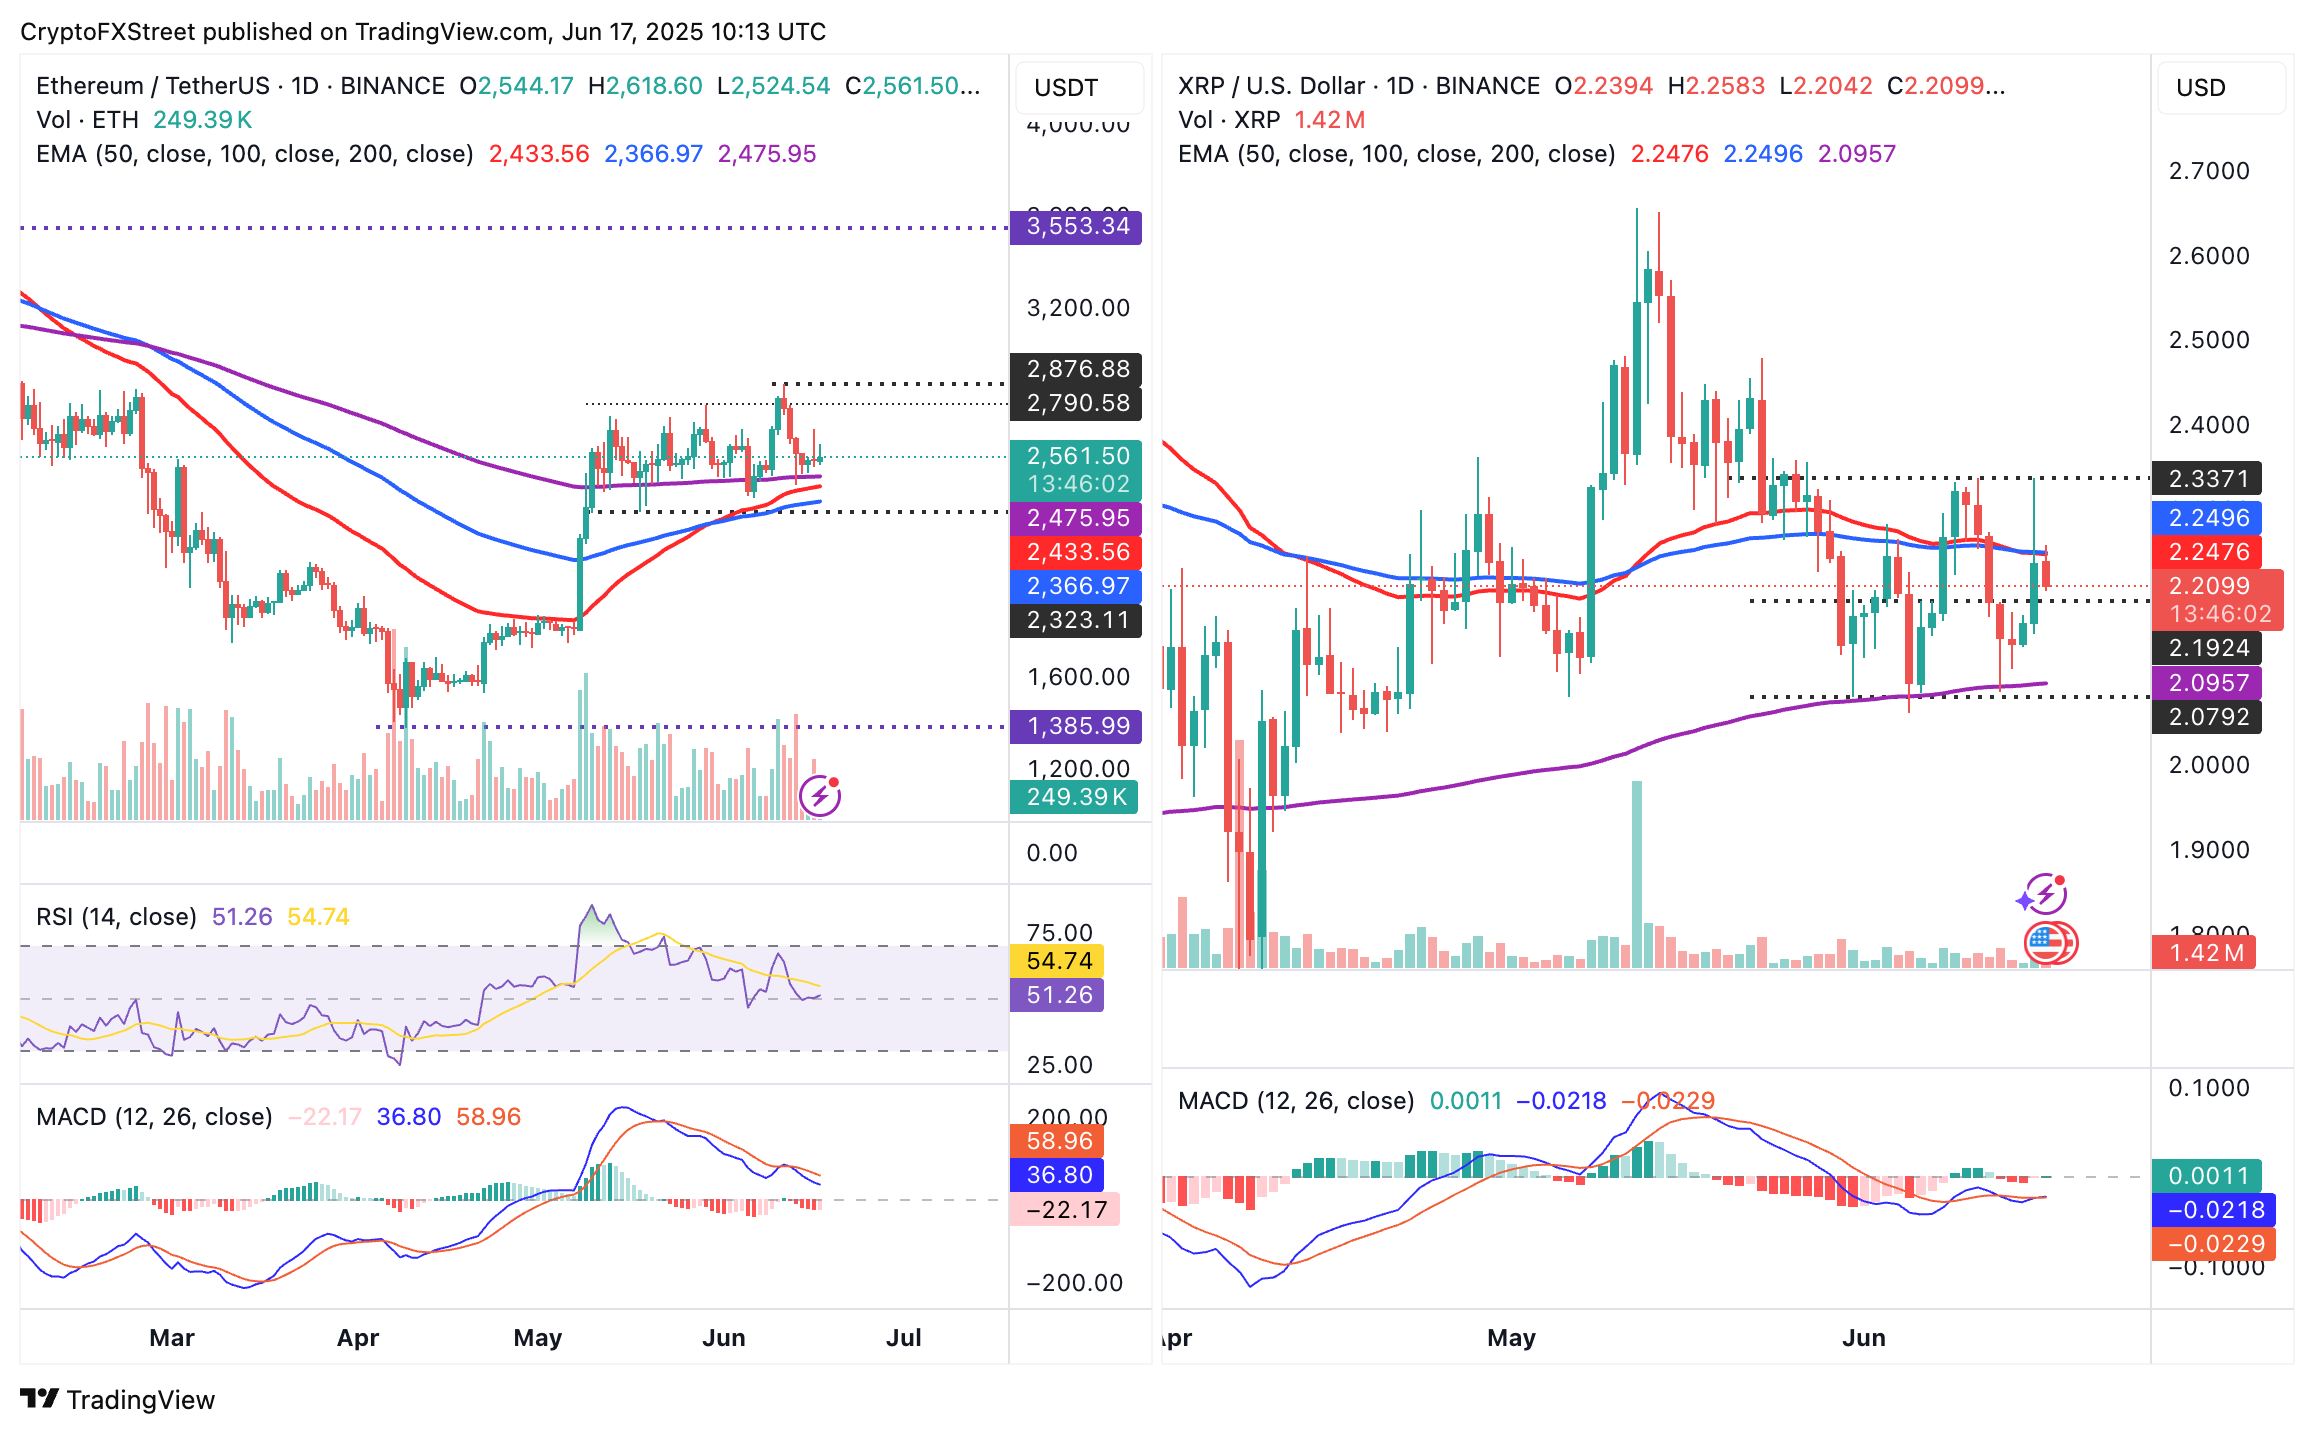
ETH/USDT & XRP/USDT daily charts
On the other hand, XRP’s price is currently trading at $2.20, down over 1% on the day at the time of writing. This follows a rejection from the confluence resistance established by the 50-day EMA and the 100-day EMA converging at around $2.24.
Beyond the demand area at $2.20, the 200-day EMA at $2.09 could absorb the selling pressure and prevent losses from extending below $2.00.
Token launches influence demand and adoption among market participants. Listings on crypto exchanges deepen the liquidity for an asset and add new participants to an asset’s network. This is typically bullish for a digital asset.
A hack is an event in which an attacker captures a large volume of the asset from a DeFi bridge or hot wallet of an exchange or any other crypto platform via exploits, bugs or other methods. The exploiter then transfers these tokens out of the exchange platforms to ultimately sell or swap the assets for other cryptocurrencies or stablecoins. Such events often involve an en masse panic triggering a sell-off in the affected assets.
Macroeconomic events like the US Federal Reserve’s decision on interest rates influence crypto assets mainly through the direct impact they have on the US Dollar. An increase in interest rate typically negatively influences Bitcoin and altcoin prices, and vice versa. If the US Dollar index declines, risk assets and associated leverage for trading gets cheaper, in turn driving crypto prices higher.
Halvings are typically considered bullish events as they slash the block reward in half for miners, constricting the supply of the asset. At consistent demand if the supply reduces, the asset’s price climbs.
Information on these pages contains forward-looking statements that involve risks and uncertainties. Markets and instruments profiled on this page are for informational purposes only and should not in any way come across as a recommendation to buy or sell in these assets. You should do your own thorough research before making any investment decisions. FXStreet does not in any way guarantee that this information is free from mistakes, errors, or material misstatements. It also does not guarantee that this information is of a timely nature. Investing in Open Markets involves a great deal of risk, including the loss of all or a portion of your investment, as well as emotional distress. All risks, losses and costs associated with investing, including total loss of principal, are your responsibility. The views and opinions expressed in this article are those of the authors and do not necessarily reflect the official policy or position of FXStreet nor its advertisers. The author will not be held responsible for information that is found at the end of links posted on this page.
If not otherwise explicitly mentioned in the body of the article, at the time of writing, the author has no position in any stock mentioned in this article and no business relationship with any company mentioned. The author has not received compensation for writing this article, other than from FXStreet.
FXStreet and the author do not provide personalized recommendations. The author makes no representations as to the accuracy, completeness, or suitability of this information. FXStreet and the author will not be liable for any errors, omissions or any losses, injuries or damages arising from this information and its display or use. Errors and omissions excepted.
The author and FXStreet are not registered investment advisors and nothing in this article is intended to be investment advice.
Search
RECENT PRESS RELEASES
Related Post


