Crypto Today: Bitcoin, Ethereum, XRP nudge higher as geopolitical tensions take a backseat
June 20, 2025
- Bitcoin bulls step up, pushing the price above $106,000, as Trump said he would delay his decision about launching strikes on Iran for up to two weeks.
- Ethereum rebounds from the 200-day EMA support at $2,477 amid steady interest in the derivatives market.
- XRP shows signs of a potential reversal heading into the weekend, underpinned by growing institutional interest.
A surprise bullish wave in the broader cryptocurrency market has seen prices edge higher on Friday, underscored by a spike in sentiment amid tensions in the Middle East. Major digital assets, including Bitcoin (BTC), Ethereum (ETH) and Ripple (XRP), are upholding a bullish outlook, offering signs of a prolonged trend reversal heading into the weekend.
Sentiment in the cryptocurrency market surged after United States (US) President Donald Trump, through his White House press secretary, announced a two-week delay in the decision on whether to launch attacks on Iran.
Meanwhile, key European leaders, including the foreign ministers of Britain, France, and Germany, are set to meet with Iranian Foreign Minister, Abbas Araqchi, in Geneva on Friday. The meeting, expected to be attended by the European Union (EU) foreign policy chief, will focus primarily on nuclear and regional issues.
Friday marks a week since the strikes between Israel and Iran began, which have seen global Crude Oil prices escalate, raising concerns about an economic slowdown in the face of tariffs and related deadlines in the US.
Interest from institutional investors has remained firm despite geopolitical tensions. This has been reflected in the steady inflows into US Exchange Traded Funds (ETFs). SoSoValue shows the total net inflow of spot BTC ETFs at almost $47 billion and net assets of $127 billion, accumulated since January 2024.
BlackRock’s IBIT is the most valuable spot ETF, with near $51 billion in net inflow volume and $71 million in net assets. Fidelity currently holds the second position with almost $12 billion in net inflow and $20 billion in net assets. Grayscale’s GBTC has stabilized at around $23 billion in net inflow volume and $19 billion in net assets after facing massive withdrawals.
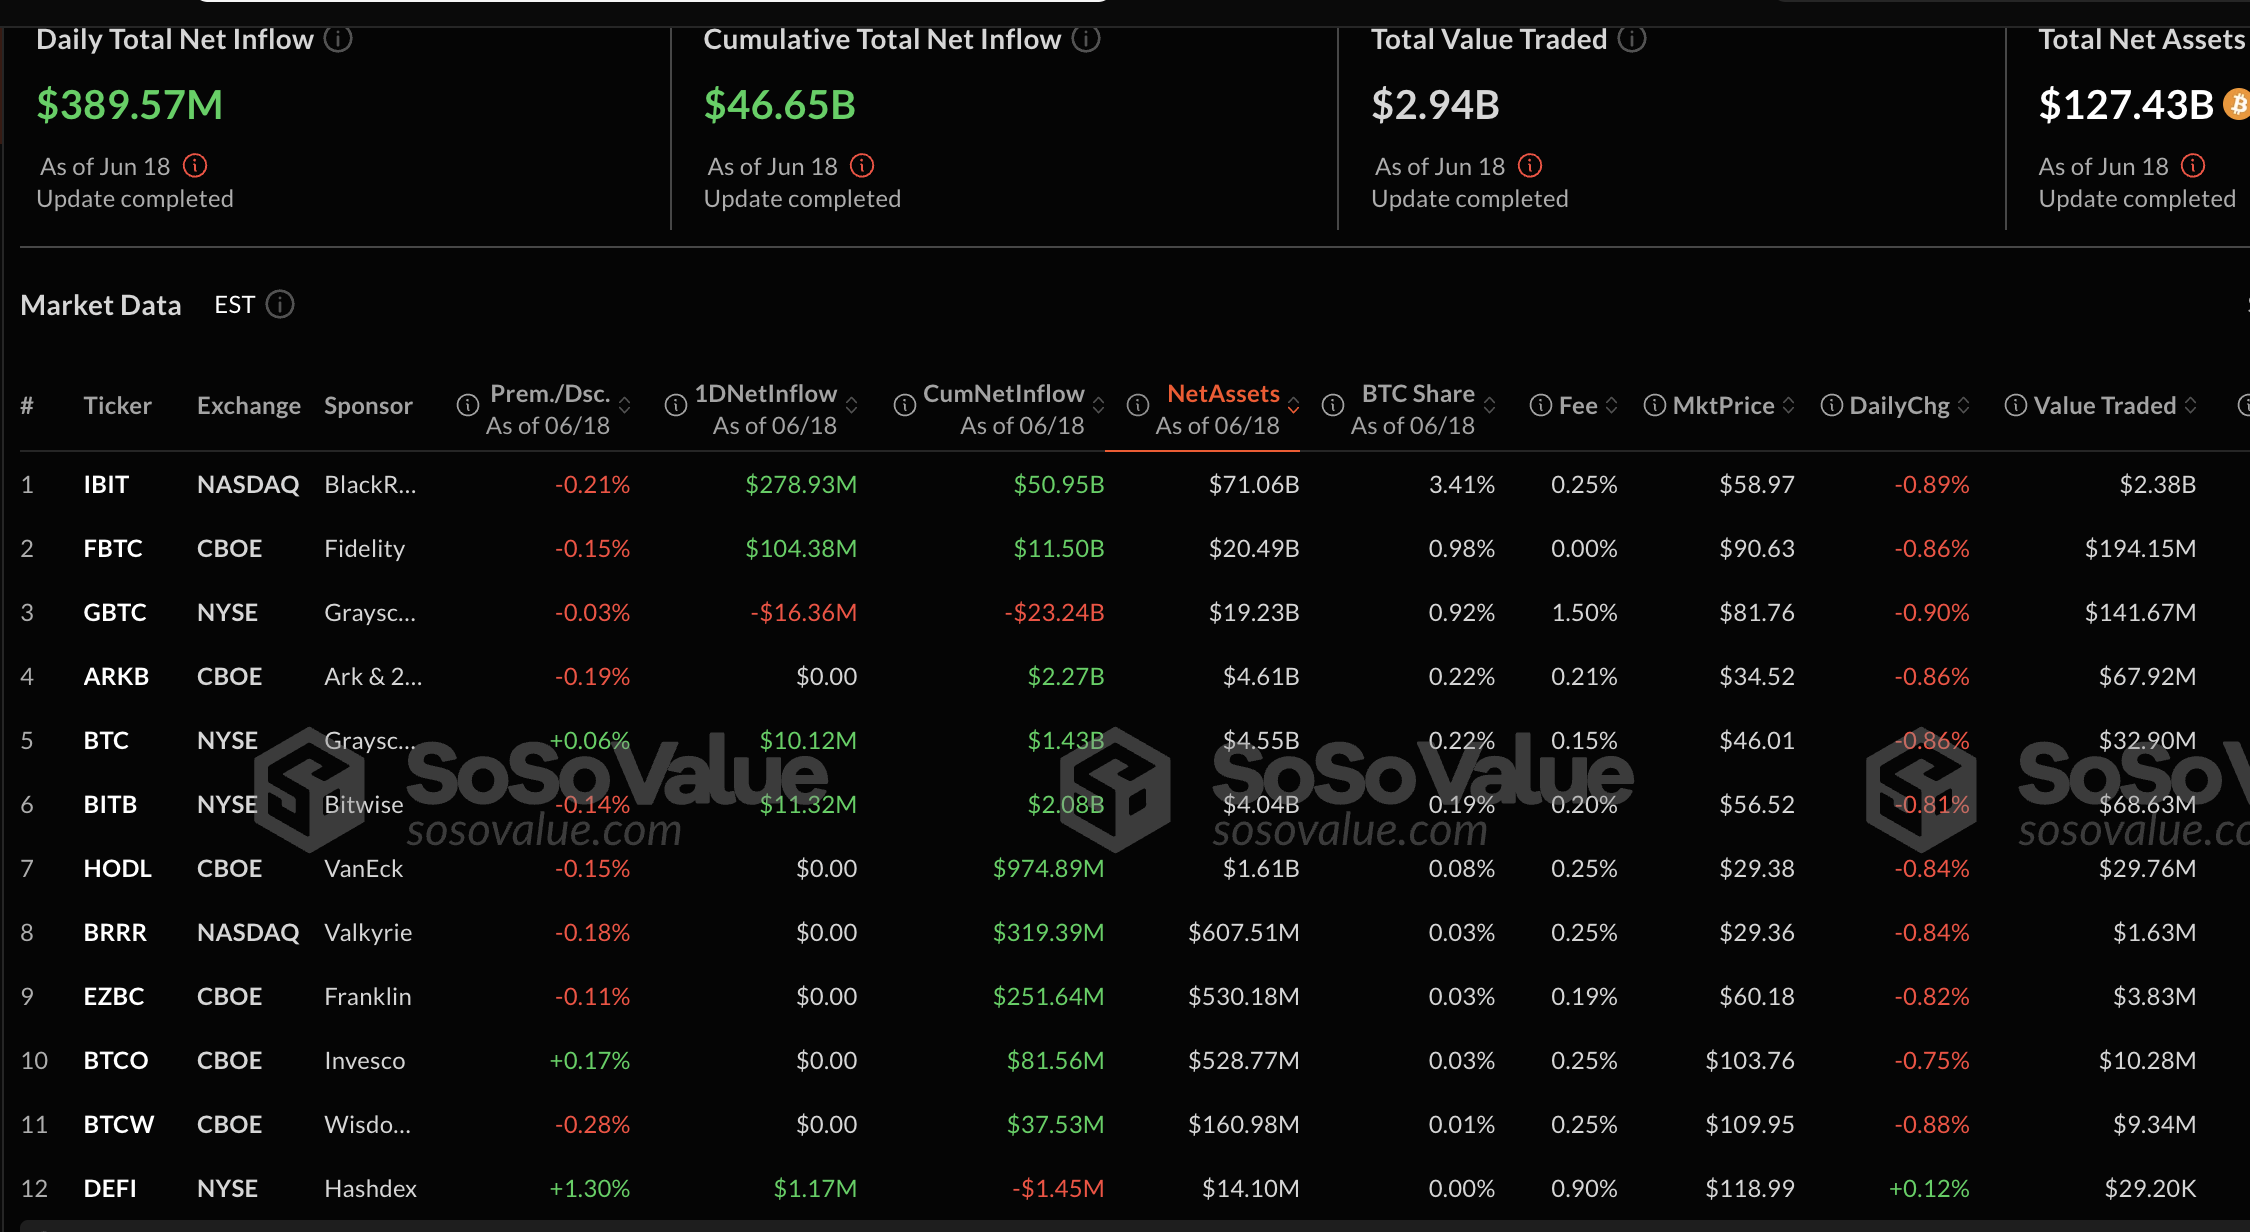
Bitcoin spot ETF stats | Source: SoSoValue
Inflows in Ethereum have also been steady over the last few weeks, sending the cumulative total to $3.9 billion. BlackRock’s ETHA ETF accounts for the lion’s share of the net cumulative inflows at $5 billion, followed closely by Fidelity’s FETH with $1.15 billion.
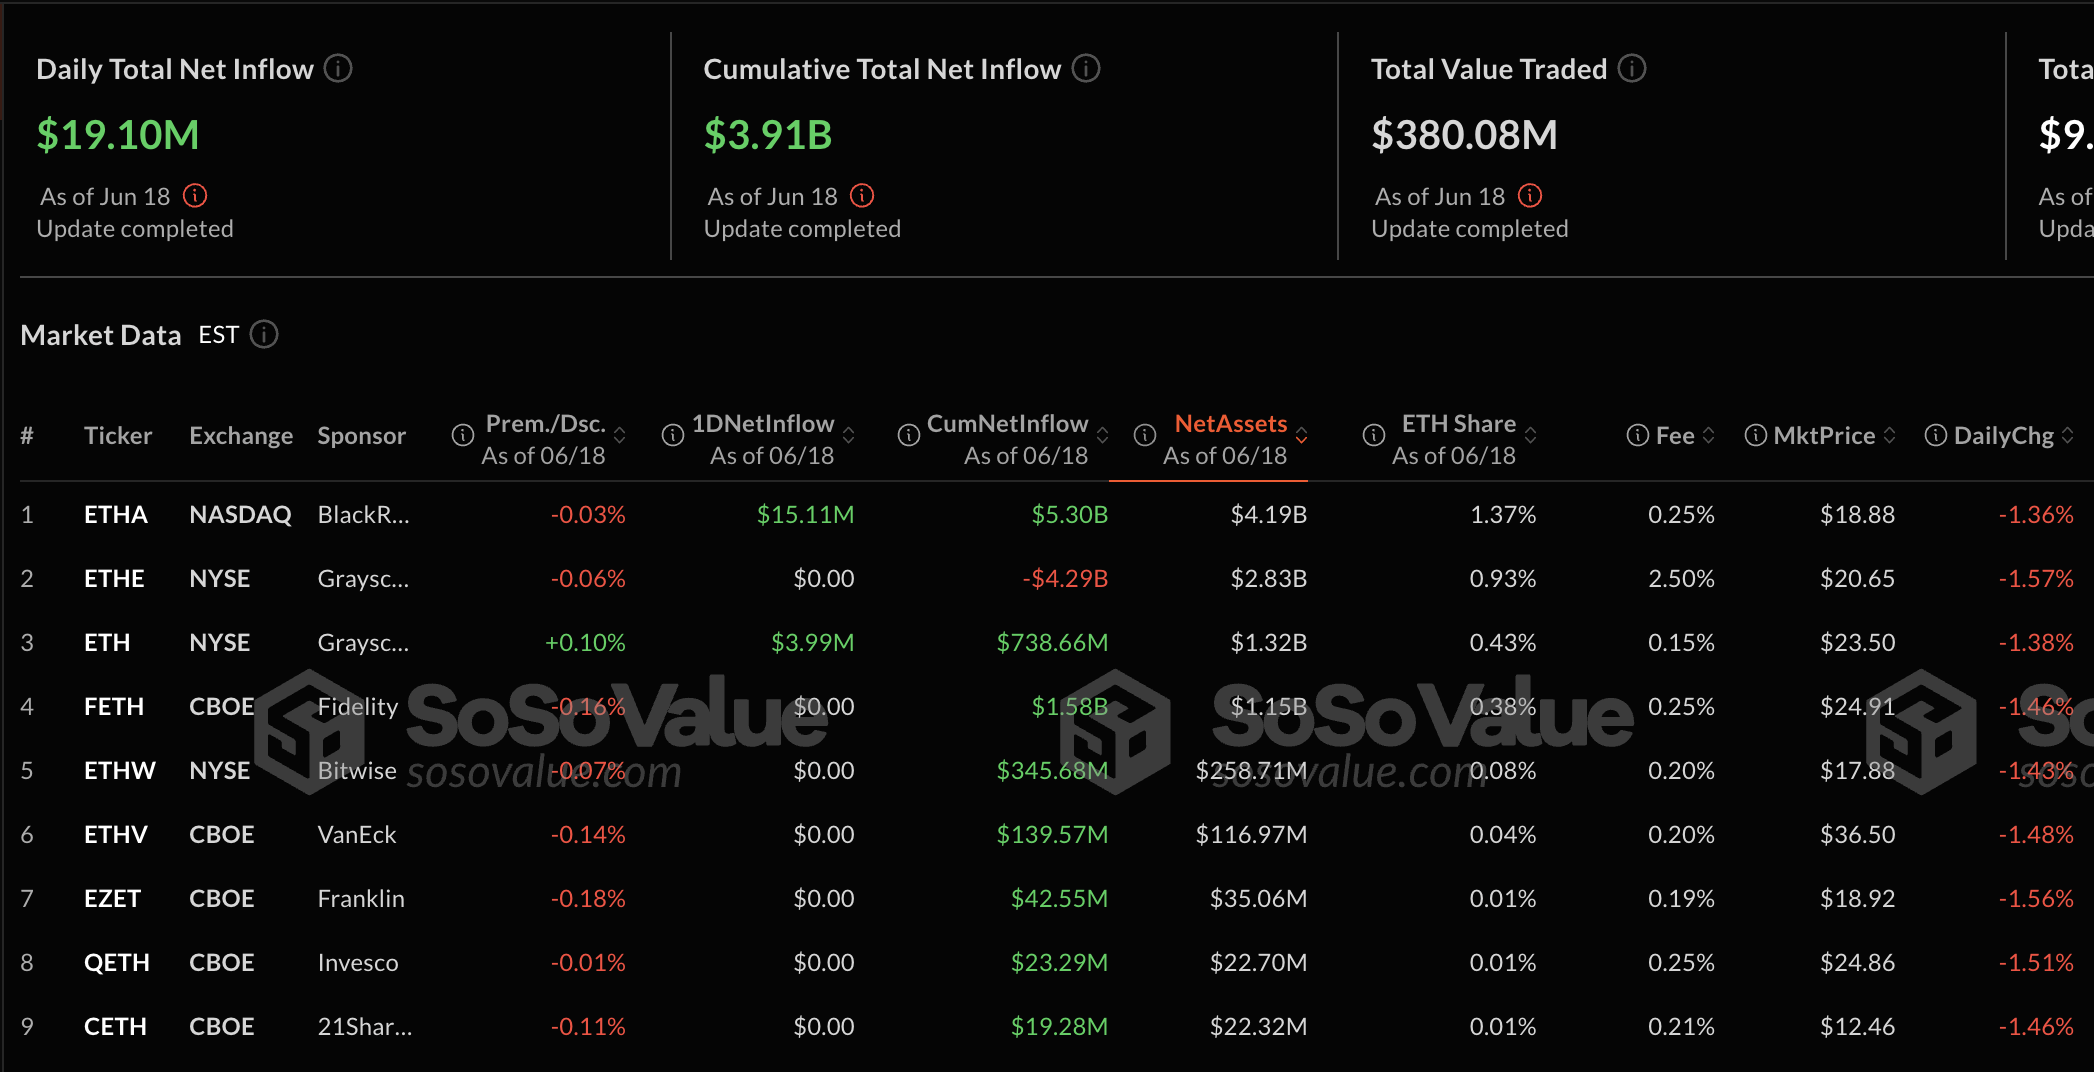
Ethereum spot ETF stats | Source: SoSoValue
An increase near 5% in the Ethereum derivatives market Open Interest (OI) to $37 billion over the last 24 hours reflects a slightly improving sentiment around US President Trump’s adamant stance on joining the Israel-Iran conflict. Liquidations of short positions edged higher on Friday, reaching $21 million over 24 hours compared to $10 million in longs.
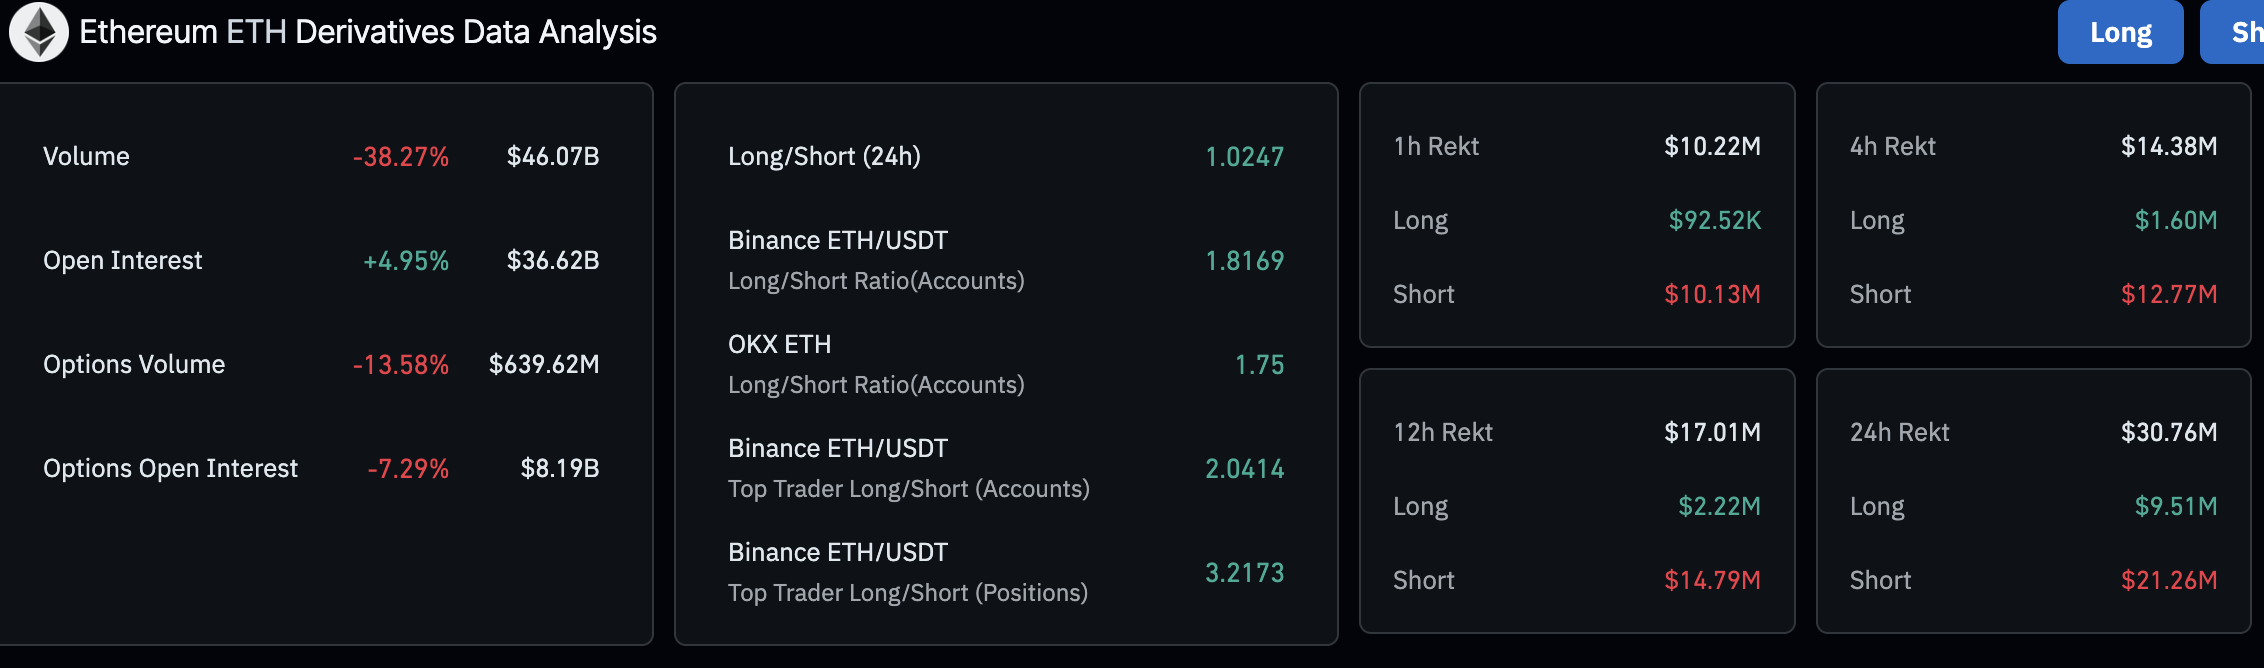
Ethereum derivatives OI | Source: CoinGlass
QCP Capital’s market update highlights a more cautious approach from investors, hinting at “risk reversals in BTC and ETH.”
“Price action remains muted despite rising macro uncertainty and the familiar din of political noise from Trump’s social media machine. Investor sentiment remains on pause, and positioning suggests that market participants are biding their time for a more decisive catalyst,” QCP Capital market update states.
The Bitcoin price shows signs of extending its recovery significantly above $106,000 at the time of writing, underpinned by support from the 50-day Exponential Moving Average (EMA) at $103,242.
The Relative Strength Index (RSI) reversal above the 50 midline underscores bullish momentum. A prolonged upside move toward overbought territory would increase the probability of a weekend rally targeting resistance at $107,624, which capped the price on Wednesday, the psychological whole number of $110,000 and the record high at around $110,982.
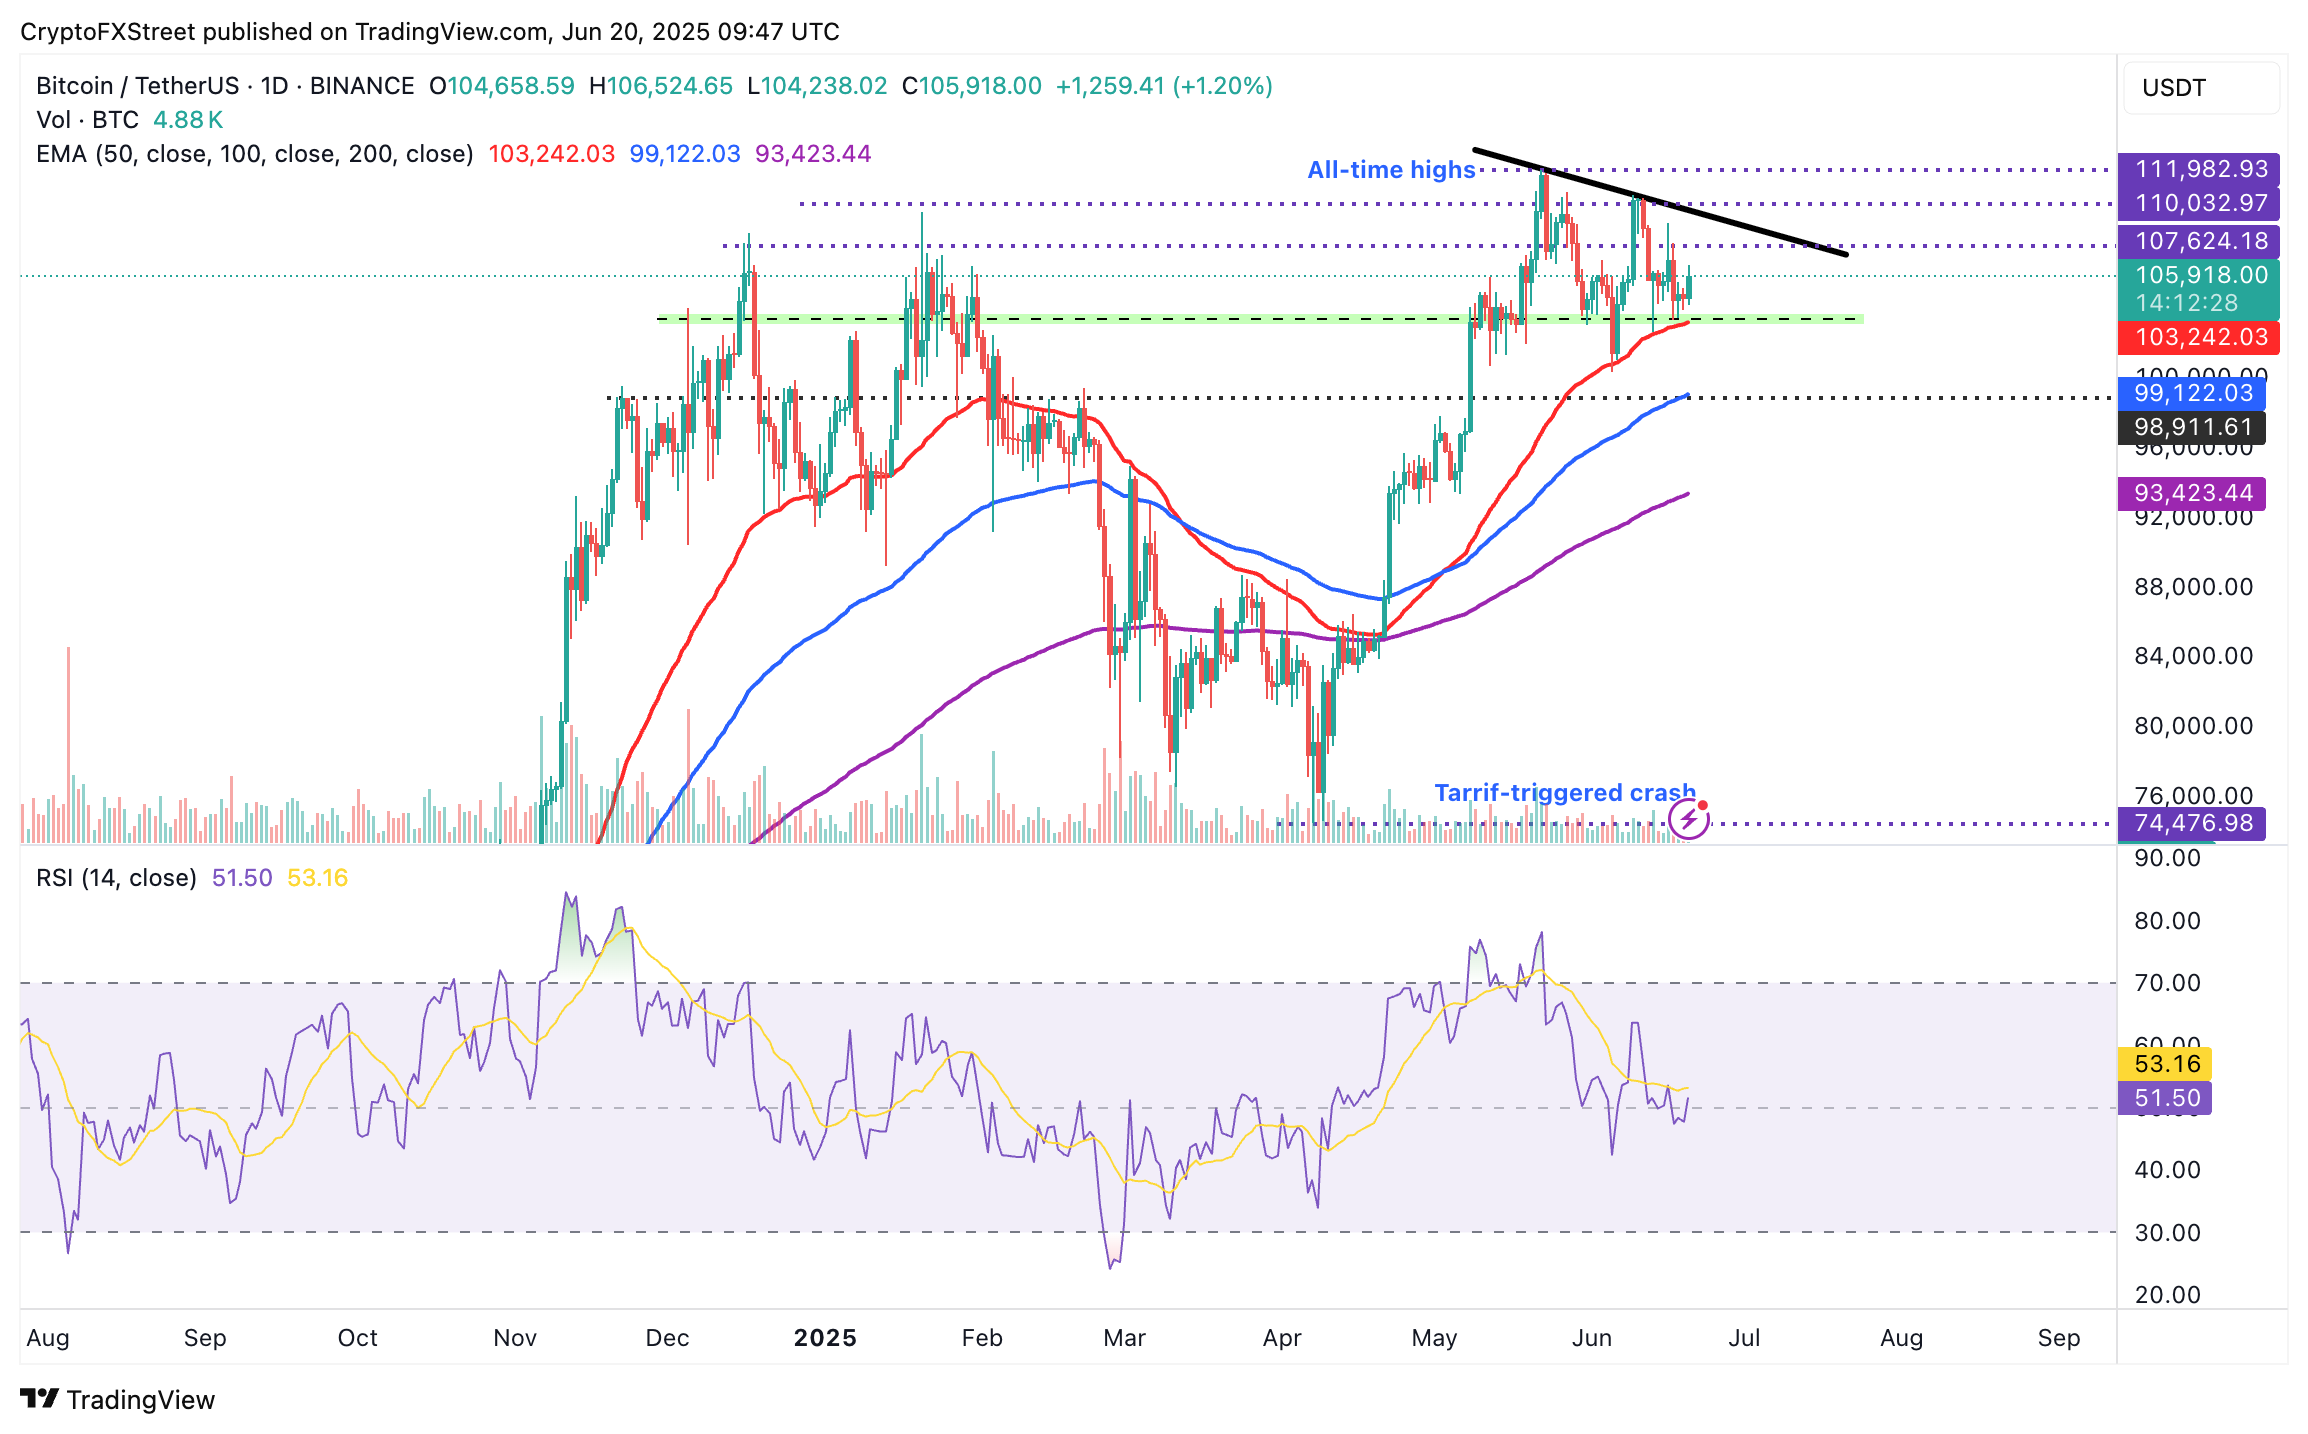
BTC/USD daily chart
The largest smart contracts token by market capitalization, Ethereum, is trading at $2,552 at the time of writing, up over 1% on the day. ETH’s price remains firmly above key levels, including the 200-day EMA support, currently at $2,477, the 50-day EMA at $2,443, and the 100-day EMA at $2,375.
The RSI above the midline supports the uptrend, with key areas of interest to traders, including $2,881, a resistance level tested on June 11, and $3,000, which was previously tested as support in November.
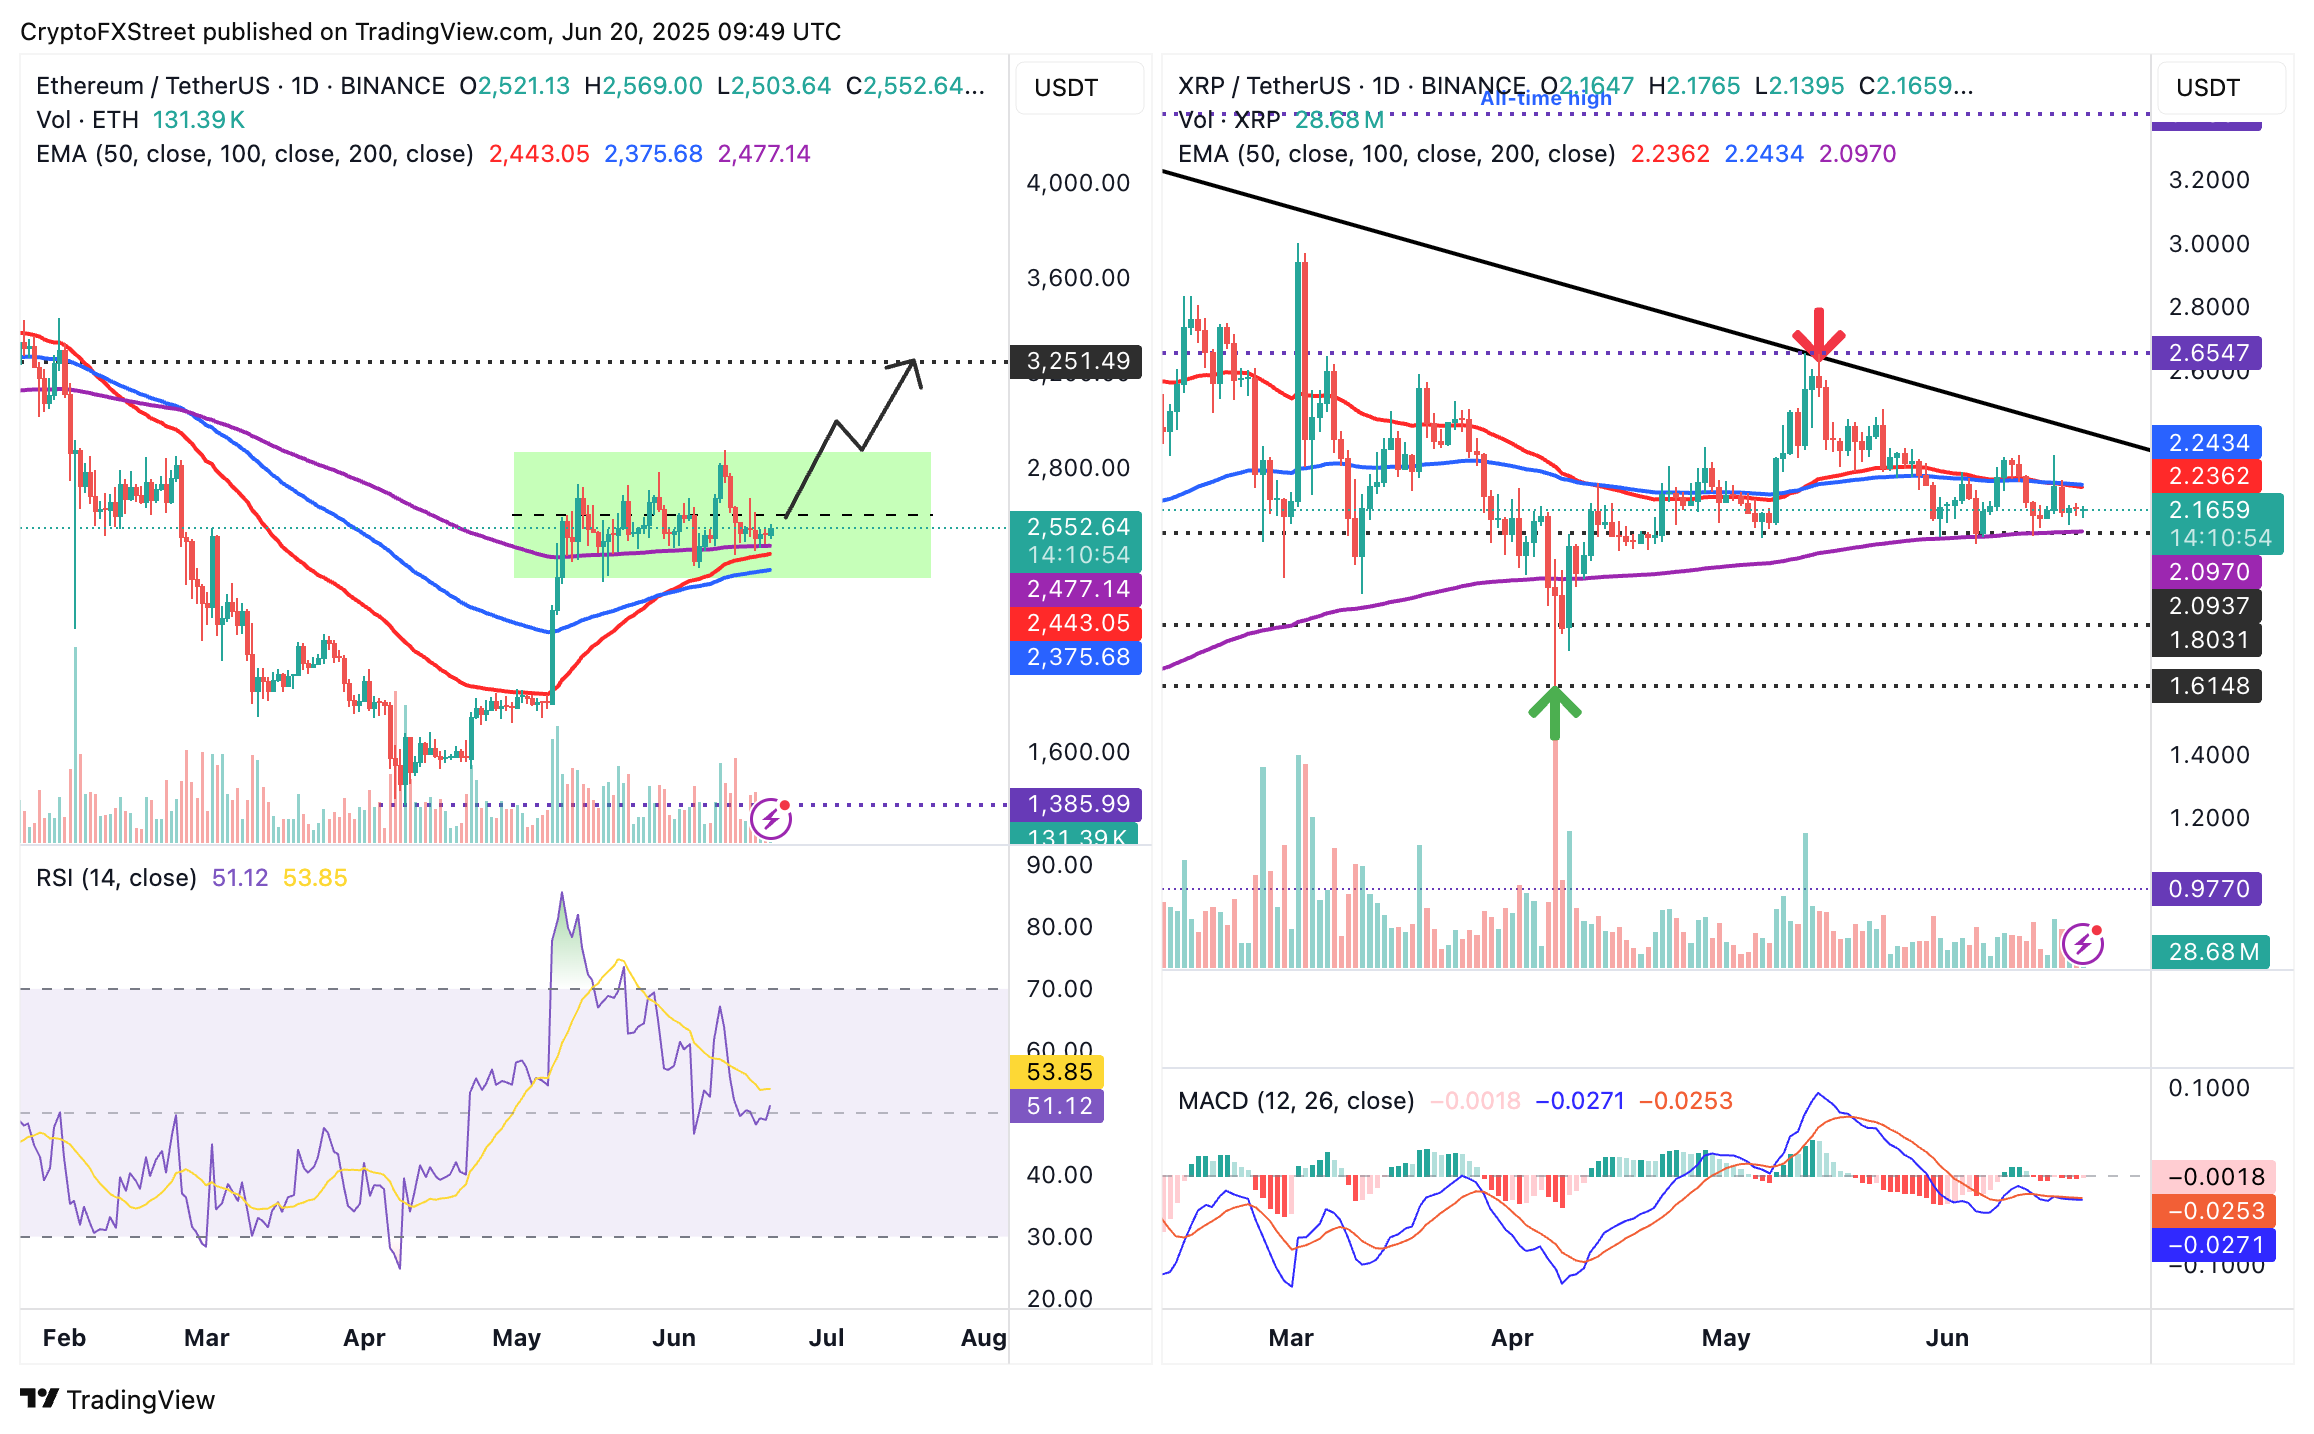
ETH/USDT daily & XRP/USDT daily charts
Sideways trading is taking center stage, with the price of XRP hovering at around $2.17 at the time of writing. XRP boasts robust support provided by the 200-day EMA at $2.09 but faces confluence resistance at $2.24, formed by the 50-day EMA and the 200-day EMA, which caps the upside movement.
A break on either side of the support and resistance would determine the direction of the trend. Sliding below the 200-day EMA at $2.09 could create instability and potentially increase the possibility of a breakdown under $2.00.
On the contrary, recovery beyond the $2.24 confluence level could boost XRP’s bullish odds and expand the scope to $2.65, a level previously tested in May as resistance and the seller congestion at $3.00, tested as support in early March.
Token launches influence demand and adoption among market participants. Listings on crypto exchanges deepen the liquidity for an asset and add new participants to an asset’s network. This is typically bullish for a digital asset.
A hack is an event in which an attacker captures a large volume of the asset from a DeFi bridge or hot wallet of an exchange or any other crypto platform via exploits, bugs or other methods. The exploiter then transfers these tokens out of the exchange platforms to ultimately sell or swap the assets for other cryptocurrencies or stablecoins. Such events often involve an en masse panic triggering a sell-off in the affected assets.
Macroeconomic events like the US Federal Reserve’s decision on interest rates influence crypto assets mainly through the direct impact they have on the US Dollar. An increase in interest rate typically negatively influences Bitcoin and altcoin prices, and vice versa. If the US Dollar index declines, risk assets and associated leverage for trading gets cheaper, in turn driving crypto prices higher.
Halvings are typically considered bullish events as they slash the block reward in half for miners, constricting the supply of the asset. At consistent demand if the supply reduces, the asset’s price climbs.
Information on these pages contains forward-looking statements that involve risks and uncertainties. Markets and instruments profiled on this page are for informational purposes only and should not in any way come across as a recommendation to buy or sell in these assets. You should do your own thorough research before making any investment decisions. FXStreet does not in any way guarantee that this information is free from mistakes, errors, or material misstatements. It also does not guarantee that this information is of a timely nature. Investing in Open Markets involves a great deal of risk, including the loss of all or a portion of your investment, as well as emotional distress. All risks, losses and costs associated with investing, including total loss of principal, are your responsibility. The views and opinions expressed in this article are those of the authors and do not necessarily reflect the official policy or position of FXStreet nor its advertisers. The author will not be held responsible for information that is found at the end of links posted on this page.
If not otherwise explicitly mentioned in the body of the article, at the time of writing, the author has no position in any stock mentioned in this article and no business relationship with any company mentioned. The author has not received compensation for writing this article, other than from FXStreet.
FXStreet and the author do not provide personalized recommendations. The author makes no representations as to the accuracy, completeness, or suitability of this information. FXStreet and the author will not be liable for any errors, omissions or any losses, injuries or damages arising from this information and its display or use. Errors and omissions excepted.
The author and FXStreet are not registered investment advisors and nothing in this article is intended to be investment advice.
Search
RECENT PRESS RELEASES
Related Post


