Crypto Today: Bitcoin resumes upward momentum eyeing all-time highs as Ethereum, XRP offer
July 2, 2025
- Bitcoin signals increasing bullish momentum, returning above $107,000 despite spot ETF outflows.
- Ethereum shows signs of a bullish reversal, targeting highs above $2,800 amid the ongoing ETH Community Conference in France.
- XRP is retesting the 50-day EMA resistance at $2.20 as bulls look forward to a technical breakout.
Bitcoin (BTC) resumes its bullish momentum after briefly declining to $105,100 on Wednesday. The largest cryptocurrency by market capitalization is trading at around $107,665 at the time of writing, up nearly 2% on the day.
Despite a lull in sentiment in the broader market this week, characterized by low trading volumes and volatility, leading altcoins Ethereum (ETH) and Ripple (XRP) show signs of resuming their uptrend and sustaining the gains accrued in July.
“Markets have entered a lull with trading volumes at 9-month lows and volatility hitting 21-month lows, signaling a potential summer slowdown despite an active July ahead,” K33 Research highlighted in the latest report.
The United States (US) Securities and Exchange Commission (SEC) has approved Grayscale’s proposal to convert its Digital Large-Cap Fund comprised of five coins, including Bitcoin, Ethereum, XRP, Solana (SOL) and Cardano (ADA), into an Exchange Traded Fund (ETF).
Grayscale intends to provide investors with access to the weighted prices of the underlying assets through its crypto ETF.
On the other hand, the SEC is considering streamlining the listing process for crypto ETFs by reducing the time and complexity involved in introducing new products to the market.
Bloomberg analysts Eric Balchunas and James Seyffart revised the odds of approval for various spot ETFs, including XRP, SOL, and Litecoin (LTC), to 95% by year-end.
Bitcoin spot ETFs broke a 15-day daily net inflow streak with approximately $342 million in outflows on Tuesday. None of the 12 spot ETFs currently approved saw inflows, with Fidelity’s FBTC leading with outflows of nearly $173 million.
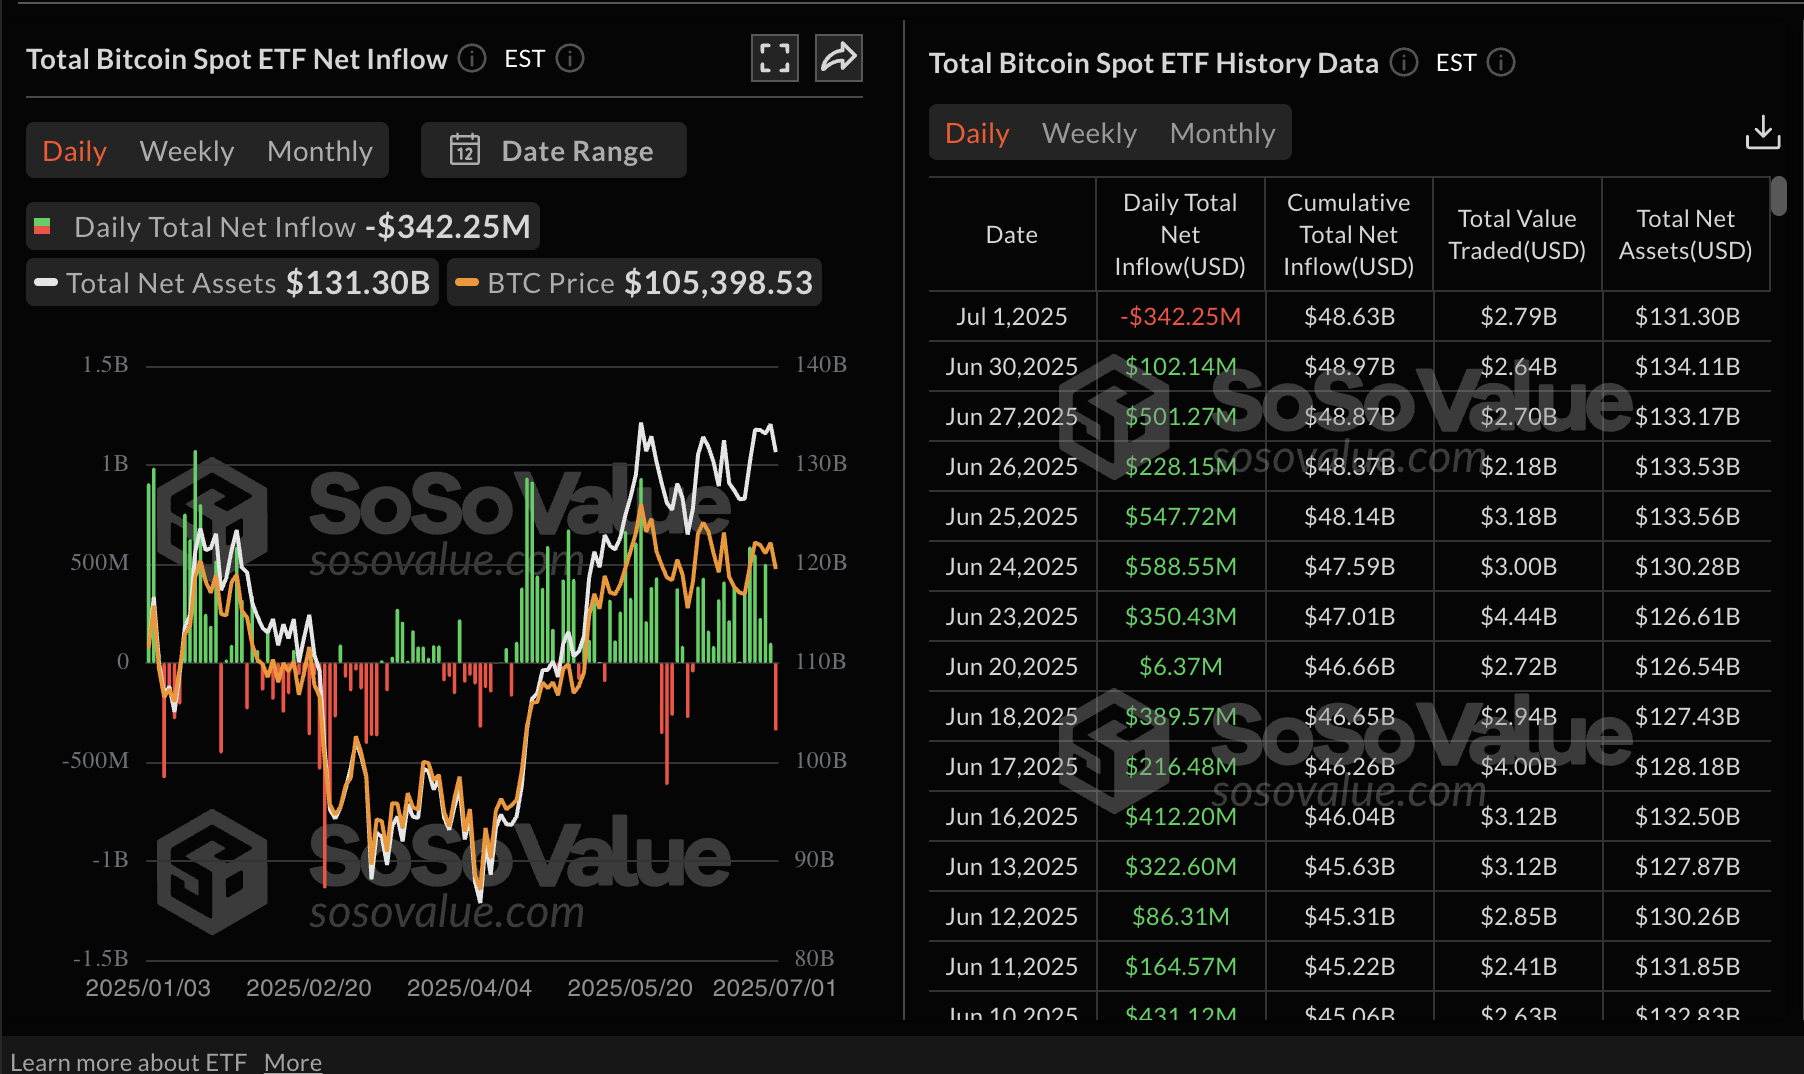
Bitcoin spot ETF data | Source: SoSoValue
On the contrary, Ethereum spot ETFs extended their three-day bullish streak with about $41 million in net inflow volume. The ETFs boast $4.25 billion in cumulative total net inflow, while net assets stand at $9.95 billion.
Interest in Ethereum seems steady amid the ongoing ETH Community Conference (EthCC) in France. This is the largest annual European Ethereum event, tailored to the community and technology.
Over 6,400 people are attending the 4-day conference this year, according to the event’s official website, featuring more than 500 speakers.
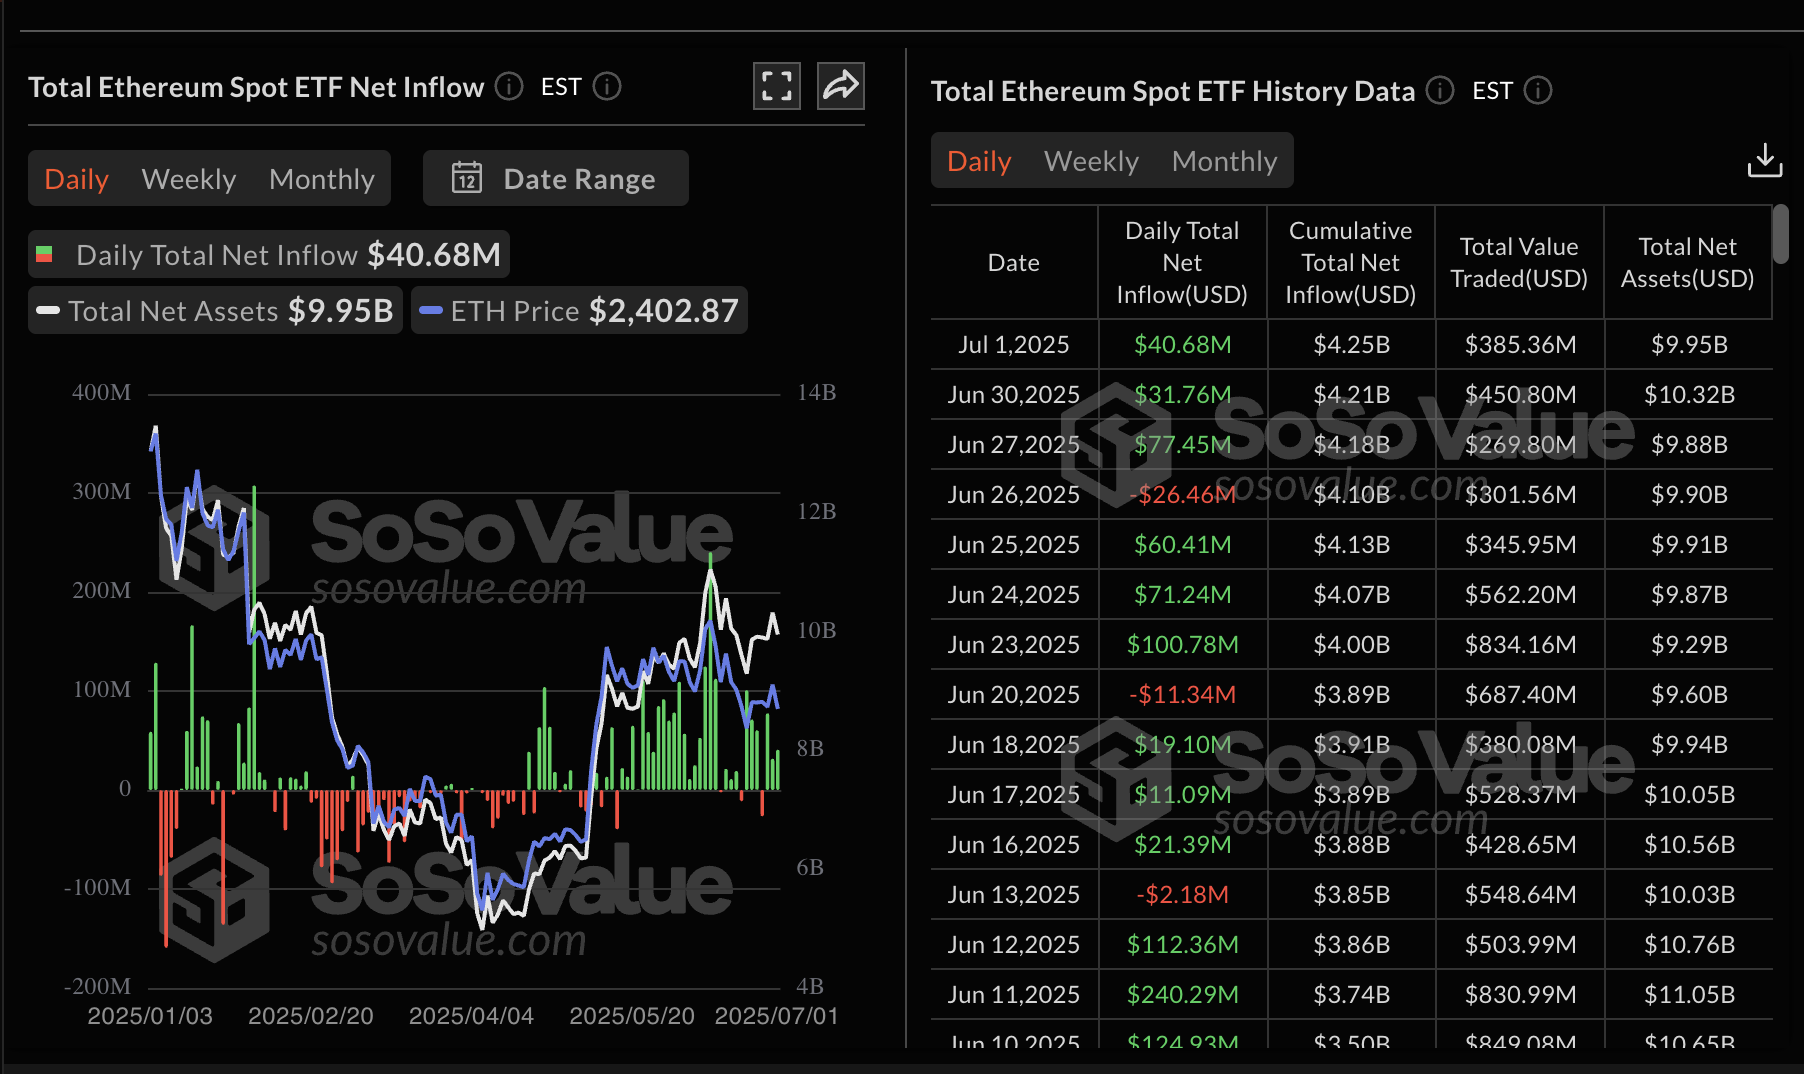
Ethereum spot ETF data | Source: SoSoValue
Bitcoin’s price changed course on Wednesday, paving the way for a break above the $107,000 mark. This recovery shows signs of extending, backed by an upward-facing Relative Strength Index (RSI) and a bullish Money Flow Index (MFI) indicator.
Traders should look out for a daily close above $107,000 to validate the uptrend’s strength, with movement above $108,000 likely to boost risk-on sentiment for a breakout beyond the $110,530 high tested on June 9.
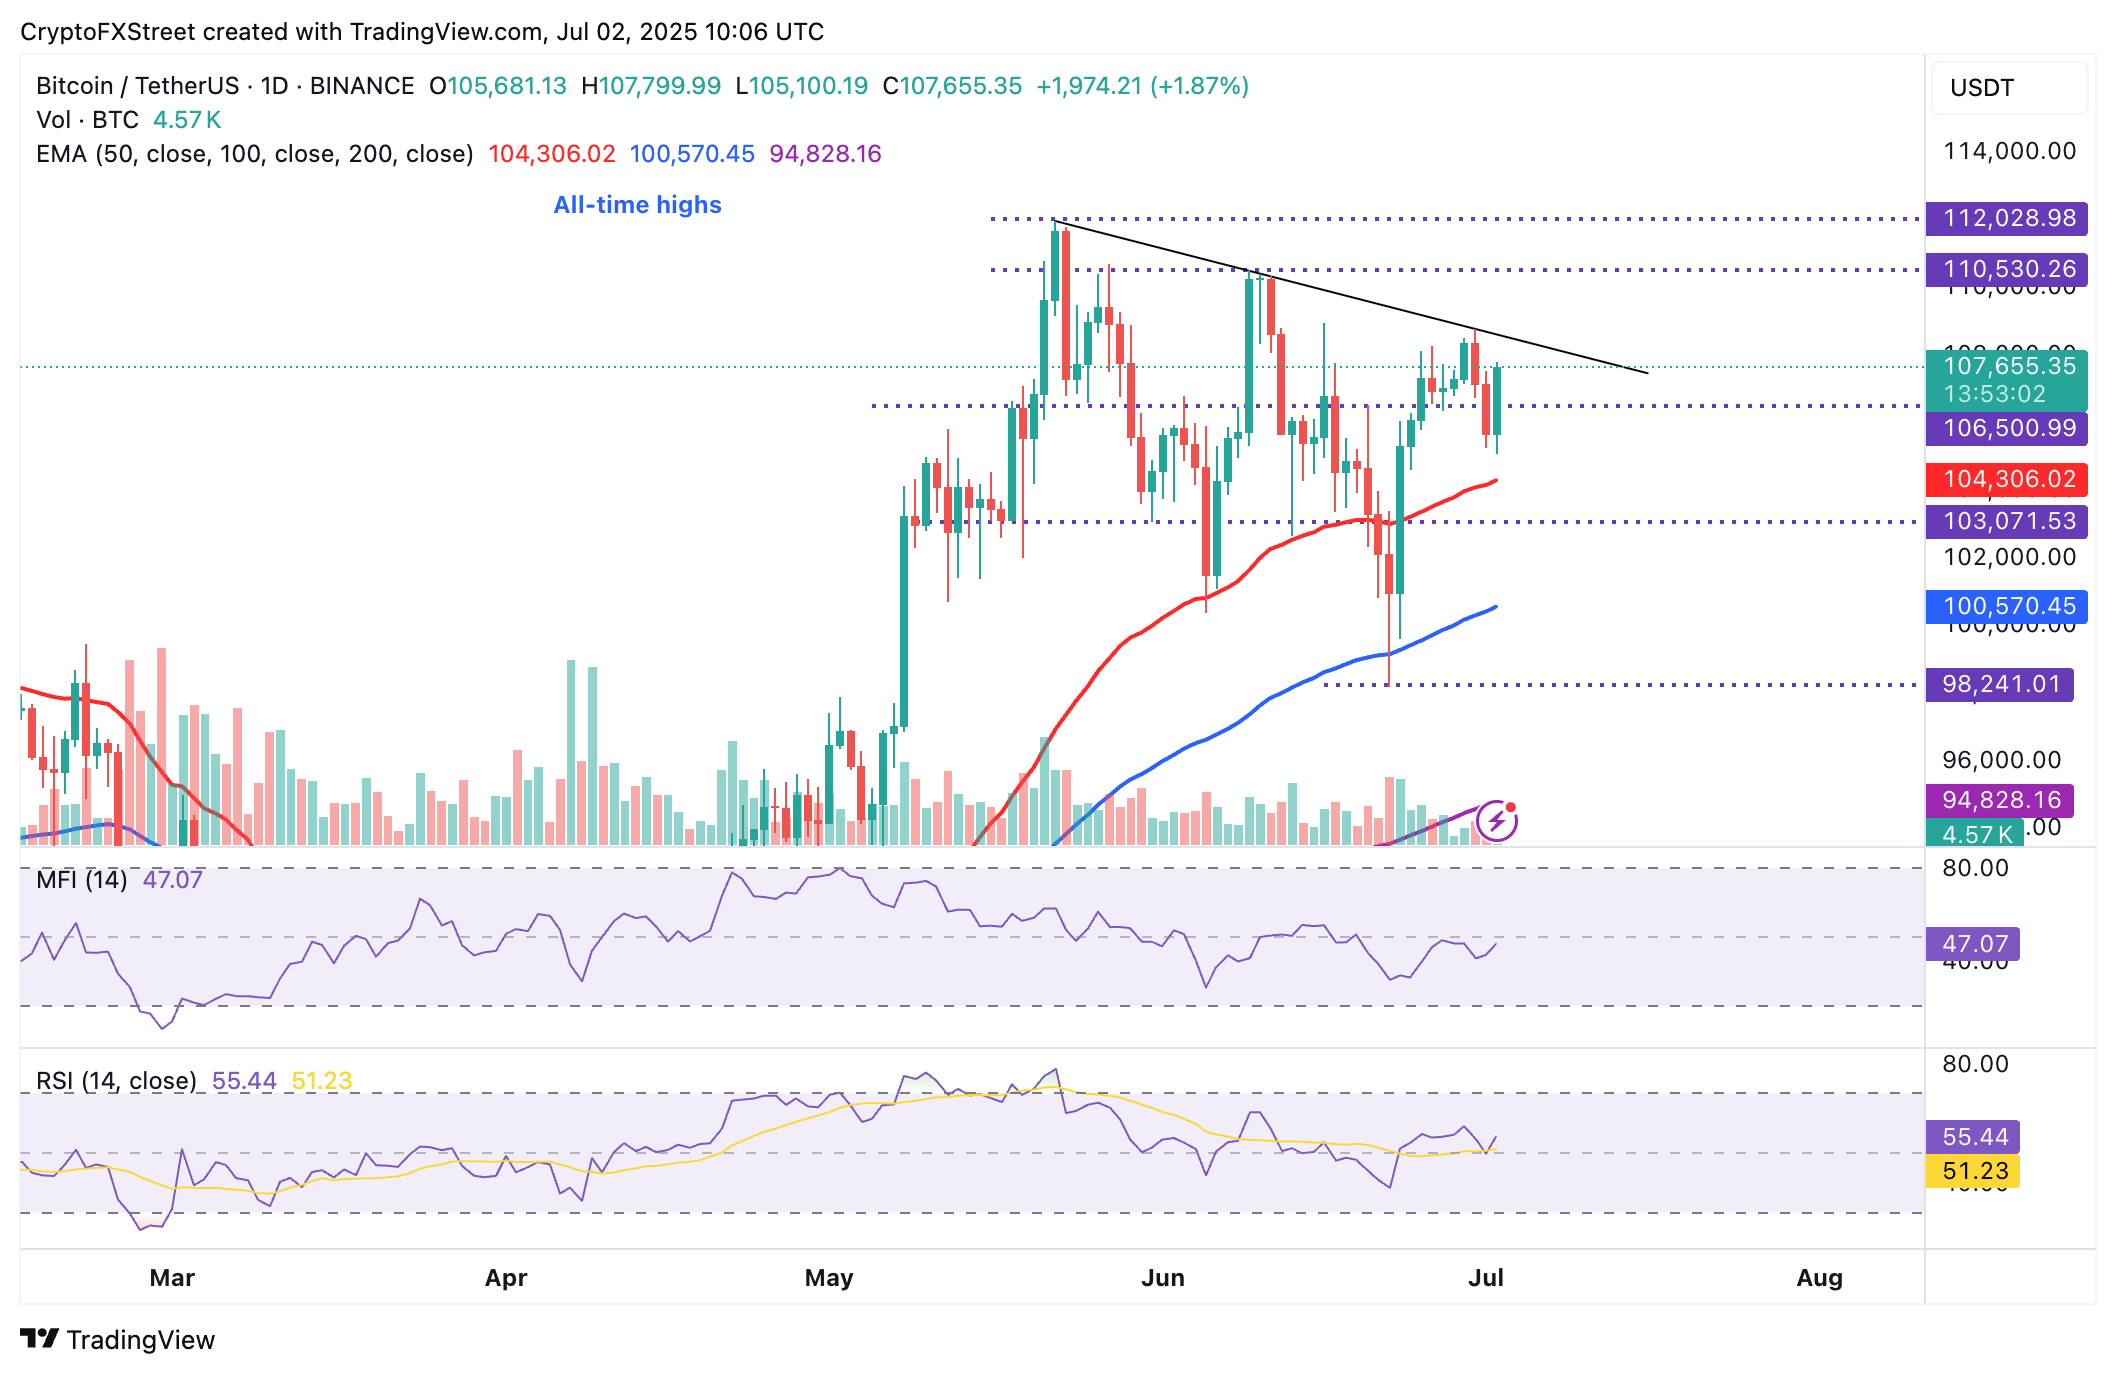
BTC/USDT daily chart
While the return above $107,000 is remarkable, traders should tread carefully and temper their bullish expectations, considering that most investors are now back in profit.
“Following a recovery to $107,000, a super-majority of Bitcoin investors are now holding unrealized profits. In total, the unrealized profit held across investors sits at a staggering $1.2 trillion,” Glassnode said in a report released on Tuesday.
If a reversal occurs, key levels will stand out, including the support tested on Wednesday at $105,100, the 50-day Exponential Moving Average (EMA) currently at $104,306 and the 100-day EMA at $100,570.
Ethereum is printing a green candle on the daily chart after rebounding from support provided by the 100-day EMA at around $2,381. The largest smart contracts token by market capitalization hovers at $2,449, up almost 2% on the day. This intraday uptick can be attributed to improving market sentiment, with the MFI indicator approaching the midline.
The MFI is a tool that tracks the amount of money entering Ethereum. It can be used to gauge the level of demand for ETH, thus backing the direction of the trend. Moreover, the RSI is pointing upward near the midline, indicating bullish momentum could resume soon.
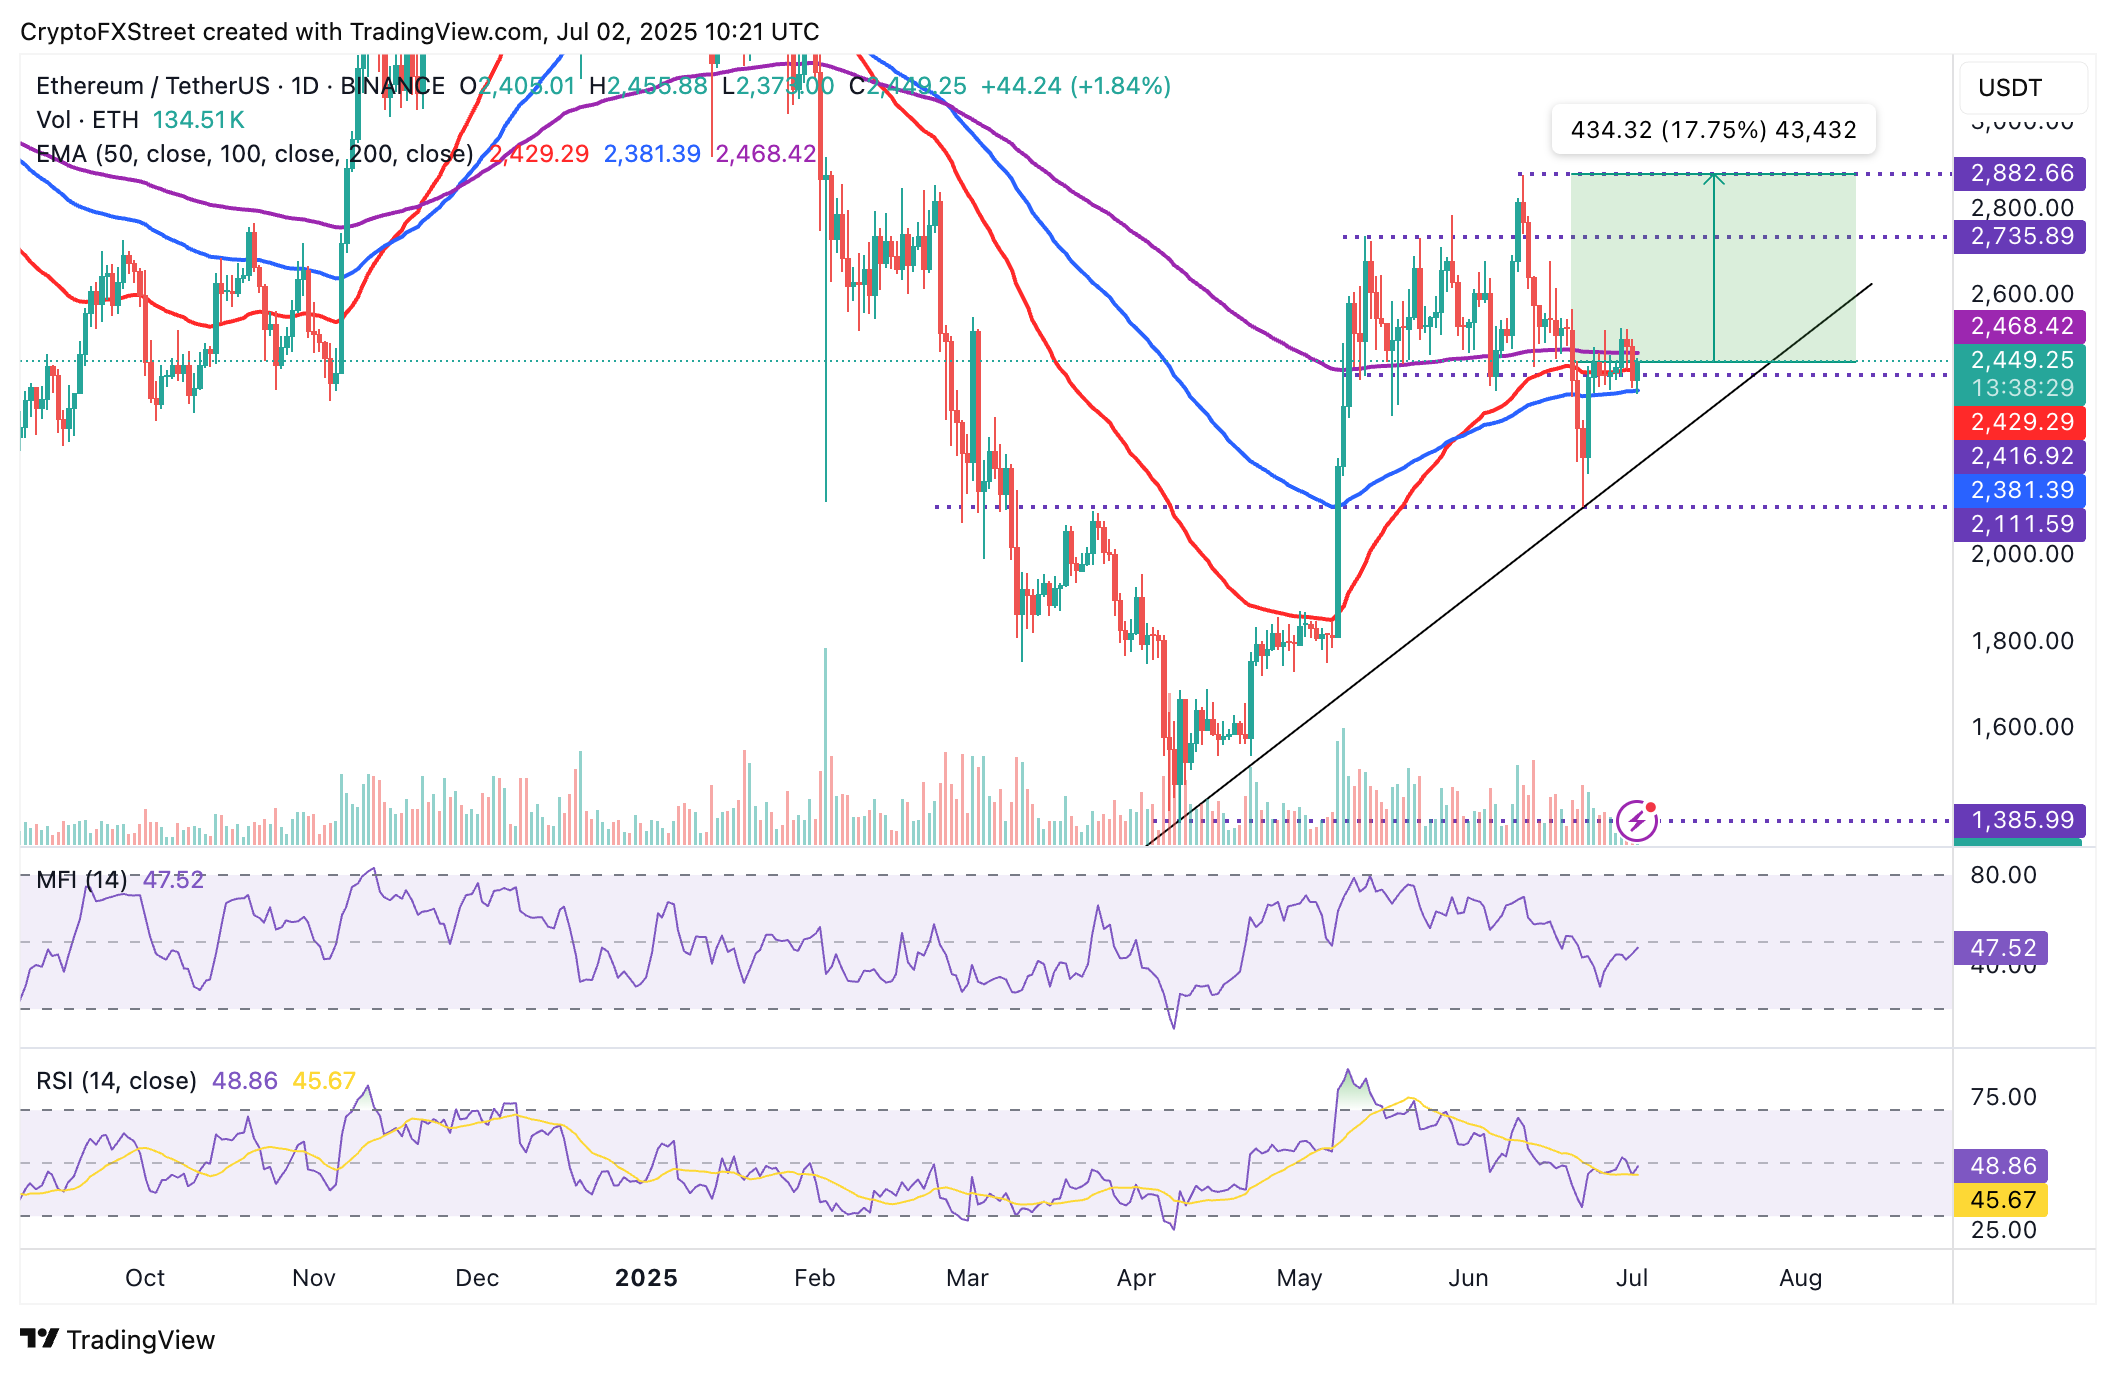
ETH/USDT daily chart
A break above the immediate resistance, as reflected by the 200-day EMA at $2,468, could affirm the bullish grip. If bulls sustain gains above this level, an 18% move to June’s peak of $2,882 would be highly probable.
As for XRP, sideways movement is taking center stage. However, bulls have the upper hand, with gains exceeding 0.5% on the day. XRP is trading at around $2.18 as bulls attempt to break through a critical resistance level, highlighted by the 50-day EMA at approximately $2.20. The 100-day EMA is currently positioned slightly above this level at $2.22.
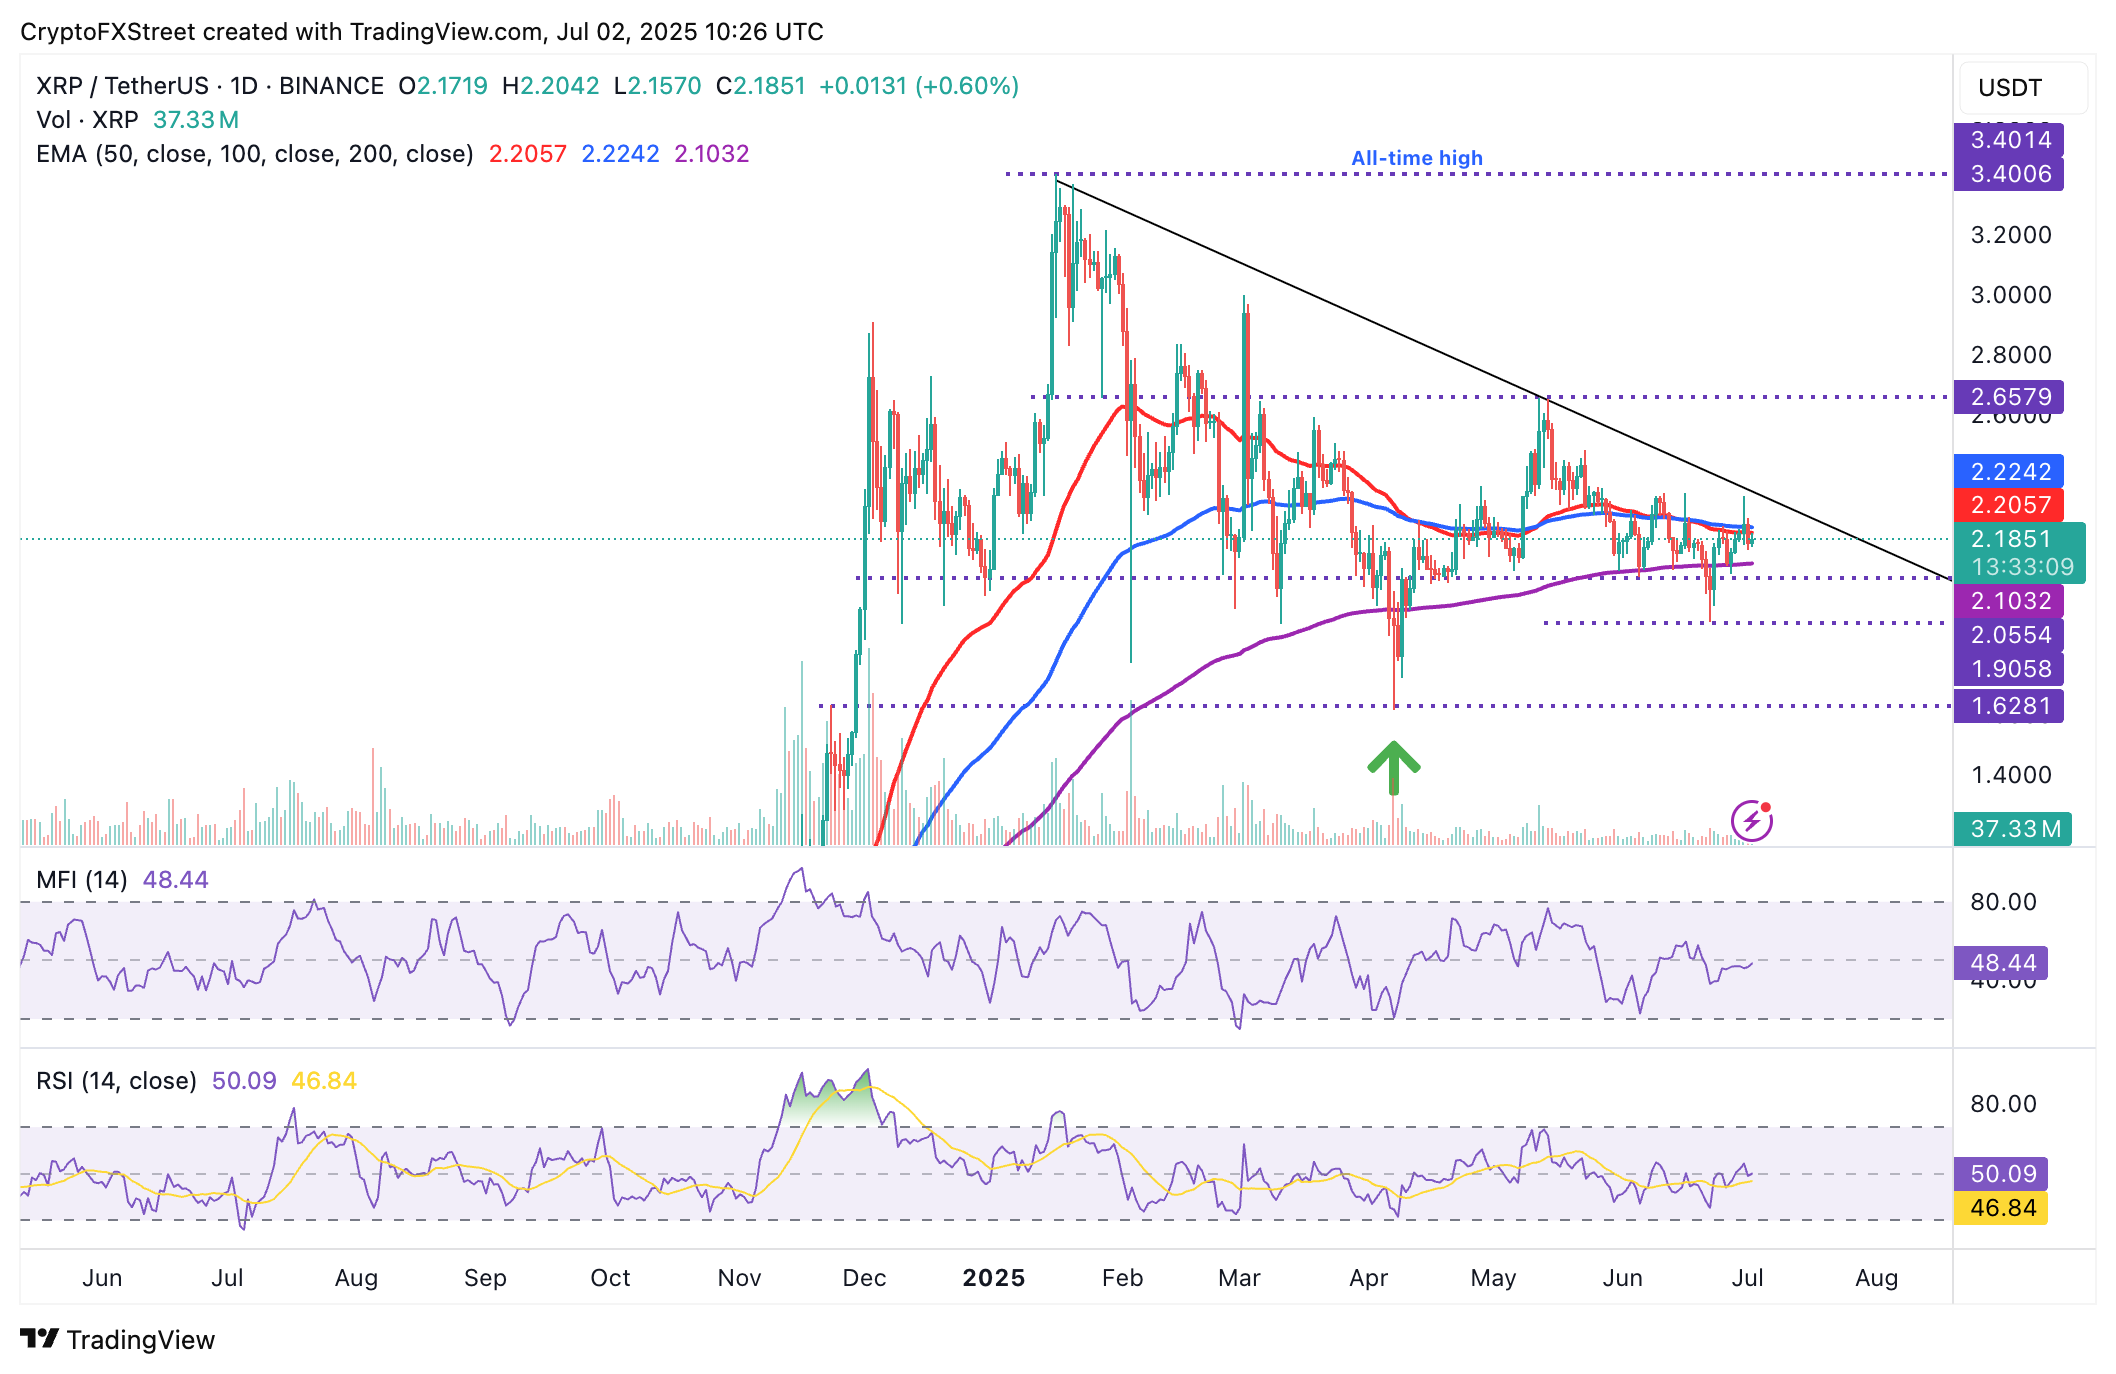
XRP/USDT daily chart
The MFI indicator upholds a bullish outlook as it approaches the midline. Further movement toward overbought territory could boost risk-on sentiment and steady the uptrend to highs seen in June at $2.34 and May’s peak of $2.65.
Token launches influence demand and adoption among market participants. Listings on crypto exchanges deepen the liquidity for an asset and add new participants to an asset’s network. This is typically bullish for a digital asset.
A hack is an event in which an attacker captures a large volume of the asset from a DeFi bridge or hot wallet of an exchange or any other crypto platform via exploits, bugs or other methods. The exploiter then transfers these tokens out of the exchange platforms to ultimately sell or swap the assets for other cryptocurrencies or stablecoins. Such events often involve an en masse panic triggering a sell-off in the affected assets.
Macroeconomic events like the US Federal Reserve’s decision on interest rates influence crypto assets mainly through the direct impact they have on the US Dollar. An increase in interest rate typically negatively influences Bitcoin and altcoin prices, and vice versa. If the US Dollar index declines, risk assets and associated leverage for trading gets cheaper, in turn driving crypto prices higher.
Halvings are typically considered bullish events as they slash the block reward in half for miners, constricting the supply of the asset. At consistent demand if the supply reduces, the asset’s price climbs.
Information on these pages contains forward-looking statements that involve risks and uncertainties. Markets and instruments profiled on this page are for informational purposes only and should not in any way come across as a recommendation to buy or sell in these assets. You should do your own thorough research before making any investment decisions. FXStreet does not in any way guarantee that this information is free from mistakes, errors, or material misstatements. It also does not guarantee that this information is of a timely nature. Investing in Open Markets involves a great deal of risk, including the loss of all or a portion of your investment, as well as emotional distress. All risks, losses and costs associated with investing, including total loss of principal, are your responsibility. The views and opinions expressed in this article are those of the authors and do not necessarily reflect the official policy or position of FXStreet nor its advertisers. The author will not be held responsible for information that is found at the end of links posted on this page.
If not otherwise explicitly mentioned in the body of the article, at the time of writing, the author has no position in any stock mentioned in this article and no business relationship with any company mentioned. The author has not received compensation for writing this article, other than from FXStreet.
FXStreet and the author do not provide personalized recommendations. The author makes no representations as to the accuracy, completeness, or suitability of this information. FXStreet and the author will not be liable for any errors, omissions or any losses, injuries or damages arising from this information and its display or use. Errors and omissions excepted.
The author and FXStreet are not registered investment advisors and nothing in this article is intended to be investment advice.
Search
RECENT PRESS RELEASES
Related Post