Distributional equality in Ethereum? On-chain analysis of Ether supply distribution and supply dynamics
March 22, 2025
Abstract
Blockchain-based emerging technologies such as decentralized finance (DeFi), cryptocurrencies, tokens, and smart contracts have introduced innovative frameworks for resource allocation and economic interactions. Ethereum, as the major technical network foundation of DeFi and tokenized assets, is becoming increasingly pivotal in facilitating an extension and alternative to traditional finance for many stakeholders, including those who are “unbanked�. Moreover, the recent transition of Ethereum from a proof-of-work (PoW) mechanism to a proof-of-stake (PoS) consensus mechanism and the Shanghai upgrade may significantly impact Ether (ETH) distribution. However, the status quo and dynamics of wealth distribution, especially after these changes in governance structure, remain unclear. By utilizing a rich dataset spanning the entire Ethereum history from July 2015 to December 2024, we analyze the balances across address groups of different sizes and the role of key economic activities and infrastructure components within Ethereum, such as exchanges, DeFi platforms, and staking. To provide detailed insights into ETH’s distributional equality, our approach combines descriptive, longitudinal, and causal inference analyses; a complete enumeration of more than 98 million unique wallet addresses; and novel on-chain analysis. Our findings show a substantial concentration of ETH within a small fraction of addresses, with approximately 0.3% of wallets holding nearly 95% of the total supply, despite the majority of wallets holding less than 0.1% ETH. However, the ETH distribution broadly resembles wealth distributions in traditional economies, with a log-normal body and Pareto-like tails. We assert that previous studies have overstated the concentration of ETH. Additionally, our dynamic analysis reveals a nuanced trend toward less concentration over time, driven by market cycles, increasing staking participation, and reinvestment in DeFi. These results challenge the notion of pervasive centralization. This study contributes to a deeper understanding of the current ETH distribution and its evolution over time. Therefore, this work provides an objective, data-driven basis for the ongoing discussion on wealth (in)equality in blockchain-based ecosystems, particularly in DeFi.
Introduction
In an era of relentless technological advancement, the impact of emerging technologies on the distribution of wealth is becoming increasingly significant, as digital platforms, automation, and decentralized financial systems reshape labor markets, influence resource allocation, and redefine pathways to economic opportunity (Autor 2015, Brynjolfsson and McAfee 2014, Xiao et al. 2024). As blockchain technology is maturing and increasingly permeating various economic sectors, wealth distribution within blockchains has emerged as a critical area of study (Cong et al. 2024). The decentralized nature of blockchain systems presents unique challenges and opportunities for wealth accumulation and distribution. These networks, which are designed to operate without centralized control, have the potential to reshape traditional economic structures and power dynamics. The distribution of tokens, which often represent both economic value and governance rights within these systems, plays a crucial role in determining the overall health, security, and fairness of the network (RoÅŸu and Saleh 2021). Blockchain-based technologies play an ambiguous role as both a potential solution to unequal distributions of wealth by offering opportunities for more inclusive, decentralized financial structures (Abdulhakeem and Hu 2021, Adegbite 2024) and a catalyst for wealth disparities by enabling the concentration of assets among those best positioned to leverage such innovations.
Despite the growing importance of blockchain technology in the global financial landscape, our understanding of wealth distribution in these networks remains limited. While some studies have explored inequality in blockchain (see the next section), more comprehensive analyses using more advanced statistical methods, a dynamic perspective, and more elaborate methodological approaches addressing those challenges typical of blockchain are scarce. We focus on Ethereum, the primary blockchain infrastructure for decentralized finance (DeFi) and tokenized assets, which offers a significant alternative to traditional financial systems and expands access to financial services, particularly for the “unbanked� population. Within the Ethereum ecosystem, we focus on Ether (ETH), the native cryptocurrency of the Ethereum network, which plays multiple roles. ETH facilitates transactions and smart contract executions, rewards network participants for validation and staking, can act as a store of value for investors, provides trading opportunities for speculators, and functions as a payment method for goods and services at participating businesses. Additionally, ETH is used to pay “gas fees� for network operations, making it essential for the overall functionality of Ethereum. ETH is the world’s second-largest cryptocurrency by market capitalization, second only to Bitcoin (BTC) according to the market cap as of January 2025. The recent transition of Ethereum from a proof-of-work (PoW) mechanism to a proof-of-stake (PoS) consensus mechanism has introduced new dynamics that may significantly impact ETH distribution. This transition started with the Beacon Chain in December 2020, ran parallel with the PoW chain until “the Merge� in September 2022 (which formally united both chains under the PoS concept), and was followed by the Shanghai upgrade on April 12, 2023, allowing, for the first time, withdrawals of staked ETH locked since the inception of the Beacon Chain. Cong et al. (2023) emphasize the need for future research to explore the mechanisms driving on-chain wealth concentration and the effects of major protocol changes, such as Ethereum’s “Merge�. Consequently, there is a gap in the current literature regarding the study of the DeFi-related distribution of wealth within blockchains utilizing methods and metrics that allow for a detailed analysis of the state and dynamics of this distribution. Against this backdrop, we pose the following research question: How is ETH distributed within Ethereum, and how does this distribution evolve under the recent changes in consensus mechanisms, changed token governance, and varying market regimes?
This study seeks to address this question empirically by utilizing a rich dataset spanning the entire history of Ethereum from July 2015 to December 2024. We analyze the balances across address groups of different sizes and the role of key economic activities and infrastructure components within Ethereum’s ecosystem, such as centralized exchanges (CEXs), decentralized exchanges (DEXs), DeFi platforms, and staking. Our approach combines descriptive, longitudinal, and large-scale causal inference data analyses, covering a complete enumeration of more than 98 million unique wallet addresses, and a novel on-chain analysis to provide detailed insights into the distributional equality of ETH.
This study contributes to the literature in three ways. First, this work provides a comprehensive and detailed account of the current state of ETH distribution by testing for parametric distributions, namely, Pareto, log-normal, and Weibull distributions, and offers a nuanced assessment of wealth concentration through various concentration measures. Second, our analysis reveals how ETH distribution has evolved during Ethereum’s substantial transition from PoW to PoS, known as “the Merge�, and the Shanghai upgrade, allowing for more flexible token dispositions (staking and unstaking of tokens), illustrating the impact of protocol shifts, staking, and market cycles on overall ETH distribution patterns. These findings have direct practical implications for developers of blockchain protocols, especially because these developers design mechanisms intended to foster broader participation and reduce the degree of concentration risk. Third, we make a methodological contribution by leveraging the unique advantages of blockchain technology. Rather than relying on sampling techniques, we conduct a complete enumeration of over 98 million unique Ethereum addresses. This approach circumvents the challenges commonly associated with sampling, such as issues of representativeness and stratification, while offering an unprecedented level of granularity for studying wealth distribution at scale. Our integration of descriptive, longitudinal, and causal inference data analyses provides a blueprint that can be applied to other blockchains and digital asset ecosystems.
We do not advocate for or against an equal distribution of wealth within blockchain networks but rather analyze the status quo. By providing a clear and comprehensive understanding of distribution patterns, our contributions lay the groundwork for the empirical-based assessment of the role of blockchain-based emerging technologies for wealth (in)equality and, beyond that, inform discourses on the governance, regulatory, financial and societal implications of DeFi.
The remainder of this paper is structured as follows. In Section “Theoretical background and hypothesis development�, we introduce the theoretical perspective adopted in this study and develop hypotheses accordingly. In Section “Data and methods�, we describe both the methods and data used for testing the previously developed hypotheses. In Section “Results�, we present the results, describing the distribution and development of ETH. Finally, we critically discuss the findings in the context of the current literature in Section “Discussion and conclusions�.
Theoretical background and hypothesis development
Economic inequality
The Oxford English Dictionary defines inequality as the state of being unequal, particularly with respect to rights, class, and opportunities. This study focuses on economic inequality to describe disparities in wealth. We use the term wealth (in)equality to refer to the degree of disparity in the distribution of wealth. In this context, wealth distribution is the overarching concept that encompasses how economic resources are spread across a population. While the issue of wealth and income inequality has been a topic of discussion for decades, it has recently reemerged prominently in contemporary economic discourse due to factors such as rising globalization, technological advances, and their impacts on labor and wealth distribution.
The rich body of academic literature uses parametric distributions to examine wealth and income across populations. These distributions are typically right skewed, with heavy upper tails representing disproportionately large and slowly diminishing top wealth shares (Benhabib et al. 2011, Clementi and Gallegati 2005). These statistical properties are foundational in defining wealth inequality and are remarkably consistent across a broad range of countries and historical periods. Pareto distribution, which has been widely used to model wealth inequality, captures this consistency (Wold and Whittle 1957). This distribution dates back to Vilfredo Pareto’s seminal work, Cours d’Economie Politique (Pareto 1964), which Samuelson (1972) later encapsulated as “Pareto’s law�. Moreover, Piketty’s influential work, Capital in the Twenty-First Century (Piketty and Goldhammer 2014), revitalized scholarly attention to the historical evolution of wealth distribution. Piketty posits that when the rate of return on capital (r) surpasses the rate of economic growth (g), wealth accumulates faster than does income, leading to heightened inequality. Several scholars concur that in the absence of significant disruptions or progressive policy interventions, wealth concentration intensifies over time (Atkinson 2016, Milanovic 2016, Scheidel 2017, Stiglitz, forthcoming 2025). Economic inequality has profound implications for economic sustainability (Piketty and Goldhammer 2014, Stiglitz 2012), political equality (Gilens and Page 2014), social cohesion (Wilkinson and Pickett 2009), physical and mental health outcomes (Pickett and Wilkinson 2014), social mobility and access to opportunities (Chetty et al. 2014).
Empirical evidence supports the resurgence of wealth and income disparities in many advanced economies. Studies have documented that the share of income and wealth held by the top percentiles has increased markedly since the late 20th century (Alfani 2024, Chancel et al. 2021).
Blockchain technology and wealth distribution
Technological advancements play an ambivalent role in this context, as they contribute to wealth inequality on the one hand (Autor et al. 2008) and hold potential for tackling economic disparities on the other hand (Demirgüç-Kunt et al. 2018). Blockchain technology, which describes a decentralized ledger system that facilitates secure and transparent transactions without the dependence on intermediaries (Iansiti and Lakhani 2017), embodies this ambiguity. Tokens are digital assets existing on a blockchain that represent value, rights, or access to specific functionalities within a particular ecosystem, serving as unique, programmable units that can represent anything from digital currencies and investment securities to ownership rights and utility functions.
In this study, we use the term “wealth inequality� to refer to the degree of inequality in the distribution of tokens (as economic resources) among wallets to explore this concept in the blockchain context. Blockchain technology offers unique features that can reshape traditional financial systems and wealth distribution mechanisms, especially through tokenization and DeFi. These innovations allow for the fractional ownership of assets and more democratic participation in financial markets, potentially broadening wealth accumulation opportunities.
One key aspect of blockchain is its ability to enable greater financial inclusion by providing unbanked populations with access to financial services (Prisco and Strangio 2021). By reducing the need for intermediaries and lowering transaction costs, blockchain-based systems can make financial services more accessible and affordable for a greater number of people.
However, blockchain may also be conducive to the increase of wealth inequality. The concentration of profits among early adopters and dominant players has the potential to increase existing inequalities or to substitute old wealthy groups with new ones. Studies investigating wealth distribution on blockchains have found extremely high Gini coefficients, indicating significant inequality within these digital ecosystems (Sai et al. 2021b, Victor et al. 2021).
Wealth distribution in Ethereum
In this study, we investigate the status quo and development of wealth distribution in Ethereum. Ethereum is an open-source blockchain platform that has gained prominence in the blockchain world owing to its smart contract capabilities (Calvo 2024, Cong and He 2019). Smart contracts are self-executing programs with predefined rules that are stored on the blockchain, enabling the creation of decentralized applications and facilitating complex financial operations without intermediaries. This functionality has positioned Ethereum as the leading DeFi platform (DefiLlama 2024). Ethereum’s native cryptocurrency ETH is the second largest by market capitalization and is used to pay for computational services and execute smart contracts. In line with our definition of wealth inequality in blockchain, we investigate the degree of inequality in the distribution of ETH across addresses and how this distribution has evolved over time, particularly in response to significant network events such as the transition from the PoW to the PoS consensus mechanism, the Shanghai upgrade, and varying market conditions.
Several studies have investigated various aspects of Ethereum and other cryptocurrencies, including mining power concentration, wealth distribution, centralization risks, and financial inclusion. Cong et al. (2021) examine the impact of centralized mining pools on the decentralization of blockchains, arguing that while centralized mining pools facilitate risk sharing among miners, they do not necessarily undermine decentralization. Instead, these pools increase the energy consumption of PoW-based blockchains. Empirical evidence from BTC mining supports the predictions of the abovementioned model, highlighting the implications for other consensus protocols and sectors with similar characteristics. Similarly, Roşu and Saleh (2021) explore the dynamics of wealth distribution in PoS cryptocurrencies and find that contrary to the common belief that “the rich get richer,� investor shares in PoS cryptocurrencies are martingales that converge to a stable distribution over time. This stability is robust, even when allowing for trading among risk-neutral investors, indicating that investors do not have a significant incentive to excessively accumulate coins. To address the issue of centralization, Capponi et al. (2023) develop a game theoretical model to analyze the decentralization of PoW cryptocurrencies, demonstrating that while centralization increases with heterogeneity in mining costs, hardware capacity constraints prevent the most efficient miners from monopolizing the mining process. Their findings suggest that investment in hardware leads to a more decentralized network unless larger miners have a significant comparative advantage over smaller miners. Additionally, Urquhart (2022) provide an overview of the Ethereum blockchain, examining addresses, transactions, fees, and user holding patterns. In the context of Ethereum’s transition from PoW to PoS, Grandjean et al. (2023) conduct a longitudinal study of the PoS consensus layer and discover that network upgrades and issues with major consensus clients cause dips in network participation. Their analysis reveals that Ethereum’s PoS decentralization is comparable to that of its PoW counterpart. The above study also highlights the increased security concerns due to the monopolization of custodial staking services.
Another research stream investigates the relationship between ETH distribution and financial inclusion. Cong et al. (2023) investigate the potential for financial inclusion through Web3 and DeFi, focusing on Ethereum; they describe the concentration of mining income and ETH ownership, noting that exchanges and a few individual nodes hold the majority of assets. The above study highlights challenges such as high transaction fees and high-level volatility, which disproportionately affect smaller participants. Sai et al. (2021b) analyze wealth distribution across several major cryptocurrencies, including BTC, Ethereum, and Litecoin. Their study reports on the Gini coefficient and Nakamoto index, highlighting the significant wealth concentration within these cryptocurrencies. The above authors draw parallels between crypto economies and real-world economies, suggesting that the free-market implementation of cryptocurrencies may lead to worse wealth inequalities.
Hypothesis development
This study aims to contribute to research on the concentration of wealth in blockchain networks by analyzing the status quo of the distribution of ETH holdings (H1) and its evolution (H2).
For the first part of our analysis, which focuses on the status quo, we hypothesize the following.
H1: The distribution of ETH is similar to that of wealth distributions found in traditional economies.
As outlined, wealth distributions in traditional economies are well documented as being highly skewed, often following Pareto or power-law distributions (Clementi and Gallegati 2005). These distributions reflect the principle that a small fraction of participants control a disproportionate share of total wealth. This phenomenon is also prevalent in cryptocurrencies, where research has identified extreme concentrations of ETH holdings (Sai et al. 2021b). Early ETH distribution mechanisms, such as premining and initial coin offerings, disproportionately allocate ETH to insiders, developers, and early investors, resulting in a highly unequal initial distribution.
We expect the distribution of ETH to be consistent with the wealth distribution patterns found in traditional economies. This hypothesis is motivated by the high-level token concentration observed in blockchains, where a small subset of addresses controls the majority of the token supply. Our analysis tests this hypothesis by fitting Pareto and alternative parametric distributions to the data and evaluating their fit to the observed distribution of ETH holdings.
For the second part of our analysis, which focuses on the dynamics of the ETH distribution, we hypothesize the following. H2: ETH holdings become more concentrated over time.
Economic theory posits that wealth concentration often intensifies in unregulated environments without redistribution policies (Boghosian 2019, Piketty and Goldhammer 2014, Scheidel 2017, Stiglitz 2012). As Ethereum was a fairly unregulated environment in the early years of its development, with a high concentration of wealth, it thus presents a natural setting in which to test this hypothesis. Previous research has revealed increasing wealth concentration in PoW systems, where mining rewards and high barriers to entry exacerbate disparities (Cong et al. 2023). However, Ethereum’s transition to PoS and the Shanghai upgrade have introduced several factors that can counteract these trends.
First, as Cong et al. (2023) argue, the barrier to entry for staking is significantly lower than that for mining. PoS reduces the degree of reliance on specialized hardware and energy-intensive operations, enabling broader participation and potentially reducing wealth concentration. Additionally, the increase in DeFi activity, as evidenced by the increase in total value locked (TVL) across decentralized platforms (DefiLlama 2024), may contribute to the redistribution of ETH. ETH previously held on CEXs can flow into the DeFi infrastructure, thus increasing the degree of decentralization.
Market cycles also play a pivotal role in shaping wealth dynamics. Economic theory suggests that price fluctuations create natural incentives for market participants, particularly those with varying resources, degrees of investor sophistication and levels of risk tolerance (Chiarella et al. 2006). This behavior aligns with lifecycle investment theories, which posit that participants with longer time horizons capitalize more on long-term price growth, whereas short-term participants react more strongly to volatility (Merton 1971). Similarly, wealth distribution dynamics suggest that significant price changes amplify or reduce inequality depending on how gains and losses are distributed (Chiarella et al. 2006, Saez and Zucman 2016). Examining market regimes reveals how bull markets can reduce wealth concentration through profit taking, mirroring the realization effect (Campbell 2006). Conversely, bear markets and price bubbles intensify concentration due to accumulation by larger entities (Caballero and Krishnamurthy 2008, Chiarella et al. 2006).
Finally, major protocol changes, such as the “Merge� and Shanghai upgrade, introduce additional dynamics. By enabling staking withdrawals and increasing staking participation, these changes can influence the distribution of ETH holdings in complex ways. The net effect of these opposing forces decentralizing influences from staking and DeFi and concentrating forces from market cycles raises an important empirical question about the evolution of the wealth distribution of ETH.
Overall, the current arguments on whether ETH distribution is becoming more or less concentrated remain inconclusive. However, if we assume that ETH is distributed like wealth in traditional economies, where traditional theories posit that wealth tends to concentrate at the top over time, then we expect a similar trend of an increasing concentration of ETH holdings (H2).
Data and methods
This study employs a hypothesis-driven approach to empirically analyze the distribution and dynamics of ETH holdings. The analysis is divided into two parts. First, the status quo is analyzed by examining the current state of ETH distributions. Second, a dynamic analysis investigates the evolution of ETH distribution over time, including market regime behavior and changes after “the Merge� and Shanghai upgrade.
Data collection and preparation
In this study, we use a multisource approach to gather comprehensive data on ETH supply distribution, relying on the below three data sources.
Temporal data (Santiment, Dune)
We collect historical data on ETH supply distribution using Santiment, a network intelligence platform for cryptocurrency markets. This dataset spans the entire history of the Ethereum blockchain from July 2015 until December 2024, is recorded at daily intervals, and includes aggregated wallet data, such as balances and the number of addresses, along with price data.
The data are categorized into progressively larger intervals, starting from very small amounts and increasing by a factor of ten. These intervals range from 0–0.001 coins to one billion coins, covering various balance sizes. For each of these balance intervals, the metric shows the percentage of the total number of coins held. We aggregate the lowest and highest balance intervals into groups of balances according to Urquhart (2022) (see Fig. 4).
Additionally, we query daily ETH holdings for the following wallet categories: wrapped ETH (WETH) smart contracts, CEXs, DEXs, bridges and lending protocols. As ETH in its native form cannot interact directly with smart contracts, it necessitates conversion into the ERC-20 standard, commonly referred to as “wrapping�. This process effectively locks ETH into the WETH contract, facilitating its use in the DeFi ecosystem. Bridges are applications that lock ETH on the source network (Ethereum in this case) and mint equivalent tokens on the destination network, enabling cross-chain interoperability and seamless asset transfer within the DeFi ecosystem. From Dune Analytics, a chain analysis platform, we query data on the amount of ETH staked and withdrawn from the Beacon Chain.
Account-level data (Google BigQuery)
To obtain detailed insights into ETH holdings, we utilize Google BigQuery, which provides access to various datasets of the Ethereum blockchain. We use these data to compute wallet balances for all Ethereum addresses, including over 98 million unique addresses. With this high-level granularity, we can gain a detailed understanding of the distribution of ETH among holders and analyze the overall supply distribution. In our approach, we access the “crypto_ethereum� dataset within Google BigQuery, which includes detailed tables for traces, blocks, and transactions. We design a Structured Query Language (SQL) query to extract and process these data in several stages. First, we prepare the raw data by selecting the necessary fields from the trace, block, and transaction tables, ensuring that we capture all relevant transactional information. We filter the data to include only confirmed transactions. The next step involves constructing a double-entry bookkeeping model to track the flow of ETH into and out of each address. We consider all transactions where addresses either sent or received ETH, and we also account for transaction fees by integrating data from the block and transaction tables. With the double-entry bookkeeping framework in place, we aggregate the transaction values to compute the net balance for each address in monthly intervals until February 2024. For all further analyses, we filter for wallets with a balance over 0.0001 ETH to focus on active wallets. Such a cutoff is necessary because, on the blockchain, wallets can only be created and not deleted, meaning that including all wallets does not provide an accurate representation, as the majority are either inactive or empty. This situation results in a dataset comprising 92 million wallets, which account for approximately 99.99% of all ETH.
Entity labels (WalletLabels, Etherscan)
We use labels from WalletLabels.xyz and Etherscan.io to differentiate between various entities within the Ethereum network. These labels enable the precise categorization of addresses by assigning them to types such as “smart contracts� and “exchange wallets� and identifying specific entities such as “Binance� when possible. This situation results in a total of more than 42 million labeled addresses.
Data integration and analysis
The subsequent stage in the process is the integration of the preprocessed data from the various sources to create a final dataset.
We incorporate the entity labels (c) into the account-level dataset (b) to provide additional context and depth to our analysis. This step enables us to differentiate between various types of addresses and their relationships with entities such as exchanges. Out of our 92 million addresses, we attribute 10.88 million to a label. Table 1 presents the frequencies of the top 15 label types.
Analysis framework
Status quo analysis
For the statistical distribution analysis, we excluded all wallets with labels. As Table 1 shows, labeled wallets represent entities or mechanisms (such as contracts, exchanges, or pools) rather than individual holders. By analyzing only unlabeled wallets, we increased the proportion of wallets owned by ordinary users, providing a more accurate representation of ETH distribution among individual holders. Owing to the pseudonymous nature of blockchain systems, it is not possible to map wallets definitively to individual users; as such, all distribution analyses in this study refer to the distribution of ETH across wallets rather than across users. However, it is likely that the true distribution of ETH ownership is more decentralized than that observed, as smaller retail investors often rely on centralized services and exchanges, where their funds are pooled into large deposit wallets. Conversely, wealthier users, prioritizing security, are more inclined to use self-hosted and hardware wallets, suggesting that many large wallets may represent the aggregated holdings of multiple individuals rather than of a single entity (Nadler and Schär 2020).
We performed a statistical analysis on Ethereum wallet balances, which were divided into the following two segments: the bottom 99% of wallets and the top 1% of wallets. The segmentation of wallets into the bottom 99% and top 1% follows the well-established practice in wealth distribution studies, which often separately analyze the bulk and tail of the data to account for the distinct statistical properties of these regions (Clementi and Gallegati 2005). Wealth distributions typically exhibit heavy tails, as characterized by the Pareto principle, making it crucial to evaluate the body and tail segments independently.
The dataset was sorted in ascending order on the basis of wallet balances and divided into two groups—the top 1% of wallets, representing the wealthiest wallets with the highest balances, and the bottom 99% of wallets, which include all wallets except those in the top 1%.
We applied all analyses to both groups, the top 1% and the bottom 99%, independently. First, we fitted three distributions—Pareto, log-normal and Weibull minimum—to the sorted data. The choice of these distributions was motivated by their prevalence in modeling income and wealth data (Hlasny 2021).
The parameters for each distribution were estimated using the maximum likelihood estimation (MLE) method, and fit was evaluated via log likelihood, the Akaike information criterion (AIC), and the Kolmogorov–Smirnov (KS) test (Goldstein et al. 2004). The best-fitting distribution for each segment was visually inspected by plotting the empirical cumulative distribution function (CDF) overlaid with the CDFs of the fitted distributions and quantile–quantile (QQ) plots comparing the quantiles of the data to the theoretical quantiles of the fitted distributions.
These plots allowed for a qualitative evaluation of how well the distributions captured the characteristics of the data. Visual inspection is commonly recommended, as it provides insights into areas where statistical metrics may fall short, especially since empirical data rarely perfectly follow parametric distributions (Hlasny 2021).
Dynamic analysis
This section explores the changes in ETH distributions by conducting a visual analysis of wallet clustering and divergence trends during both bull and bear markets and how the stacking mechanism of the Shanghai upgrade is related to these patterns.
We conducted exploratory data analysis to examine the raw blockchain data and uncover underlying patterns, anomalies, and relationships. This process involved visualizing trends over time, identifying significant events, and summarizing the data to provide both a visual and quantitative foundation for further analysis. To reveal the distribution and dynamics of ETH holdings across different wallet types, we utilized a variety of graphical and statistical tools.
Numerous measures are used to quantify concentrations. While the Gini coefficient is a widely used measure of inequality, its sensitivity to changes at the lower end of the distribution makes it less suitable for evaluating risks in blockchain ecosystems. In traditional wealth distributions, the Gini coefficient provides valuable insights, as it accounts for the entire spectrum of holdings, including both extreme poverty and extreme wealth. However, in blockchain ecosystems, where the concentration of funds at the top is the primary concern, the Gini coefficient’s focus on minor holdings dilutes its relevance. This issue is compounded by the unbounded growth in the number of blockchain addresses, as new addresses, many of which hold negligible amounts or serve only as intermediaries for transactions, can be created freely. These factors artificially skew the Gini coefficient and overemphasize inequality at the lower end of the distribution.
Furthermore, there are additional issues associated with using the single-parameter inequality measure Gini, calling for more comprehensive measures, which may help resolve extant tensions in the field of inequality distribution measurement (Blesch et al. 2022, Shen and Dai 2024). To retain comparability with similar studies, we continue to use the Gini index where applicable; however, we also extend our analysis via the Herfindahl–Hirschman index (HHI). Unlike the Gini coefficient, the HHI focuses on the squared shares of the largest entities, thereby emphasizing top-heavy distributions. This property makes this index less sensitive to the number of negligible addresses and allows it to better reflect the risks associated with large concentrations of funds in a small number of wallets. The HHI has a long history of use in measuring market concentration in economics and is endorsed by antitrust authorities due to its ability to gauge the potential for monopolistic or oligopolistic control (Carlton 2010).
To evaluate how the concentration of ETH holdings evolves over time, we computed the HHI for all unlabeled Ethereum wallets holding more than 0.0001 ETH. This threshold helped us filter out empty or near-empty addresses that did not affect concentration. In the context of decentralization and wealth distribution, the HHI highlights the risk of power becoming too centralized, a critical issue in PoS systems, where a small number of large stakeholders can exert a disproportionate influence or threaten network security. We define the HHI as follows:
where si represents the share of the i-th wallet relative to total ETH holdings. In the context of blockchain networks, a higher HHI indicates a greater concentration of tokens among a small number of wallets, which can undermine the security and fairness of the PoS mechanism; conversely, a lower HHI denotes a more even distribution.
The proper accounting of specific addresses is essential for accurate analysis. For example, in the Beacon Chain contract, simply measuring the total amount of ETH would be misleading because the Beacon deposit contract functions as a one-way bridge; ETH deposited into the contract remains there, but when withdrawals occur, the withdrawn ETH is credited directly to the user’s account, without generating an outgoing transaction from the deposit contract. Therefore, failing to subtract withdrawn ETH from the balance of the deposit contract can lead to a significant misinterpretation of inequality trends.
In addition to longitudinal measures of concentration, we analyzed market phases and distributions, recognizing that market regimes significantly influence wealth dynamics (Chiarella et al. 2006).
We also employed causal inference analysis via the state-of-the-art Peter and Clark momentary conditional independence (PCMCI) method to examine ETH flows between different wallet groups. PCMCI allowed us to uncover temporal dependencies and directional relationships, providing insights into how ETH moves between DEXs, CEXs, staked ETH, and other wallet categories. Specifically, we analyzed changes in ETH holdings around key protocol events, such as the transition to PoS and the Shanghai upgrade.
Finally, we focused on concentration at the consensus layer, which represents the most critical risk factor for Ethereum, as high-level token concentration can allow a single entity to control a critical threshold of stake, potentially compromising the network. To this end, we measured the Gini coefficient over time with respect to staked ETH for each major staking entity. Unlike wallet-level analysis, the consensus layer did not encounter the issue of address inflation, as the entities involved in staking were well defined and limited in number. Each staking entity’s holdings were fully accounted for, providing a complete and accurate representation of the staking distribution. This situation confirmed the appropriateness of the Gini coefficient as a measure for assessing inequality in this context.
We computed the Gini index G (Dorfman 1979) as follows:
where n is the number of entities; xi and xj are the balances of the i-th and j-th entities, respectively; and μ is the mean balance.
The value of the Gini index varies between 0, that is, perfect equality (each household or individual (here, the staking entity) has the same income or wealth), and 1, that is, perfect inequality (one household or individual (here, the staking entity) earns or owns everything). Tracking this measure over time highlights the extent to which staking power is concentrated among a few dominant entities.
Finally, we interpreted these statistical results within the broader context of Ethereum. Beyond analyzing the balances of differently sized wallet clusters during various market cycles and key events, we incorporated contextual insights from developments in the Ethereum protocol, relevant news articles, and expert opinions from long-term DeFi contributors. This expanded approach offered a comprehensive view of the patterns and dynamics within Ethereum.
Causal inference analysis using PCMCI
To analyze ETH flows among key wallet clusters in Ethereum, we conducted a causal inference analysis using a flow matrix and the PCMCI algorithm for causal discovery. This method is well suited for high-dimensional time-series data and identifies causal links by testing conditional independencies (Runge et al. 2019).
The mean flow matrix was employed to examine the directional flows of ETH between DeFi (consisting of Lending Protocols, DEXs, Bridges, and WETH), staked ETH, CEXs, remaining wallets with <100 ETH, and wallets with > 100 ETH. This method quantified ETH movement dynamics, highlighting which categories dominated flows and how these dynamics evolved across distinct periods—(1) before the Beacon Chain launch, (2) after the Beacon Chain launch but before the Shanghai upgrade, and (3) after the Shanghai upgrade.
The ETH balance time-series data were segmented into three periods using key dates—the Beacon Chain launch on December 1, 2020, and the Shanghai upgrade on April 12, 2023.
The weekly net changes in balances for each category were computed as follows:
where (B_i^t) is the balance of category i at time t. These net changes were used to reconstruct the flow matrix for each week by solving the below optimization problem.
Let us minimize the total sum of flows as follows:
where Fij represents the flow from category i to category j and n is the total number of categories.
The inflows and outflows for each category must satisfy the observed net change as follows:
The flows are constrained to be nonnegative as follows:
The optimization problem was solved using linear programming.
The reconstructed flow matrices for each week were averaged across each period to compute the mean flow matrix as follows:
where T is the total number of weeks in the period. The resulting mean flow matrix provided a concise representation of the ETH movement dynamics for each phase.
The PCMCI analysis included the same time series as those used in the prior flow matrix analysis. Data were made stationary by differencing. Stationarity was confirmed via an augmented Dickey–Fuller (ADF) test. Since we hypothesized that the Shanghai upgrade was a significant event, we tested the data for structural breaks at that date using the Chow test. Next, we divided the dataset into two periods, before and after the Shanghai upgrade on April 12, 2023, to evaluate changes in causal structures.
PCMCI operates via the following two main steps:
-
1.
The PC algorithm identifies candidate causal parents by iteratively testing conditional independencies among variables with lagged dependencies up to a user-defined maximum lag.
-
2.
The momentary conditional independence (MCI) algorithm refines these relationships by estimating partial correlations and p values, providing robust measures of causal strength and significance.
We employed the generalized ParCorr (GPDC) test for conditional independence, which is particularly effective in handling nonlinear dependencies (Runge 2018). We chose a maximum lag of 7 for the PCMCI algorithm because we observed a correlation decay beyond that point. The analysis was conducted with an alpha level of 0.01.
The causal relationships identified by PCMCI were visualized as directed graphs. Each node represents a variable, and edges indicate significant causal links. Edge weights correspond to the strength of the causal effect, as measured by the MCI algorithm.
Contextual interpretation
We interpret the findings within the broader Ethereum ecosystem, considering market trends, actor behaviors and protocol-level changes, such as the transition to PoS and the Shanghai upgrade. This contextual layer integrates external insights, including relevant literature and expert opinions, to provide a holistic understanding of ETH distribution and dynamics.
Results
Static analysis of ETH supply
Raw data reveal disparities in the distribution of assets within the network. The vast majority, 95%, of Ethereum addresses hold less than 0.1 ETH. This finding may be interpreted as a sign of widespread ETH adoption and distribution among many participants. However, a closer analysis of the relative supply held by these addresses reveals a contrasting picture of concentration; approximately 0.3% of addresses hold nearly 95% of the total supply (holding over 10 ETH).
The discrepancy between the number of addresses and the concentration of funds raises important questions about the true nature of ETH’s (current) distribution. Although Ethereum seems decentralized in terms of address count, high-balance addresses demonstrate high-level wealth concentration, as noted by Sai et al. (2021a). CEX wallets, bridges, the Beacon Chain contract, and the WETH contract consolidate the distribution of many individual investors’ funds, creating the impression of centralization. However, even after excluding CEXs, smart contract wallets, and other nonindividual wallets by considering only unlabeled wallets, the Gini coefficient remains high, between 0.9 and 0.95, depending on the inclusion criteria. If we filter out those wallets holding less than 0.1 ETH, then it is closer to 0.9, and if we consider all wallets, then it is closer to 0.95.
Figure 1 displays wallets holding over 100,000 ETH, comprising approximately half of ETH holdings as of December 2023. The Beacon Chain deposit contract holds 29% of all ETH, accounting for 55.6% of the supply held by 100,000+ ETH addresses. The rest of the supply is held in unlabeled addresses, exchange wallets, WETH, and bridges.
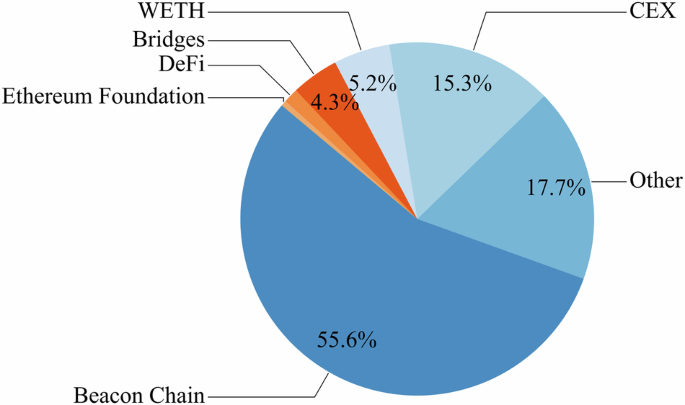
This chart displays the distribution of ETH holdings among all addresses with more than 100,000 ETH (102 addresses as of February 2024). The percentages represent the relative amounts of ETH held by each category. The Beacon Chain holds the largest share, at 55.6%, followed by other categories, including CEX (15.3%), Other (17.7%), WETH (5.2%), Bridges (4.3%), DeFi, and the Ethereum Foundation.
In the following section, only the results for the best-fitting distributions are reported. The extreme numbers from the statistical tests result from the large number of samples.
Body of distribution (bottom 99%)
For the bottom 99%, the log-normal distribution provides the best fit across all the metrics, achieving the highest log-likelihood (369,776,507), the lowest AIC (-739,553,009), and the lowest KS statistic (0.0355), outperforming both the Pareto and Weibull distributions. However, the KS test results indicated significant deviations from all the fitted distributions (p value = 0.0), suggesting that none perfectly capture the underlying distribution. Visual inspection of the QQ and CDF plots (Fig. 2) reveals that the log-normal distribution deviates in the higher quantiles, where it slightly underestimates the observed data.
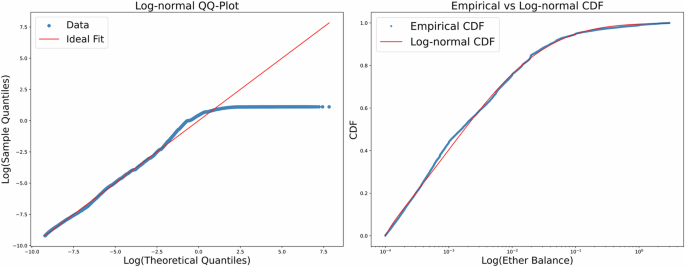
This figure displays the QQ and CDF plots for the bottom 99% of wallets in terms of their ETH holding distribution, fitted to a log-normal distribution.
The calculated mean and median of the log-normal distribution are approximately 0.0399 ETH and 0.001667 ETH, respectively, and the observed mean and median are 0.0392 ETH and 0.00157 ETH. These values reflect the dominance of small balances in the bottom 99%, aligning not only with the long-tailed nature of wealth distributions but also with the fact that in the empirical data, we have fewer addresses at the upper part of the distribution than one would expect from the parametric distribution.
Distribution tail (top 1%)
The Pareto distribution exhibits the best fit for the top 1% of wallets, achieving the highest log-likelihood (-3,227,396), the lowest AIC (6,454,799), and the lowest KS statistic (0.0144), outperforming both the log-normal and Weibull distributions. Like with the body of the distribution, the KS statistic exhibits a significant deviation (p value = 0.0). The QQ and CDF plots (Fig. 3) further confirm that the Pareto distribution captures the extreme concentration of wealth in the tail well for the majority of the data while not aligning perfectly at the higher range of the distribution.
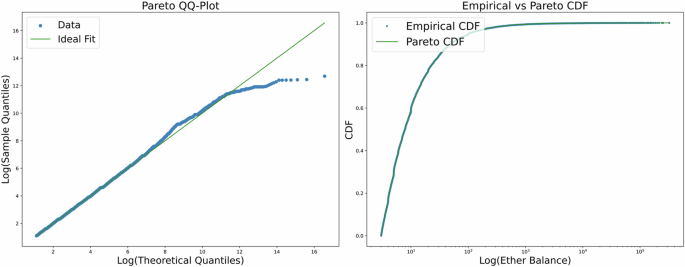
This figure displays the QQ and CDF plots for the top 1% of wallets in terms of their ETH holding distribution, fitted to a Pareto distribution.
While the log-normal distribution underestimates the upper quantiles, the Pareto distribution aligns closer with the observed data, particularly at the highest wallet balances. Fitting a power-law distribution to the tail yields an alpha value of 1.79 and an Xmin of 3.021, which is consistent with the heavy-tailed characteristics of wealth distributions in economies.
The power-law alpha represents the rate at which the probability of observing extreme values decreases as the value increases; smaller alpha values indicate “heavier� tails. Empirical studies have shown that the distribution of individual wealth in different countries during various periods in the 20th century follows a power-law distribution with 1 < α < 2 (Malcai et al. 2002).
Dynamic analysis
General observations
Figure 4 illustrates the distribution of ETH’s total supply across wallets of varying sizes on the basis of the classification proposed by Urquhart (2022). This classification includes eight wallet groups, ranging from small wallets holding less than 0.1 ETH to the largest wallets, which exceed 100,000 ETH. The figure shows that large wallets have held the majority of the ETH supply throughout Ethereum’s entire history.
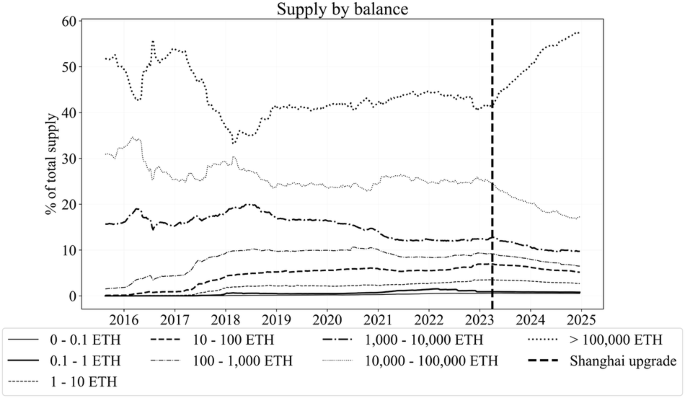
Each line represents the percentage of total ETH held by different wallet groups. For example, one line shows the percentage held by all wallets with balances between 0 and 0.1 ETH. The vertical dotted line indicates the moment of the Shanghai upgrade, which allowed for the withdrawal of staked ETH. Following this upgrade, the percentage of ETH held by the largest group, which includes the Beacon Chain, increases significantly compared with all other groups. This finding suggests that users staked more ETH after the Shanghai upgrade, gaining confidence in their ability to withdraw their ETH at any time, than they did before the Shanghai upgrade.
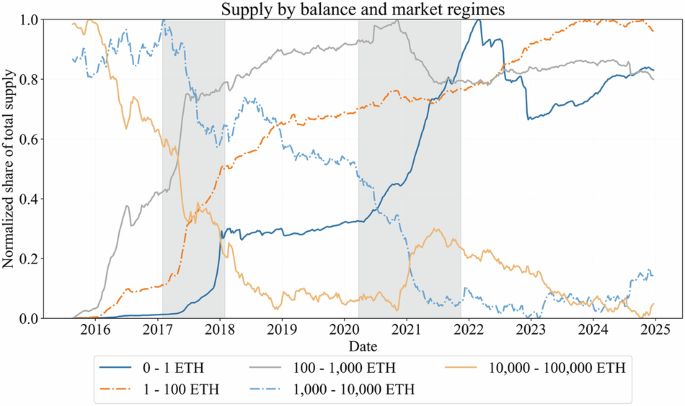
Figure 5 depicts the share of total ETH supply held by different aggregated categories over time.
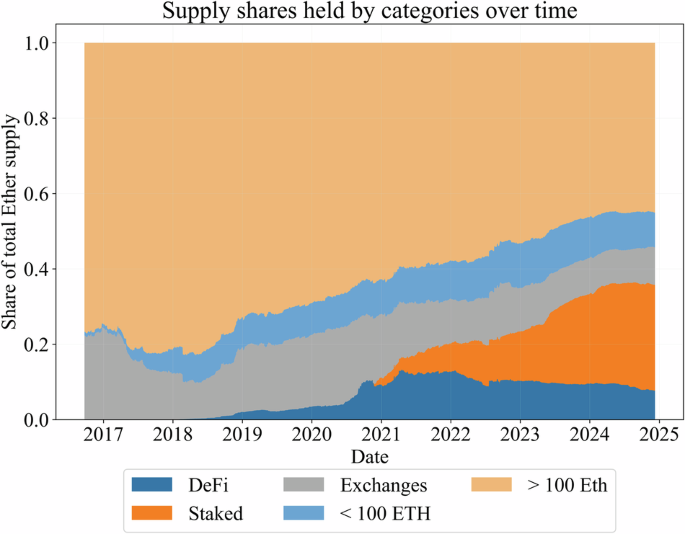
This figure displays the normalized share of ETH held by five disjoint wallet categories from 2016 to 2024. The x-axis represents time, and the y-axis represents the normalized share amount (0–1). The “DeFi� group includes lending protocols, WETH supply, and supply on bridges; the “Exchange� group includes CEX-related wallets; and the “Staked� group includes all staked ETH. The “ >100 ETH� group includes all remaining wallets holding more than 100 ETH. The “ <100 ETH� group includes all remaining wallets whose holdings are less than 100 ETH.
There is a significant shift in wallet dominance during the 2017–2018 bull market. All wallet groups holding less than 100,000 ETH experience an increase in relative supply, whereas those holding more than 100,000 ETH experience a continuous decrease.
From approximately 2020 onward, the data show a slow reversion of the trend—an uptick in supply held by the 100,000+ ETH addresses and a corresponding decline in smaller wallet groups. This phase coincides with the surge in DeFi applications and the associated use of WETH, as shown in Fig. 5.
Furthermore, in late 2020, the Beacon Chain was launched in parallel with the Ethereum mainnet to transition Ethereum’s consensus mechanism from PoW to PoS (Foundation 2023, Kapengut and Mizrach 2023). Users could lock their ETH for staking in the Beacon deposit contract, which quickly reached a balance of more than 2 million ETH by January 2021, which explains the gradual redistribution of ETH from smaller groups to the 100,000+ ETH group at that time, as is also visible in Fig. 5.
The decline in the relative holdings of the largest wallet group is particularly evident following a series of black swan events in mid-to-late 2022. These events include the collapse of Terra Luna (Liu et al. 2023), the bankruptcy of Celsius (Knauth 2023) shortly thereafter, and the bankruptcy of FTX (Davis 2023) in November 2022.
In April 2023 (see the vertical dashed line in Fig. 4), the largest wallet group begins to accumulate ETH from other groups. In line with the Ethereum Shanghai upgrade (Nijkerk 2023), stakers can now withdraw ETH for the first time. Moreover, the Shanghai upgrade completes Ethereum’s PoW-to-PoS transition. Staking significantly increases after this completion, despite the Ethereum community’s prediction that stakers will liquidate their ETH. Instead, investors know that they can withdraw their stakes if needed, thus improving the safety and flexibility of staking. To evaluate the impact of the events in the Shanghai upgrade, we performed a Chow test to identify potential structural breaks in staking flows. The results strongly support the presence of a structural break at the time of the upgrade. The test produced a Chow test statistic of 92.42, far exceeding the critical value of 3.00 at a 95% confidence level, with a p-value of 1.1 × 10−16.
When examining the HHI over Ethereum’s history, as shown in Fig. 6, we observe a significant decrease, indicating less concentration, from 2017 to 2018. This decrease is followed by a rise in concentration until mid-2020, after which the HHI decreases again. The gray highlighted areas represent bull markets from January 2017 to January 2018 and April 2020 to November 2021, both of which are closely associated with BTC and ETH price bubbles (Náñez Alonso et al. 2024). Notably, PoS protocol updates appear to have had a minimal effect on HHI trends, with market phases playing a more significant role. Bull markets tend to coincide with lower HHI values, reflecting greater decentralization, whereas bear markets coincide with an increase in concentration.
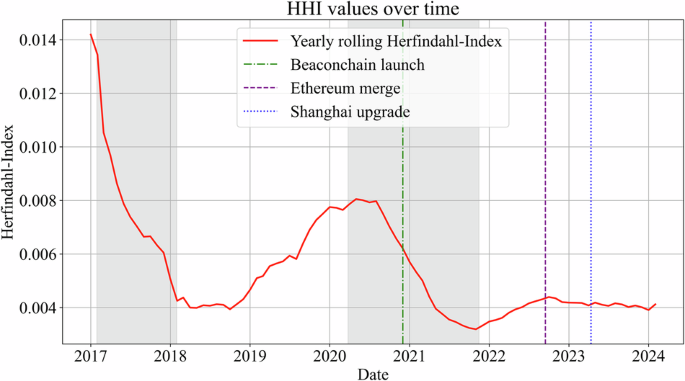
This figure tracks the HHI for Ethereum wallets holding over 0.001 ETH, illustrating changes in the concentration of holdings. The gray shaded areas highlight Ethereum bull markets with rapid price increases, whereas the vertical lines mark key milestones in Ethereum’s transition to PoS. The Beacon Chain launch in December 2020 introduced the PoS consensus mechanism, enabling ETH staking and laying the groundwork for future upgrades. “The Merge� in September 2022 unified the Beacon Chain with Ethereum’s mainnet, completing the network’s shift from energy-intensive PoW to PoS and drastically reducing energy usage. The Shanghai upgrade in April 2023 allowed stakers to withdraw their staked ETH and rewards for the first time, improving liquidity while maintaining network security. A lower HHI value in the chart reflects decreasing concentration and a more decentralized distribution of ETH holdings over time.
Figure 7 is a visual representation of the normalized ([0;1]) relative supply balance changes for the following five wallet groups: 0–1 ETH, 1–100 ETH, 100–1,000 ETH, 1,000–10,000 ETH, and 10,000–100,000 ETH. By setting the threshold to 100,000 ETH, an estimated valuation of US$230 million at December 2023 prices, this study deliberately focuses on a segment that excludes the balances of large protocols and exchange wallets that make up a significant portion of Ethereum’s total supply; the plotted data consider only the relative supply share of all wallets with fewer than 100,000 ETH.
This figure displays the normalized supply share of various wallet groups holding fewer than 100,000 ETH over time. The x-axis represents the period from 2016 to 2024, whereas the y-axis represents the normalized share of total supply held by these groups relative to all wallets holding less than 100,000 ETH. The gray shaded areas highlight the Ethereum bull markets, characterized by drastic price increases. The figure reveals the dynamics of ETH distribution among wallet groups across different market cycles.
Until 2020, all wallet groups holding 1000 ETH or less exhibit similar relative supply curves, with a drastic increase during the 2017 bull market. Moreover, wallets holding more than 1000 ETH exhibit a sharper decrease in supply share than do other wallets.
Between the two bull market periods, there is a noticeable adjustment in the supply distribution. All three wallet groups holding fewer than 1000 ETH exhibit a reduction in growth and show signs of only slight accumulation. Wallets holding 1000 to 10,000 ETH even increase their share in the first half of 2018 but continue their reduction from that point onward. The share of the 10,000–100,000 ETH group continues to decrease until 2019 but then remains constant until late 2020.
From late 2020 onward, as the price of ETH increases, the data indicate a negative trend in the holdings of larger wallets, except for those wallets holding more than 10,000 ETH. Simultaneously, smaller wallet holdings are increasing dramatically in proportion, equivalent to the 2017 bull cycle. This finding suggests that there is an increase in retail participation or investment during periods of market optimism.
Causal inference analysis
The flow matrix (Table 2) prior to the Beacon Chain launch highlights the dominance of CEXs and large holders (>100 ETH) in the redistribution of ETH. Each entry in the flow matrix represents the average weekly percentage of the total ETH supply flowing from one category (rows) to another category (columns) during the specified period. Sizable flows emerge from > 100 ETH toward CEXs and DeFi (0.1133% and 0.0351%, respectively), indicating the early engagement of large holders with both custodial and decentralized platforms. Conversely, smaller holders (<100 ETH) show minimal interaction, with only small flows to CEXs and DeFi (both under 0.003%). This period thus reflects the prestaking environment where ETH remains predominantly in larger wallets or centralized custodial services.
Following the Beacon Chain launch, the introduction of staking significantly alters the redistribution dynamics. Flows into the “Staked� category become prominent, with the majority originating from the > 100 ETH group. Notably, flows from >100 ETH into Staked rise from effectively zero to 0.0445% per week and then further to 0.0841% (+89%) after the Shanghai upgrade. CEXs begin offering custodial staking services and thereby directing flows to Staked, a figure that increases by more than 10% (to 0.0325%) after the Shanghai upgrade. Moreover, smaller holders (<100 ETH) clearly increase their degree of staking participation, with flows to Staked jumping more than threefold (from 0.0057% to 0.0195% weekly). Flows from > 100 ETH to DeFi also grow considerably (e.g., from 0.0351% to 0.0586%), highlighting increased DeFi participation among large holders. This redistribution is also evident in the area plot of holdings across categories (Fig. 5), where a steady rise in staked ETH corresponds to decreases in exchange holdings and large wallet balances.
The PCMCI results during this period, visualized in the directed acyclic graph (DAG) for pre-Shanghai upgrade (Fig. 8), provide critical insights into the associated causal relationships. Strong negative correlations are observed between >100 ETH and CEXs (val = −0.597) and between > 100 ETH and DeFi (val = −0.625), indicating redistribution away from large wallets and toward CEXs and DEXs. A significant causal link from CEXs to DeFi (val = −0.231) highlights that ETH flows from CEXs to DeFi protocols. The self-reinforcing link in Staked (val = 0.326) highlights the persistence of staking inflows, suggesting that the introduction of staking creates a stable mechanism for ETH redistribution, concentrating a significant portion of the supply in validator nodes.
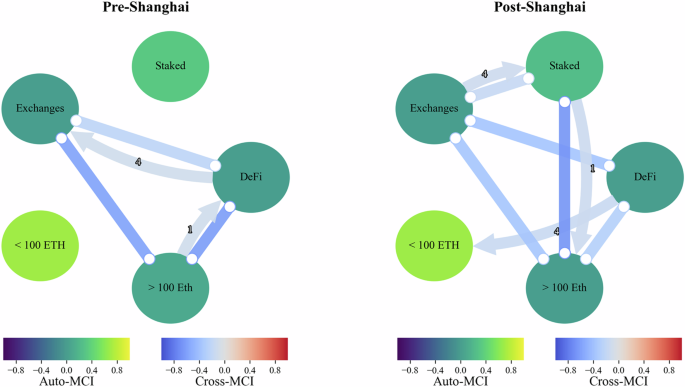
This figure illustrates the structural relationships among Ethereum wallet categories derived using PCMCI analysis. Each graph represents the state before and after the Shanghai upgrade, with node colors corresponding to Auto-MCI values (indicating the importance of self-dependencies within categories) and edge colors representing Cross-MCI values (indicating the strength of relationships between categories). The left graph, labeled “Pre-Shanghai,� highlights connections before the Ethereum Shanghai upgrade, whereas the right graph, “Post-Shanghai,� captures relationships after the upgrade. The thickness of the edges represents the magnitude of the Cross-MCI values, with darker edges signifying stronger relationships.
After the Shanghai upgrade, the ability to withdraw staked ETH introduces new dynamics. The flow matrix reveals substantial outflows from the “Staked� category to > 100 ETH and DeFi, indicative of large holders reclaiming their staked ETH and possibly reinvesting it in decentralized protocols. Flows from Exchanges to Staked (val = −0.175) and from Staked to Exchanges (val = −0.175) suggest an increased number of interactions between staking and exchange platforms. The flows to DeFi from Staked and >100 ETH align with increased activity in DeFi, suggesting that DeFi absorbs a portion of the withdrawn ETH. Smaller holders (<100 ETH) continue to exhibit limited direct interaction with Staked but show marginal increases in flows to DeFi, reflecting their preference for custodial or intermediary staking solutions. These trends are mirrored in the area plot (Fig. 5), which shows a stabilization in staked ETH balances post-Shanghai upgrade, as withdrawn funds are redistributed.
The DAG for the post-Shanghai upgrade (Fig. 8) reveals significant causal links that underline these findings. Staked ETH exhibits stronger negative correlations with > 100 ETH (val = −0.670) and DeFi (val = −0.670), confirming the hypothesis that ETH withdrawn from staking is actively reinvested or redistributed. Self-reinforcing trends within Staked (val = 0.246) persist, suggesting that while withdrawals occur, staking remains a key mechanism for securing the network and redistributing supply. Furthermore, the stronger link from DeFi to < 100 ETH (val = −0.160) implies that smaller holders are engaging more actively in decentralized ecosystems, likely through intermediary staking services or liquid staking derivatives.
Staking decentralization trends
The dynamics of ETH staking reveal significant trends in decentralization over time. Using cumulative data on staked ETH by entity and the corresponding Gini coefficient for staking distribution (Figs. 9, 10), we observe an increasing diversification of entities participating in staking, accompanied by a gradual decrease in the Gini coefficient. These findings suggest that while staking remains partially concentrated among major players, new entities contribute to a more decentralized staking landscape.
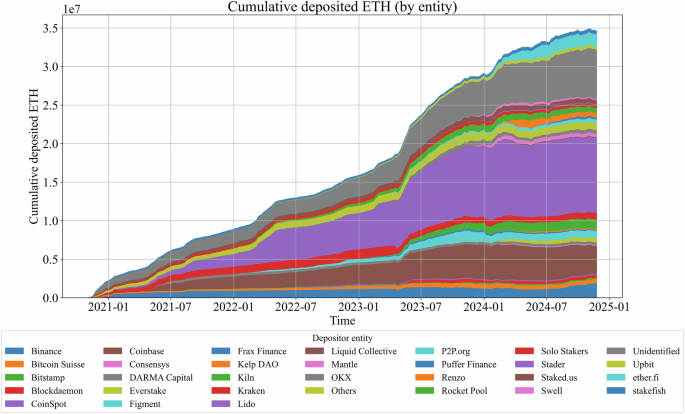
This stacked area chart represents the cumulative amount of ETH deposited by various staking entities from 2021 to 2025. The x-axis denotes the time, whereas the y-axis represents the total amount of ETH deposited. Different colored areas correspond to specific depositor entities, such as Lido, Coinbase, Binance, Rocket Pool, and others, along with categories for solo stakers and unidentified contributors. This figure highlights growth trends across entities, with notable increases in cumulative deposits over time, especially after major Ethereum events such as the Shanghai upgrade in April 2023. This figure underscores the dominance of certain entities, such as Lido, Coinbase, and Binance, while also exhibiting diversification in staking activity through smaller providers and solo stakers.
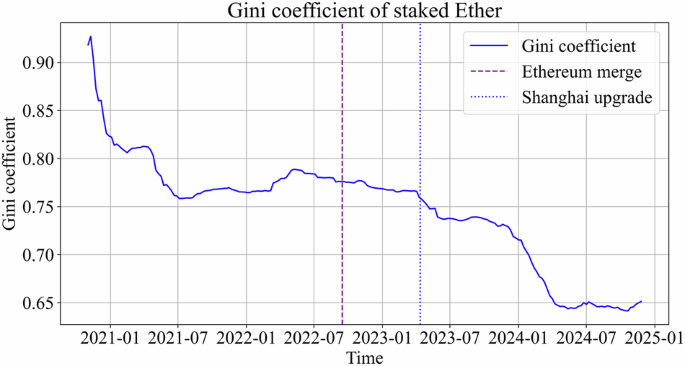
This line chart depicts the Gini coefficient for staked ETH among entities from 2021 to 2025. The x-axis represents the time, whereas the y-axis shows the Gini coefficient values, which measure inequality in ETH staking distribution across entities. This figure reveals a decreasing trend in the Gini coefficient over time, indicating a reduction in the concentration of staked ETH. Significant decreases are observed around key Ethereum events, such as the Shanghai upgrade, suggesting an increase in the degree of staking decentralization.
The stacked area plot (Fig. 9) shows a steady rise in total staked ETH since the Beacon Chain launch, with a dominance of Lido, Coinbase, Kraken, and Binance. Lido’s staking dominance is particularly noteworthy, as its cumulative share approaches a critical threshold of one-third of the total staked ETH, a point that can pose risks to Ethereum’s network decentralization and security. Nevertheless, the presence of newer and smaller staking entities has steadily increased, as evidenced by the broadening of the lower segments in the stacked plot. These smaller entities play a vital role in mitigating the overconcentration of staking power.
The Gini coefficient for staked ETH (Fig. 10) further underscores this trend. The coefficient decreases consistently over time, reflecting less concentration of staked ETH across a growing number of entities. The downward trajectory suggests that Ethereum’s staking mechanism is becoming less centralized, with more participants contributing to the network’s security. However, the data also highlight that a substantial portion of staked ETH remains managed by dominant players, including Lido and CEXs, which collectively control a significant share of the staked ETH.
Several factors contribute to this observed concentration. Staking services such as Lido simplify the staking process by offering immediate activation and liquid staking derivatives, making them attractive options for participants who are unwilling or unable to meet the operational requirements of solo staking. Additionally, large entities benefit from economies of scale, as they can amortize hardware costs across multiple validators, creating an inherent advantage over smaller participants. Congestion in the validator activation queue exacerbates this disparity, as solo stakers often face significant delays, whereas staking services enable near-instant participation (Grandjean et al. 2023).
Despite these challenges, the growth of smaller staking entities represents positive development for Ethereum decentralization. Incentivizing solo staking, as noted by Grandjean et al. (2023), and promoting competition among staking providers remain critical for countering the potential risks posed by the dominance of major players. While the observed trends indicate progress toward more decentralization, further measures to ensure a balanced and decentralized staking ecosystem will be crucial as Ethereum continues to evolve.
Discussion and conclusions
In our static analysis, in line with prior studies (Sai et al. 2021b), we find a high concentration of ETH, with approximately 0.3% of the addresses holding nearly 95% of the total supply (holding over 10 ETH). An inverse relationship is also evident; smaller wallets, despite comprising the majority of addresses, hold only a small fraction of the total ETH supply. As the CEX wallets, bridges, Beacon Chain contracts, and WETH contracts consolidate the distribution of many individual investors’ funds, this may add to the impression of high degrees of concentration. However, even after excluding CEXs, smart contract wallets, and other nonindividual wallets by considering only unlabeled wallets, the Gini coefficient remains high, between 0.9 and 0.95, depending on the inclusion criteria used. The log-normal distribution provides the best fit across all the metrics for the bottom 99% of wallets ranked by ETH balance. The Pareto distribution exhibits the best fit for the top 1% of wallets. While the log-normal distribution underestimates the upper quantiles, the Pareto distribution closely aligns with the observed data, particularly at the highest wallet balances. Fitting a power-law distribution to the tail yields an alpha value of 1.79, which is consistent with the heavy-tailed characteristics of wealth distributions in economies (Chancel et al. 2021).
Our findings reveal fewer observations in the upper tails than suggested by parametric models, yet the distribution of ETH holdings broadly resembles that of wealth and income studies in developed economies typically seen in the literature (Clementi and Gallegati 2005, Hlasny 2021, Rodriguez Palenzuela et al. 2016). Specifically, we observe a log-normal body with Pareto-like tails. The power-law exponent of α = 1.7 aligns with the heavy-tailed behavior commonly reported for wealth distributions in traditional economies (Sinha 2006). These patterns reflect broader debates on economic inequality, where a small fraction of participants tend to control a disproportionate share of total wealth (Autor et al. 2008, Piketty and Goldhammer 2014).
The log-normal nature of ETH holdings can be explained by the log-normally distributed income of investors, who channel a portion of their earnings into cryptocurrency (Rodriguez Palenzuela et al. 2016). Over time, early adopters benefit disproportionately from price appreciation, widening the gap between first movers and later entrants. This phenomenon resonates with Piketty’s fundamental inequality that wealth (or assets) can accumulate faster than can broader economic growth (Piketty and Goldhammer 2014). Furthermore, multiplicative processes such as staking or liquidity provision amplify existing holdings and converge to a log-normal pattern under Gibrat’s law, akin to the growth processes observed in firm size (Sutton 1997). Fixed gas costs within Ethereum may additionally disadvantage smaller holders, a factor that can exacerbate distributional disparities (Cong et al. 2023). Overall, despite concerns raised by extremely high Gini coefficients in blockchains (Sai et al. 2021b), our results indicate that ETH distribution does not markedly deviate from traditional wealth distributions in advanced economies; thus, H1 is not rejected.
The results of our dynamic analysis indicate a nuanced but overall decentralizing trajectory in ETH distribution. This evolution unfolds alongside recurrent periods of wealth redistribution that frequently coincide with market phases, reflecting the cyclical nature of economic systems (Campbell 2006, Merton 1971). Bull markets, often accompanied by newcomers purchasing ETH and larger holders realizing profits, tend to amplify decentralization. In contrast, bear markets see larger entities consolidating their positions, mirroring real-world cycles, where long-term participants accumulate assets during downturns (Caballero and Krishnamurthy 2008). Such cyclical patterns suggest that Ethereum’s broader distributional trends align with well-documented phenomena in traditional economies (Gilens and Page 2014, Piketty and Goldhammer 2014).
A notable factor in the redistribution of ETH is the increasing importance of staking. Initially dominated by CEXs and large wallets, staking has diversified as more participants have entered the network, particularly through liquid staking derivatives and pooled services. Despite concerns that staking may further centralize ETH holdings (Grandjean et al. 2023, Urquhart 2022), ongoing declines in the Gini coefficient highlight a gradual broadening of validator participation. Major custodians and liquid staking providers still command a substantial share of staked ETH, but the simultaneous rise of smaller entities demonstrates that the consensus layer is moving toward a more distributed security model.
The interplay between DeFi and staking also bolsters this decentralizing effect. After the Shanghai upgrade, flows from staked ETH to DeFi became more pronounced. Smaller holders often participate indirectly, leveraging intermediary or pooled staking solutions, thereby gaining access to network rewards without the operational burden of running their own validators. This reinvestment in decentralized protocols underscores how technological advancements can mitigate at least some of the centralizing forces inherent to capital accumulation.
Ultimately, while ETH’s distribution still exhibits bursts of concentration, particularly during market downturns and within prominent staking service providers, our analysis reveals a slight alleviation of concentration over time. In particular, the average rising price of ETH appears to incentivize the redistribution of ETH from large wallets to smaller wallets. Therefore, our study rejects H2. Rather, our results reaffirm that Ethereum’s transition to PoS, along with recent changes in token governance for the Ethereum blockchain, provide evidence of a decentralizing effect in Ethereum and correct the general notion of extreme wealth concentration in Ethereum (in terms of the Gini coefficient).
This study provides a comprehensive analysis of ETH wealth concentration trends, emphasizing the complex interplay among market cycles, protocol upgrades, and DeFi activities. While the findings support the hypothesis that ETH holdings are becoming less concentrated over time, the results also reveal significant centralization that warrants further investigation. In light of broader economic theory, Ethereum offers a unique lens through which to observe how emerging financial technologies can simultaneously disrupt and mirror traditional wealth distribution patterns.
Data availability
The Etherscan labels used in this study can be obtained from a publicly accessible repository at the following link: https://github.com/brianleect/etherscan-labels?tab=readme-ov-file. Data from walletslabels.xyz can be made available upon request. Google BigQuery data can be queried directly at https://bigquery.cloud.google.com/dataset/bigquery-public-data (paid query, dataset ID: bigquery-public-data.crypto_ethereum). Santiment data can be fetched via API from https://santiment.net/; however, a paid subscription is necessary for access. Dune Analytics data can be fetched via API from https://dune.com/ or made available upon request.
References
-
Abdulhakeem SA, Hu Q (2021) Powered by blockchain technology, defi (decentralized finance) strives to increase financial inclusion of the unbanked by reshaping the world financial system. Mod Econ 12(1):1
-
Adegbite A (2024) The role of blockchain technology in enhancing financial inclusion. IOSR J Econ Financ 15. https://doi.org/10.9790/5933-1505071928
-
Alfani G (2024) Inequality in history: A long-run view. Journal of Economic Surveys. Wiley Online Library, New York
-
Atkinson AB (2016) Inequality: What can be done. Practice 40(2):289–292
-
Autor D (2015) Why are there still so many jobs? The history and future of workplace automation. J Econ Perspect 29(3):3–30
-
Autor DH, Katz LF, Kearney MS (2008) Trends in U.S. wage inequality: Revising the revisionists. Rev Econ Stat 90(2):300–323
-
Benhabib J, Bisin A, Zhu S (2011) The distribution of wealth and fiscal policy in economies with finitely lived agents. Econometrica 79(1):123–157
-
Blesch K, Hauser OP, Jachimowicz JM (2022) Measuring inequality beyond the Gini coefficient may clarify conflicting findings. Nat Hum Behav 6(11):1525–1536
-
Boghosian BM (2019) Is inequality inevitable? Sci Am 321:70–77
-
Brynjolfsson E, McAfee A (2014) The Second Machine Age: Work, Progress, and Prosperity in a Time of Brilliant Technologies. W. W. Norton & Company
-
Caballero RJ, Krishnamurthy A (2008) Collective risk management in a flight to quality episode. J Financ 63(5):2195–2230
-
Calvo P (2024) Cryptoart: ethical challenges of the NFT revolution. Humanit Soc Sci Commun 11:370
-
Campbell JY (2006) Household finance. J Financ 61(4):1553–1604
-
Capponi A, Olafsson S, Alsabah H (2023) Proof-of-work cryptocurrencies: Does mining technology undermine decentralization? Manag Sci 69(11):6455–6481
-
Carlton DW (2010) Revising the horizontal merger guidelines. J Compet Law Econ 6(3):619–652
-
Chancel L, Piketty T, Saez E et al. (2021) World inequality report 2022. https://wir2022.wid.world
-
Chetty R, Hendren N, Kline P (2014) Where is the land of opportunity? The geography of intergenerational mobility in the United States. Q J Econ 129(4):1553–1623
-
Chiarella C, Dieci R, Gardini L (2006) Asset price and wealth dynamics in a financial market with heterogeneous agents. J Econ Dyn Control 30(9-10):1755–1786
-
Clementi F, Gallegati M (2005) Pareto’s law of income distribution: Evidence for Germany, the United Kingdom, and the United States. In: Econophysics of Wealth Distributions: Econophys-Kolkata I, 3–14
-
Cong LW, He Z (2019) Blockchain disruption and smart contracts. Rev Financ Stud 32(5):1754–1797
-
Cong LW, He Z, Li J (2021) Decentralized mining in centralized pools. Rev Financ Stud 34(3):1191–1235
-
Cong LW, Tang K, Wang Y et al. (2023) Inclusion and democratization through web3 and defi? Initial evidence from the Ethereum ecosystem. Technical report, National Bureau of Economic Research Cambridge, MA, USA
-
Cong LW, Giesecke K, Kuhnen C (2024) Call for papers—Management Science virtual special issue on digital finance. Manag Sci 70(8):Vi–Vii
-
Davis D (2023) Forbes. https://forbes.com/sites/darreonnadavis/2023/06/02/what-happened-to-ftx-the-crypto-exchange-funds-collapse-explained/
-
DefiLlama (2024) Defillama. https://defillama.com/chains, accessed: 2024-12-30
-
Demirgüç-Kunt A, Klapper L, Singer D et al. (2018) The Global Findex Database 2017: Measuring Financial Inclusion and the Fintech Revolution. World Bank, Washington, DC, https://doi.org/10.1596/978-1-4648-1259-0, license: Creative Commons Attribution CC BY 3.0 IGO
-
Dorfman R (1979) A formula for the Gini coefficient. Rev Econ Stat 61(1):146–149
-
Foundation E (2023) The beacon chain. https://ethereum.org, accessed: 2023-12-30
-
Gilens M, Page BI (2014) Testing theories of American politics: Elites, interest groups, and average citizens. Perspect Politics 12(3):564–581
-
Goldstein ML, Morris SA, Yen GG (2004) Problems with fitting to the power-law distribution. Eur Phys J B – Condens Matter Complex Syst 41:255–258
-
Grandjean D, Heimbach L, Wattenhofer R (2023) Ethereum proof-of-stake consensus layer: Participation and decentralization. https://example.com, accessed: 2023-12-30
-
Hlasny V (2021) Parametric representation of the top of income distributions: Options, historical evidence, and model selection. J Econ Surv 35(4):1217–1256
-
Iansiti M, Lakhani KR (2017) The truth about blockchain. Harv Bus Rev 95(1):118–127
-
Kapengut E, Mizrach B (2023) An event study of the ethereum transition to proof-of-stake. Commodities 2(2):96–110
-
Knauth D (2023) Crypto lender celsius network cleared to exit bankruptcy. https://reuters.com/markets/deals/crypto-lender-celsius-network-cleared-exit-bankruptcy-2023-11-09/, accessed: 2023-12-30
-
Liu J, Makarov I, Schoar A (2023) Anatomy of a Run: The Terra Luna Crash, April 2023. NBER Working Paper Series https://nber.org/papers/w31160
-
Malcai O, Biham O, Richmond P (2002) Theoretical analysis and simulations of the generalized lotka-volterra model. Phys Rev E 66(3):031102
-
Merton RC (1971) Optimum consumption and portfolio rules in a continuous-time model. J Econ Theory 3(4):373–413
-
Milanovic B (2016) Global inequality: a new approach for the age of globalization. Harvard University Press
-
Nadler M, Schär F (2020) Decentralized finance, centralized ownership? An iterative mapping process to measure protocol token distribution. arXiv preprint arXiv:2012.09306
-
Nijkerk M (2023) Ethereum’s shanghai upgrade. Accessed: 2023-12-30, https://coindesk.com/tech/2023/04/12/ethereums-shanghai-upgrade-activates-starting-new-era-of-staking-withdrawals/
-
Náñez Alonso SL, Jorge-Vázquez J, Echarte Fernández M (2024) Bitcoin’s bubbly behaviors: does it resemble other financial bubbles of the past? Humanit Soc Sci Commun 11:715
-
Pareto V (1964) Cours d’économie politique, vol 1. Librairie Droz
-
Pickett K, Wilkinson R (2014) Income inequality and health: A causal review. Soc Sci Med 128(12):316–326
-
Piketty T, Goldhammer A (2014) Capital in the Twenty-First Century. Harvard University Press
-
di Prisco D, Strangio D (2021) Technology and financial inclusion: A case study to evaluate potential and limitations of Blockchain in emerging countries. Technol Anal Strat Manag 37(4):448–461. https://doi.org/10.1080/09537325.2021.1944617
-
Palenzuela DR, Dees S, others (2016) Savings and investment behaviour in the euro area. ECB Occasional Paper 167:40–62
-
Roşu I, Saleh F (2021) Evolution of shares in a proof-of-stake cryptocurrency. Man Sci 67(2):661–672
-
Runge J (2018) Causal network reconstruction from time series: From theoretical assumptions to practical estimation. Chaos: Interdiscip J Nonlinear Sci 28(7):075310
-
Runge J, Nowack P, Kretschmer M (2019) Detecting and quantifying causal associations in large nonlinear time series datasets. Sci Adv 5(11):EAAU4996
-
Saez E, Zucman G (2016) Wealth inequality in the united states since 1913: Evidence from capitalized income tax data. Q J Econ 131(2):519–578
-
Sai AR, Buckley J, Fitzgerald B (2021a) Taxonomy of centralization in public blockchain systems: A systematic literature review. Inf Process Manag 58(4):102584
-
Sai AR, Buckley J, Le Gear A (2021b) Characterizing wealth inequality in cryptocurrencies. Front Blockchain 4:730122
-
Samuelson PA (1972) A fallacy in the interpretation of Pareto’s law of alleged constancy of income distribution. Collected Sci Pap Paul Samuelson 3:408
-
Scheidel W (2017) The great leveler: violence and the history of inequality from the stone age to the twenty-first century. Princeton University Press
-
Shen X, Dai P (2024) A regression method for estimating Gini index by decile. Humanit Soc Sci Commun 11(1):1–8
-
Sinha S (2006) Evidence for power-law tail of the wealth distribution in india. Phys A: Stat Mech Appl 359:555–562
-
Stiglitz J (forthcoming 2025) The origins of inequality. Oxford University Press
-
Stiglitz JE (2012) The price of inequality: how today’s divided society endangers our future. W. W. Norton & Company
-
Sutton J (1997) Gibrat’s legacy. J Econ Lit 35(1):40–59
-
Urquhart A (2022) Under the hood of the ethereum blockchain. Fin Res Lett 47:102628
-
Victor F, Ruppel P, Küpper A (2021) A taxonomy for distributed ledger analytics. Computer 54:30–38
-
Wilkinson R, Pickett K (2009) The spirit level: why more equal societies almost always do better. Penguin
-
Wold HOA, Whittle P (1957) A model explaining the Pareto distribution of wealth. Econ J Econ Soc 25(4):591–595
-
Xiao A, Xu Z, Skare M (2024) Bridging the digital divide: the impact of technological innovation on income inequality and human interactions. Humanit Soc Sci Commun 11:809
Funding
Open Access funding enabled and organized by Projekt DEAL.
Author information
Authors and Affiliations
Contributions
Tom Celig: Conceptualization, Methodology, Formal Analysis, Investigation, Data Curation, Writing – Original Draft, Writing – Review & Editing, Visualization, Project Administration. Tim Alvaro Ockenga: Conceptualization, Methodology, Formal Analysis, Investigation, Writing – Original Draft, Writing – Review & Editing. Detlef Schoder: Conceptualization, Investigation, Writing – Original Draft, Writing – Review & Editing, Supervision. All authors have read and approved the final manuscript.
Corresponding authors
Ethics declarations
Competing interests
The authors declare no competing interests.
Ethical approval
This article does not contain any studies with human participants performed by any of the authors.
Informed consent
No informed consent was required for this article.
Additional information
Publisher’s note Springer Nature remains neutral with regard to jurisdictional claims in published maps and institutional affiliations.
Rights and permissions
Open Access This article is licensed under a Creative Commons Attribution 4.0 International License, which permits use, sharing, adaptation, distribution and reproduction in any medium or format, as long as you give appropriate credit to the original author(s) and the source, provide a link to the Creative Commons licence, and indicate if changes were made. The images or other third party material in this article are included in the article’s Creative Commons licence, unless indicated otherwise in a credit line to the material. If material is not included in the article’s Creative Commons licence and your intended use is not permitted by statutory regulation or exceeds the permitted use, you will need to obtain permission directly from the copyright holder. To view a copy of this licence, visit http://creativecommons.org/licenses/by/4.0/.
About this article
Cite this article
Celig, T., Ockenga, T.A. & Schoder, D. Distributional equality in Ethereum? On-chain analysis of Ether supply distribution and supply dynamics.
Humanit Soc Sci Commun 12, 408 (2025). https://doi.org/10.1057/s41599-025-04728-9
-
Received: 23 July 2024
-
Accepted: 10 March 2025
-
Published: 22 March 2025
-
DOI: https://doi.org/10.1057/s41599-025-04728-9
Search
RECENT PRESS RELEASES
Related Post


