Does Amazon.com (AMZN) Share Price Reflect Its Cloud And Advertising Growth Potential?
February 1, 2026
Advertisement
With Amazon.com’s stock often in the spotlight, you might be asking whether its current price fairly reflects the company’s strengths and risks, or if the market is missing something.
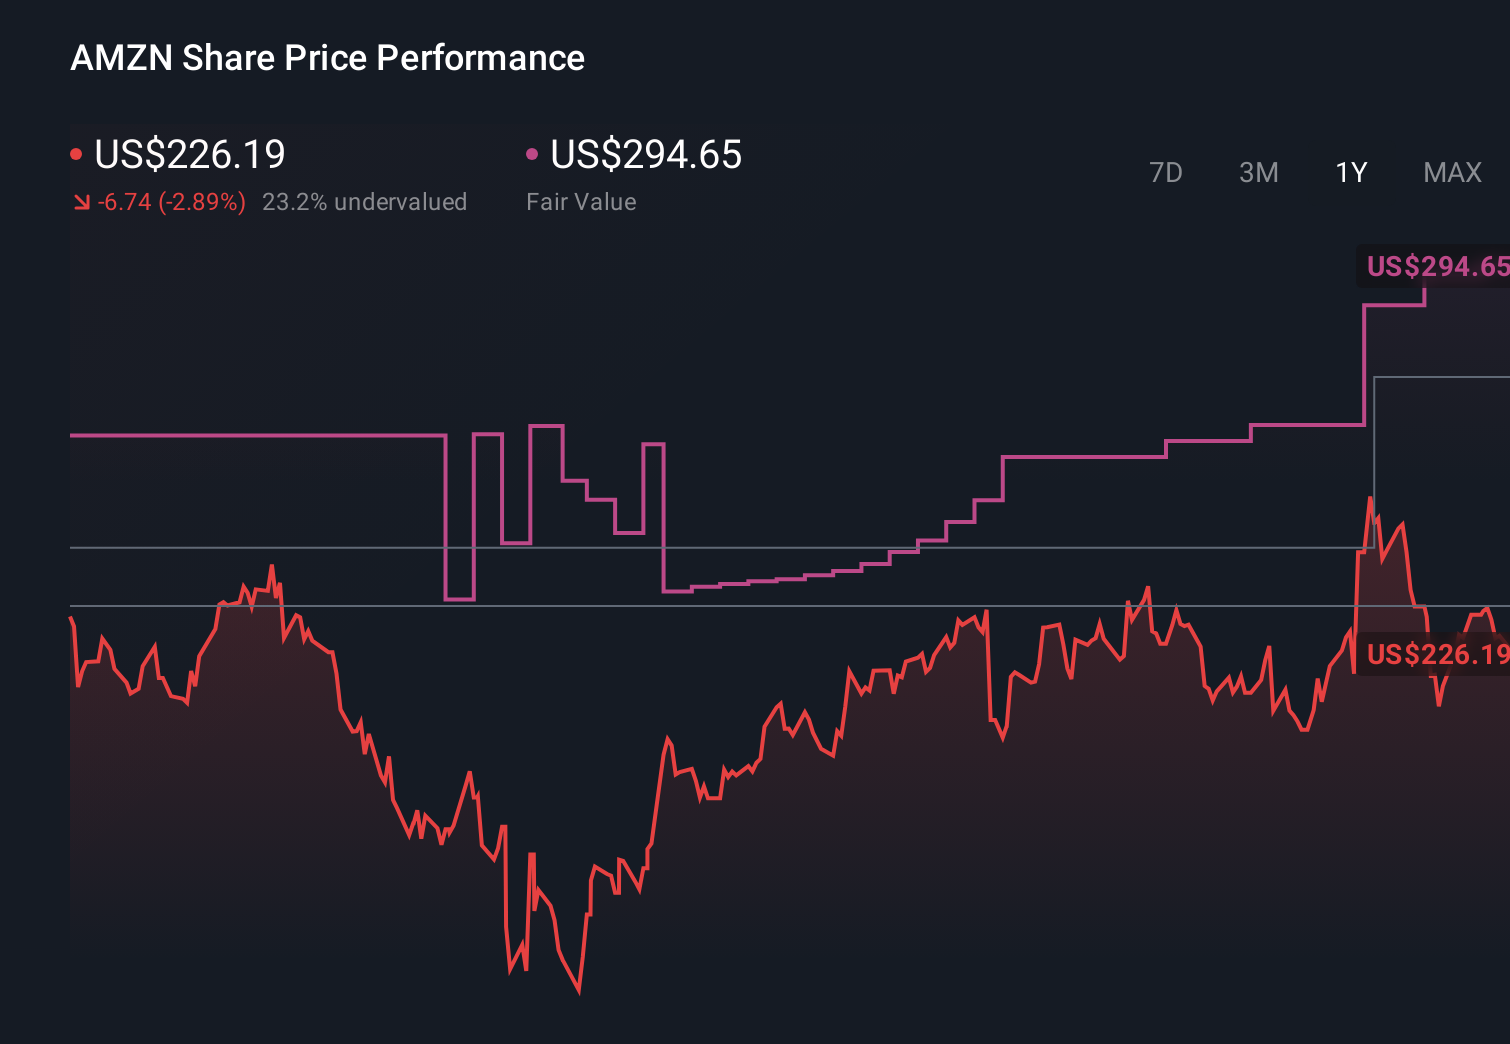
Over the last week the share price return was 0.1%, while the 30 day return sits at 5.7%, and the 1 year return is 0.7% against a much stronger 3 year return of 131.5% and a 5 year return of 42.8%. Recent performance therefore looks very different depending on the timeframe you focus on.
Recent news flow has focused on Amazon.com’s ongoing push to strengthen its core e commerce platform and expand its cloud and advertising businesses. These developments continue to shape how investors think about its long term earnings potential and competitive position. At the same time, updates around regulatory scrutiny and broader technology sector sentiment have influenced how markets are pricing risk in large US tech names, including Amazon.com.
On our valuation checks, Amazon.com currently has a score of 4 out of 6. Next we will look at what different valuation approaches say about that score, before finishing with a way of thinking about value that goes beyond any single model.
See our latest analysis for Amazon.com.
Find out why Amazon.com’s 0.7% return over the last year is lagging behind its peers.
Approach 1: Amazon.com Discounted Cash Flow (DCF) Analysis
A DCF model takes estimates of a company’s future cash flows, then discounts them back to today using a required rate of return to arrive at an intrinsic value per share.
For Amazon.com, the latest twelve month free cash flow is about $40.0b. Analysts have provided explicit forecasts out to 2030, with projected free cash flow of $189.8b in that year, and Simply Wall St extends the projections further using its own assumptions. These future cash flows, expressed in dollars, are then discounted using a 2 Stage Free Cash Flow to Equity framework.
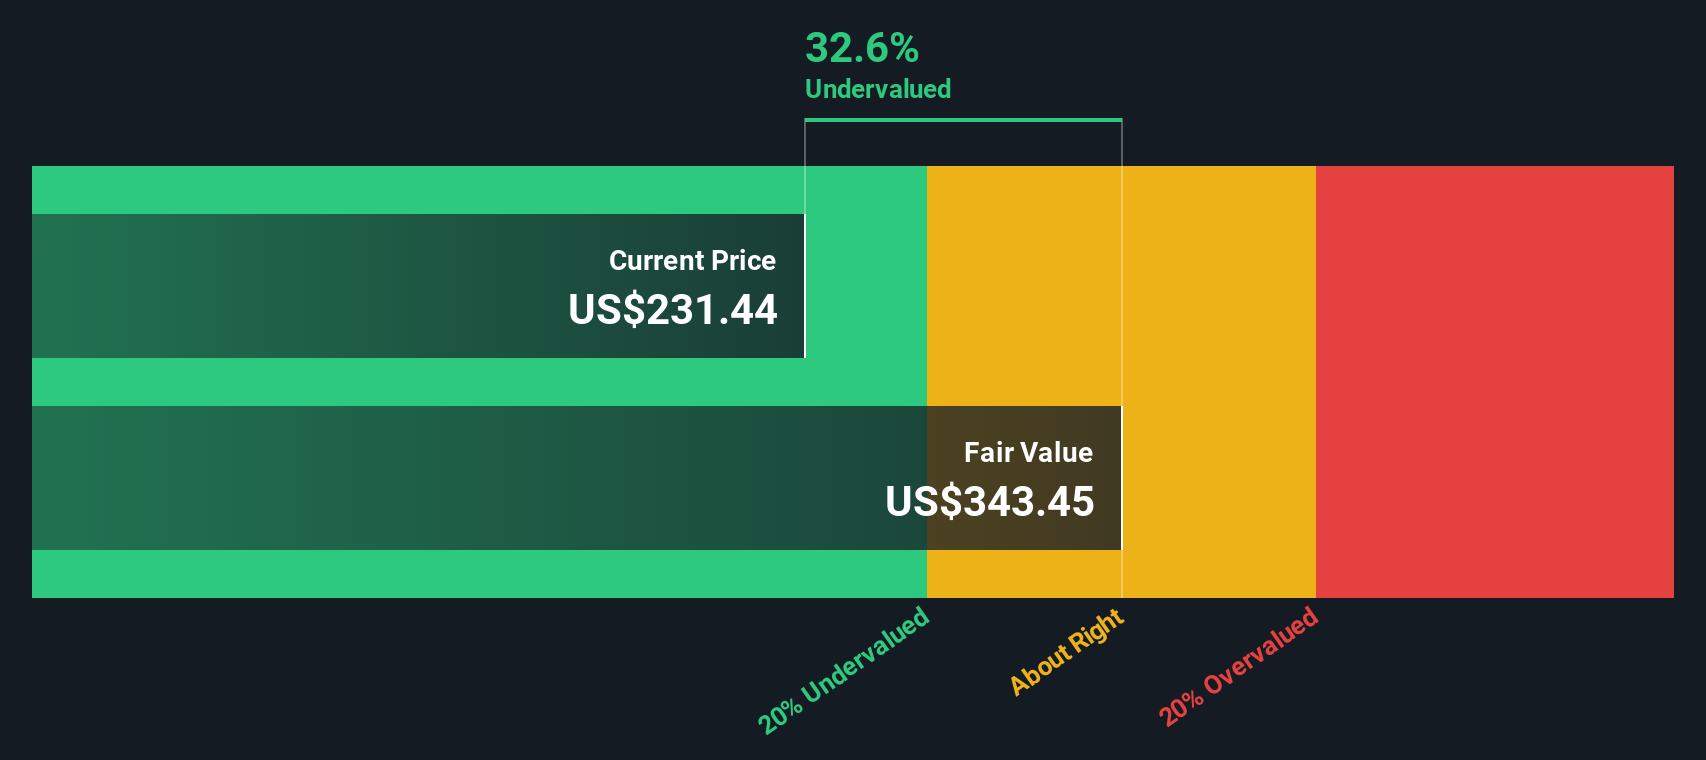
On this basis, the model arrives at an estimated fair value of $411.23 per share. Compared with the current share price, this implies an intrinsic discount of 41.8%, which points to the shares trading below this cash flow based estimate of value.
Result: UNDERVALUED
Our Discounted Cash Flow (DCF) analysis suggests Amazon.com is undervalued by 41.8%. Track this in your watchlist or portfolio, or discover 875 more undervalued stocks based on cash flows.
Approach 2: Amazon.com Price vs Earnings
For a profitable company like Amazon.com, the P/E ratio is a useful shorthand for how much investors are paying for each dollar of current earnings. It ties the share price directly to the bottom line, which is often where the market focuses first.
What counts as a “normal” P/E really depends on how quickly earnings are expected to grow and how risky those earnings look. Higher expected growth or lower perceived risk can support a higher multiple, while slower growth or higher uncertainty usually points to a lower one.
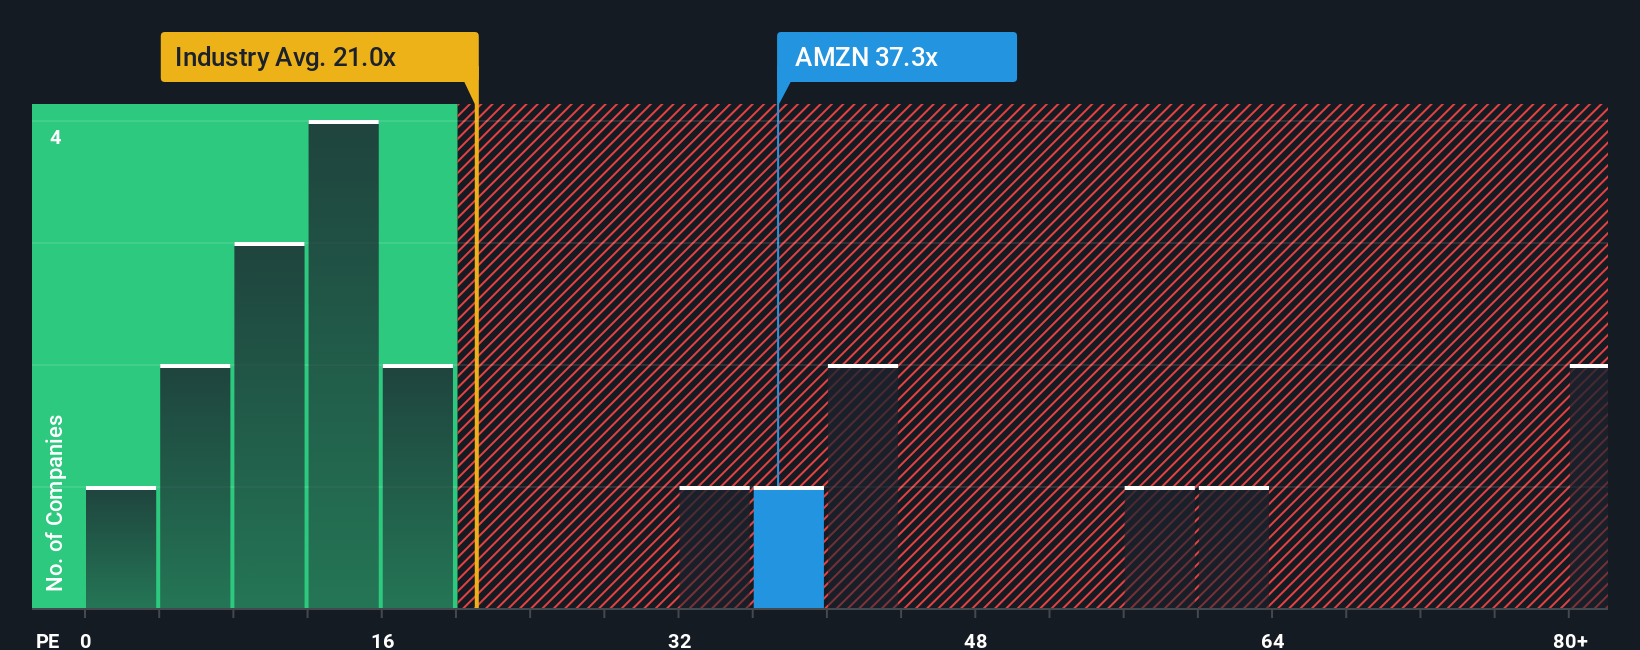
Amazon.com currently trades on a P/E of 33.45x, compared with an industry average of 19.78x for Multiline Retail and a peer group average of 32.95x. Simply Wall St’s Fair Ratio for Amazon.com is 42.71x. This Fair Ratio is a proprietary estimate of what the P/E might be, given factors such as earnings growth, profit margins, industry, market cap and key risks.
Because the Fair Ratio incorporates those company specific drivers, it can be more informative than a simple comparison with peers or the broad industry, which may have very different growth or risk profiles. With Amazon.com’s actual P/E sitting below the Fair Ratio, this framework points to the shares trading on a lower multiple than expected.
Result: UNDERVALUED
P/E ratios tell one story, but what if the real opportunity lies elsewhere? Discover 1426 companies where insiders are betting big on explosive growth.
Upgrade Your Decision Making: Choose your Amazon.com Narrative
Earlier we mentioned that there is an even better way to understand valuation, so let us introduce you to Narratives. These let you tell a clear story about Amazon.com by connecting your view of its business to your estimates for future revenue, earnings and margins, and then through to a fair value that you can compare with today’s share price. A Narrative on Simply Wall St’s Community page is your own structured storyline behind the numbers, linking what you believe about Amazon.com’s e commerce, cloud or advertising potential to a financial forecast and an implied fair value per share. Because Narratives on the platform are updated when new information such as news or earnings is added, you can see how your story and fair value move over time and decide whether the current price makes Amazon.com look attractive or expensive. For example, one investor might set very optimistic revenue growth and profit margin assumptions for Amazon.com, while another uses more cautious inputs, and their Narratives would naturally produce different fair values and decision points.
Do you think there’s more to the story for Amazon.com? Head over to our Community to see what others are saying!
This article by Simply Wall St is general in nature. We provide commentary based on historical data
and analyst forecasts only using an unbiased methodology and our articles are not intended to be financial advice. It does not constitute a recommendation to buy or sell any stock, and does not take account of your objectives, or your
financial situation. We aim to bring you long-term focused analysis driven by fundamental data.
Note that our analysis may not factor in the latest price-sensitive company announcements or qualitative material.
Simply Wall St has no position in any stocks mentioned.
New: Manage All Your Stock Portfolios in One Place
We’ve created the ultimate portfolio companion for stock investors, and it’s free.
• Connect an unlimited number of Portfolios and see your total in one currency
• Be alerted to new Warning Signs or Risks via email or mobile
• Track the Fair Value of your stocks
Have feedback on this article? Concerned about the content? Get in touch with us directly. Alternatively, email editorial-team@simplywallst.com
Search
RECENT PRESS RELEASES
Related Post


