Does Apple’s Latest AI News Signal a Fair Price for the Stock in 2025?
September 28, 2025
If you are staring at Apple’s stock chart and wondering, “Is now the moment to buy, sell, or simply hold on?” you are definitely not alone. Apple’s share price has recently swung upward, notching a 4.1% gain just over the past week and a 10.0% climb in the past month alone. Even on a longer horizon, Apple’s performance remains stellar, with a 132.4% surge in the last five years. This is proof enough that plenty of investors have profited by staying the course.
But there is more beneath the surface than just green arrows and headlines. Recent news around Apple’s foray into AI-powered features for Siri, and rumors of deeper partnerships in the world of semiconductor manufacturing, are clearly shifting how investors view the company’s future potential and risks. Add ongoing stories about labor conditions and visa policies, and it is clear that Apple still moves markets, sometimes for new technology excitement and sometimes for more complex reasons.
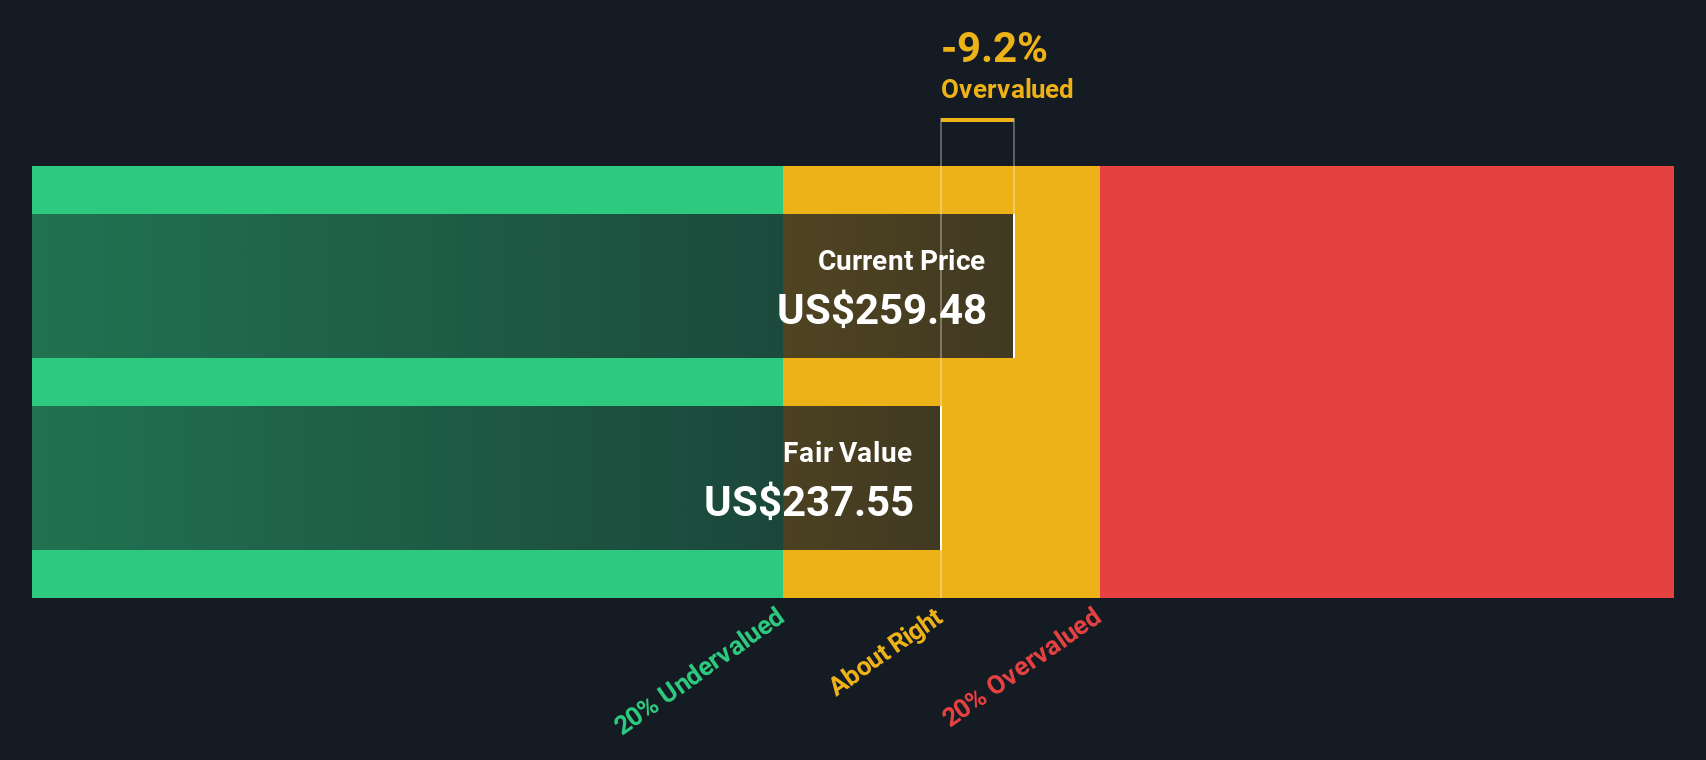
So, is Apple’s stock undervalued or overvalued right now? If we look at traditional valuation checks, Apple earns a value score of just 2 out of 6, suggesting it only passes a couple tests for being a bargain. In other words, this is not your classic “deep value” stock. Still, valuation is never a one-size-fits-all story. Next, let’s dig into these valuation methods, and later, I will share a more nuanced way to look at whether Apple stock is priced right for you.
Apple scores just 2/6 on our valuation checks. See what other red flags we found in thefull valuation breakdown.
Advertisement
Approach 1: Apple Discounted Cash Flow (DCF) Analysis
The Discounted Cash Flow (DCF) model is a method of estimating a company’s intrinsic value by projecting its future cash flows and discounting them back to today’s dollar value, taking into account the time value of money. For Apple, this analysis is based on a 2 Stage Free Cash Flow to Equity framework, which extrapolates near-term analyst forecasts and combines them with longer-term estimates.
Currently, Apple’s Free Cash Flow stands at $97.1 Billion. Analysts expect this number to steadily grow over the next decade, with projections showing Apple could reach $185.3 Billion in Free Cash Flow by 2029. Only five years of analyst estimates are available. After this period, further projections are generated algorithmically. Discounted free cash flows for each year reflect a consistent increase, indicating investor confidence in Apple’s continued ability to generate cash.
According to this DCF approach, Apple’s estimated intrinsic value per share is $263.30, which is about 3.0% above the current price. This suggests Apple is trading almost exactly in line with its underlying value.
Result: ABOUT RIGHT
Simply Wall St performs a valuation analysis on every stock in the world every day (check out Apple’s valuation analysis). We show the entire calculation in full. You can track the result in yourwatchlistorportfolioand be alerted when this changes.
Approach 2: Apple Price vs Earnings (PE Ratio)
For large, profitable companies like Apple, the Price-to-Earnings (PE) ratio is a widely used metric because it tells us how much investors are willing to pay for each dollar of current earnings. This is particularly useful when a company has a consistent track record of profitability, like Apple, making the PE ratio a straightforward way to compare value.
Growth expectations and risk profiles play a big part in what investors consider a “normal” or “fair” PE ratio. Companies with faster expected growth or lower risks often deserve a higher multiple. On the other hand, slower growth or higher uncertainty would mean a lower one is justified.
Apple currently trades at a PE ratio of 38.2x. This is above both the average for the broader Tech industry at 23.93x and the average of key listed peers at 34.87x. At first glance, this premium could look steep if you are only comparing to industry or peer benchmarks.
This is where Simply Wall St’s “Fair Ratio” comes in. The Fair Ratio for Apple is 39.2x, which blends in factors like its growth outlook, profit margins, industry trends, company size, and known risks. Unlike basic peer or industry averages, this proprietary measure is tailored to Apple’s unique business and future prospects, making it a more accurate reference point for value.
Because Apple’s actual PE ratio of 38.2x is very close to its Fair Ratio, the stock appears to be priced about right based on current earnings, future growth, and risk profile.
Result: ABOUT RIGHT

PE ratios tell one story, but what if the real opportunity lies elsewhere?Discover companies where insiders are betting big on explosive growth.
Upgrade Your Decision Making: Choose your Apple Narrative
Earlier we mentioned that there is an even better way to understand valuation, so let us introduce you to Narratives, a concept that makes investing more personal and dynamic. In simple terms, a Narrative is your story about a company, where you combine your perspective on its future with the numbers: your assumptions for revenue, profit margins, and what you believe a fair value should be. Narratives connect a company’s unique story to a financial forecast and ultimately to its fair price, helping you see how your outlook compares against others.
This approach is user-friendly and accessible via Simply Wall St’s Community page, where millions of investors create and share their Narratives for Apple and other stocks. With Narratives, you can easily visualize how your expectations for Apple stack up against today’s price and decide whether to buy or sell by comparing your Fair Value estimate with the market price. What makes Narratives even more powerful is that they update automatically as new information, such as earnings reports or breaking news, emerges so your viewpoint always stays current.
For Apple, for example, some investors are most optimistic and see a Fair Value above $275, believing in AI-driven growth and global expansion, while others are more cautious with estimates around $177, citing risks from competition and slowing innovation. Ultimately, Narratives offer a smarter, more flexible way to invest by letting you anchor your decisions in both data and your viewpoint, rather than relying solely on simple ratios or generic analyst targets.
For Apple, we’ll make it really easy for you by providing previews of two leading Apple Narratives:
Fair Value: $275.00
Undervalued by 7.1%
Revenue Growth Rate: 12.78%
- Apple is actively mitigating the impact of steep U.S. tariffs on Chinese imports by shifting production to India and Vietnam, while seeking tariff exemptions to protect profit margins.
- Despite short-term challenges, strong Q1 2025 results and record services revenue indicate resilience. Analysts maintain a “Moderate Buy” consensus and targets reach as high as $275.
- Strategic investments in artificial intelligence and robust brand loyalty are expected to support long-term growth and recovery, even amidst ongoing volatility.
Fair Value: $207.71
Overvalued by 23%
Revenue Growth Rate: 6.39%
- New EU regulations and higher manufacturing costs from U.S. supply chains risk squeezing profit margins and eroding sales growth, especially if Apple passes costs to consumers.
- Poor strategy and limited traction in emerging markets like India and South America raise doubts about future growth opportunities outside core Western markets.
- Risks to high-margin services revenue, such as the potential loss of the Google search deal and challenges from right-to-repair laws, combine with uncertain payoffs from risky new hardware ventures like the Apple Vision Pro.
Do you think there’s more to the story for Apple?Create your own Narrative to let the Community know!
This article by Simply Wall St is general in nature. We provide commentary based on historical data
and analyst forecasts only using an unbiased methodology and our articles are not intended to be financial advice. It does not constitute a recommendation to buy or sell any stock, and does not take account of your objectives, or your
financial situation. We aim to bring you long-term focused analysis driven by fundamental data.
Note that our analysis may not factor in the latest price-sensitive company announcements or qualitative material.
Simply Wall St has no position in any stocks mentioned.
New: Manage All Your Stock Portfolios in One Place
We’ve created the ultimate portfolio companion for stock investors, and it’s free.
• Connect an unlimited number of Portfolios and see your total in one currency
• Be alerted to new Warning Signs or Risks via email or mobile
• Track the Fair Value of your stocks
Have feedback on this article? Concerned about the content? Get in touch with us directly. Alternatively, email editorial-team@simplywallst.com
Search
RECENT PRESS RELEASES
Related Post


