Ethereum Analyst Projects $10K ETH in 2025: Here’s Why
June 30, 2025
Ether (ETH) rallied approximately 20% from six-week lows at $2,100 on June 22 to a high of $2,526 on June 29. The second-largest cryptocurrency by market capitalization is up 9% over the last week and 35% over the last 90 days.
With a market capitalization of $298 billion, Ether cements its position as the second most valuable cryptocurrency, according to the CoinMarketCap ranking.
Apart from the uptrend in the wider crypto market fueled by increased inflows into spot Ethereum ETFs and Bitcoin’s rally to $108,000 over the weekend, other fundamental factors and onchain metrics back Ethereum’s potential to follow in BTC’s footsteps to reach new all-time highs and possibly top out at $10,000 in 2025.
Dwindling Exchange Supply
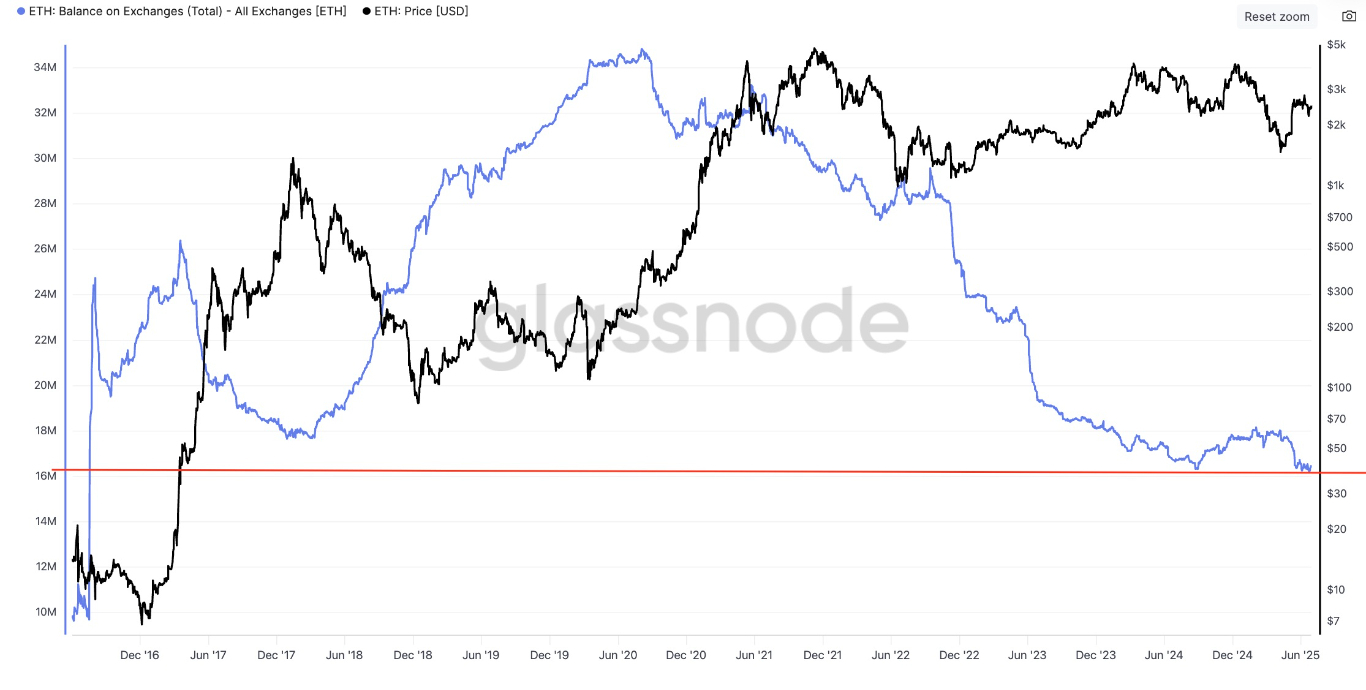
One factor supporting Ether’s upside is reducing supply on exchanges. Data from onchain market intelligence firm Glassnode shows Ether’s reserve on exchanges reached a nine-year low of 16.15 million ETH on June 23, after dropping 10% over the last 90 days.
ETH Exchange Supply. Source: Glassnode
The total balance between inflows and outflows in and out of all known exchange wallets shows a steep decline since October 2023, when withdrawals from the crypto trading platforms began to surge. This drop accompanies a 130% rise in ETH price over the same period.
Decreasing ETH supply on exchanges simply means investors could be withdrawing their tokens into self-custody wallets. This indicates a lack of intention to sell in anticipation of a price increase in the future.
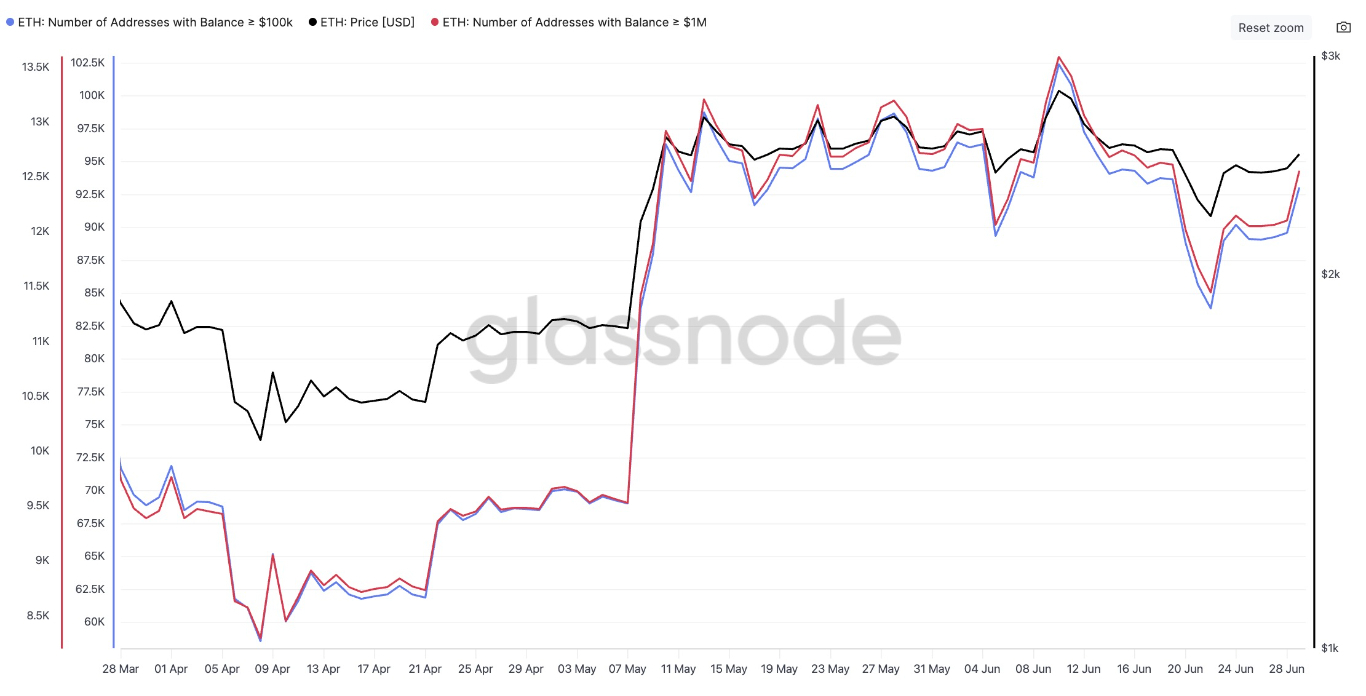
This is explained by a spike in accumulation by large holders over the last few weeks. More data from Glassnode shows that wallets holding $100,000 and $1 million or more worth of ETH have been on the rise since the start of April.
Number of ETH Wallets with Balances > $100K and $1M. Source: Glassnode
The chart above shows that wallets holding $100,000 or more have increased from 58,565 on April 8 to 93,000 on June 29. Similarly, those holding $1 million or more have increased by 51% over the same timeframe. This means that whales have not sold the latest rally in ETH but have continued to accumulate, suggesting most want to position themselves for more gains.
Ethereum’s Open Interest Remains High
Increased demand for leverage resulted in a surge in ETH futures open interest (OI), which sat around $31.9 billion on June 30, after hitting a record high of $41.75 billion on June 11.
Ether Futures Aggregate Open Interest, USD. Source: CoinGlass
Data from Coinglass shows that Ether futures OI has jumped nearly 85% since April 9, suggesting increased demand for leveraged ETH positions.
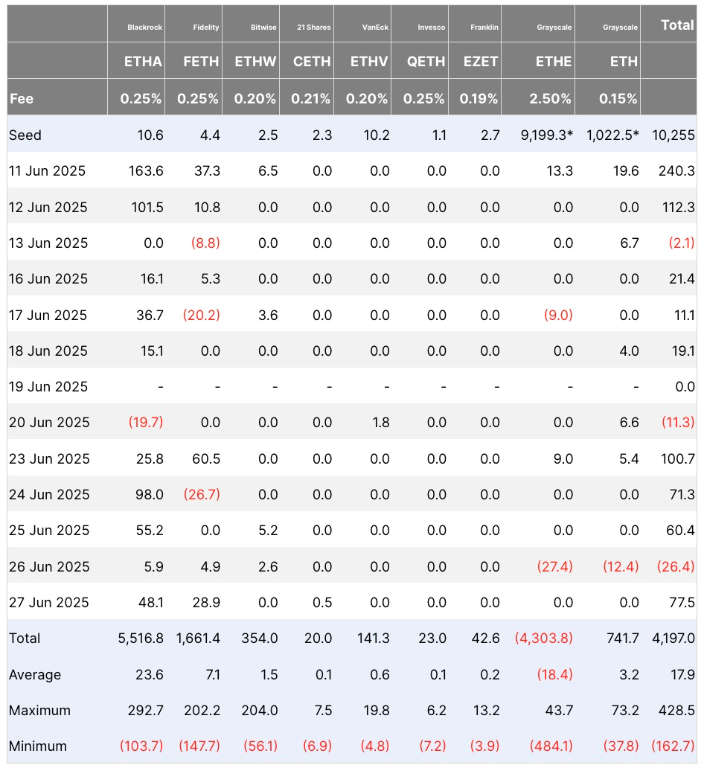
Currently, Ethereum’s onchain and derivatives markets reflect investors’ optimism and continued institutional demand as evidenced by increased inflows into spot Ethereum ETFs.
Data from Farside Investors shows that US-listed spot Ether ETFs saw a total of $1.3 billion in net inflows between June 11 and June 27, adding to demand-side pressure.
Spot Ethereum ETF Flows. Source: Farside Investors
Analysts Set $10,000 Cycle Top for Ether Price
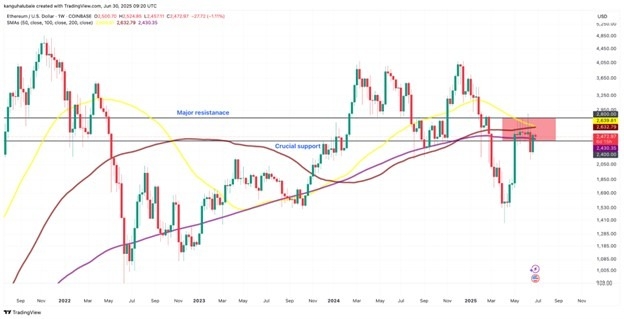
Ether’s over 100% rally between April 7 and June 9 has stalled with the $2,800 acting as a strong resistance. The psychological level at $2,400, embraced by the 200-day simple moving average (SMA), remains a crucial support level for ETH price. A drop below this level over the last two weeks turned out to be a fake-out, as bulls quickly pulled the price back into the $2,400 to $2,800 range.
Bulls were required to first push the price above the $2,600 level, where the 50-day and 100-day SMAs appear to converge, and later overcome the barrier at $2,800 to secure the upside.
ETH/USD Daily Chart. Source: TradingView
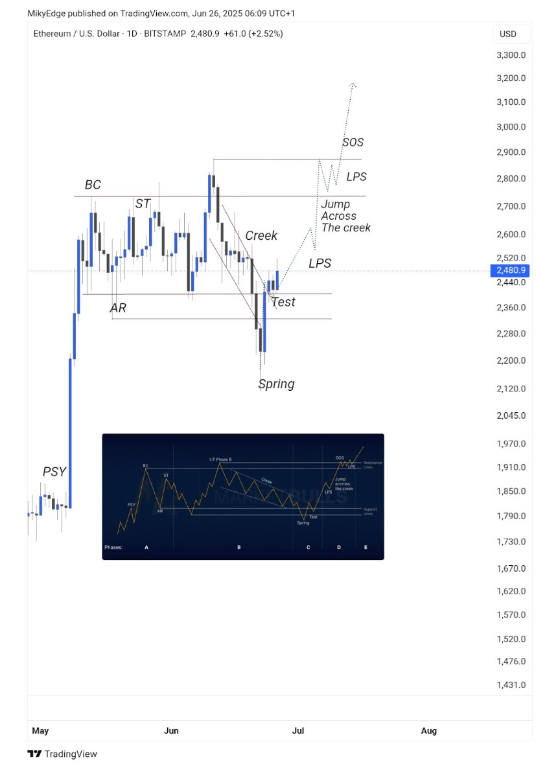
Popular crypto analyst Mikybul Crypto carried out technical analysis using the Wyckoff method to highlight the potential of the Ethereum price breakout above $2,800 to the $3,200 mark.
In a June 26 post on X, the analyst wrote:
“Ethereum is done with ‘test’ on Wyckoff reaccumulation schematic. A big rally is coming.”
ETH/USD Daily Chart. Source: Mikybull Crypto
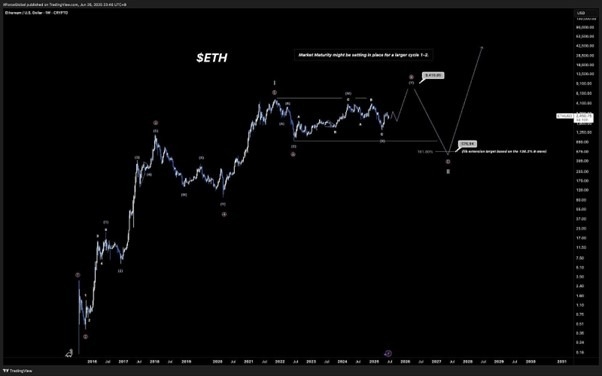
Similar sentiments were shared by fellow XForceGlobal, who pointed out that ETH price was “looking to shoot” to all-time highs this cycle.
XForceGlobal explained that the recent push toward $2,800 was very strong and was backed by fundamental and onchain data.
He shared a weekly chart that showed an Elliott Wave analysis projecting a possible breakout to $9,400.
An accompanying caption read:
“#ETH is still looking to shoot for new ATHs this cycle and should end around $9,000-$10,000, give or take.”
ETH/USD Weekly Chart. Source: XForceGlobal
As DailyForex reported, ETH price could reach $5,000 and above in 2025, backed by historical fractals, increased institutional demand through spot Ethereum ETFs, and bullish onchain data.
Ready to trade our technical analysis of Ethereum? Here’s our list of the best MT4 crypto brokers worth reviewing.
Search
RECENT PRESS RELEASES
Related Post
