Ethereum Bottom In? Charts Flash Buy Signal Ahead of $6K Target
April 21, 2025
- Stochastic RSI, TD Sequential, and key support zones hint at reversal.
- Traders say $ETH at “generational bottom,” eyes on $2,330 breakout.
- Bullish weekly close fuels $6K–$8K Ethereum target for end of 2025.
Ethereum (ETH) price has entered what some analysts describe as a “generational bottom” zone, triggering bullish sentiment across crypto trading desks. The asset, which recently bounced from near the $2,000 mark, has flashed several reversal signals on both weekly and daily timeframes.
As of Apr. 21, ETH traded near $2,140, recovering from its recent correction. The rebound comes amid growing speculation that the asset’s multi-month downtrend could be nearing exhaustion.
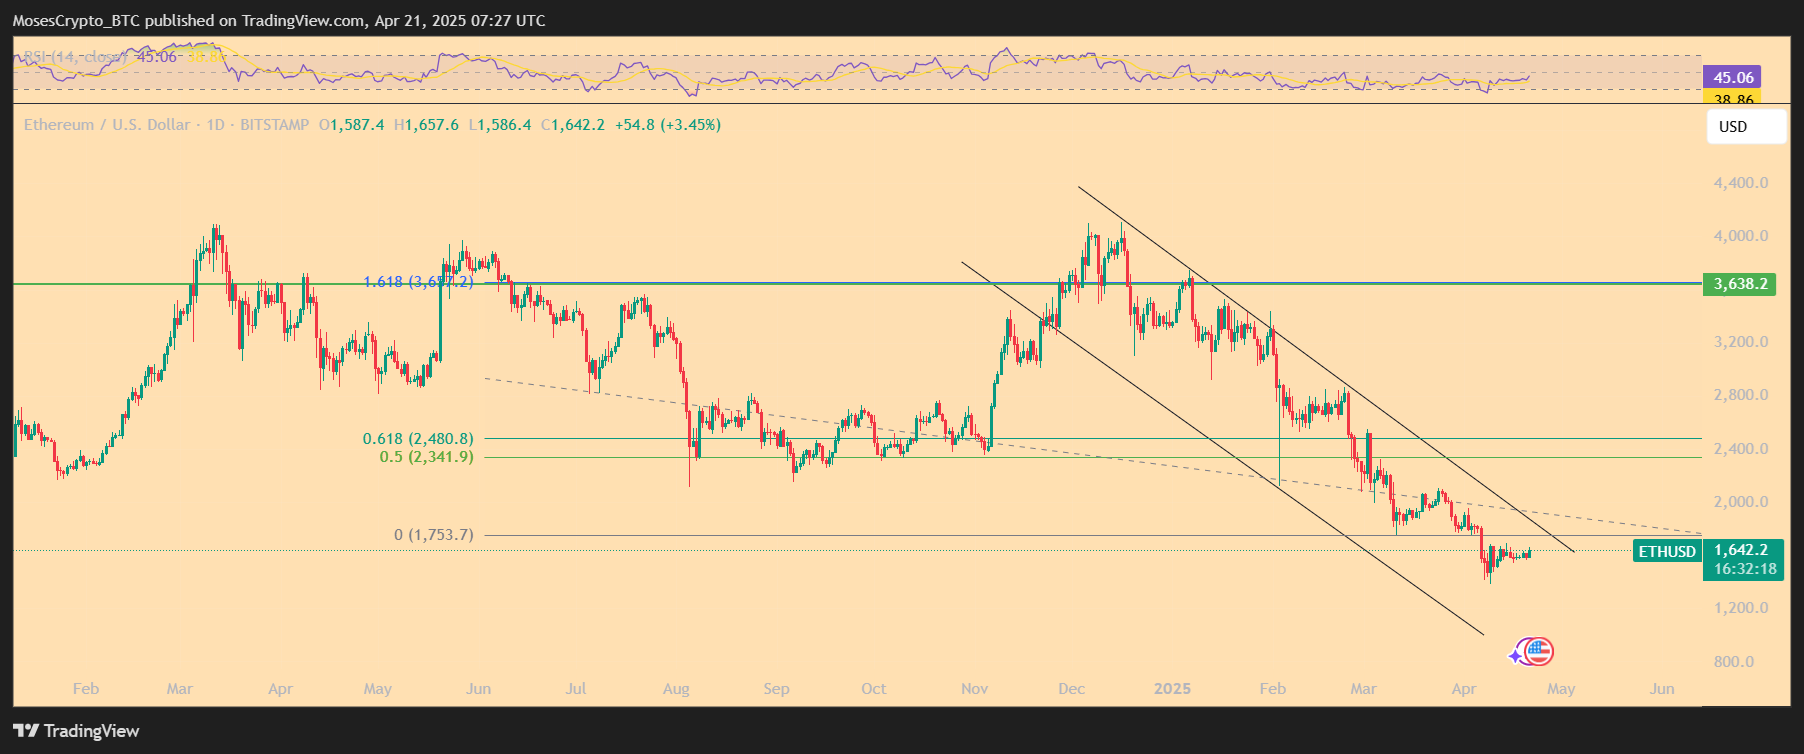
On the daily chart, ETH has exited a multi-week falling channel stretching from March highs near $3,200. The price found support at $1,753—its 0 Fib retracement level—and now tests the channel’s upper boundary near $1,660.
RSI currently reads 45.21, climbing from oversold levels below 30 earlier this month, signaling renewed buying pressure. The chart also shows ETH bouncing from its mid-April lows in what could become a trend reversal.
Analyst Ali noted a TD Sequential buy signal on the weekly chart. Historically, this indicator has preceded local bottoms and marked strong reversal points.
“Big week ahead for #Ethereum $ETH!” he wrote. “The TD Sequential has just flashed a buy signal, hinting at a potential shift in momentum.”
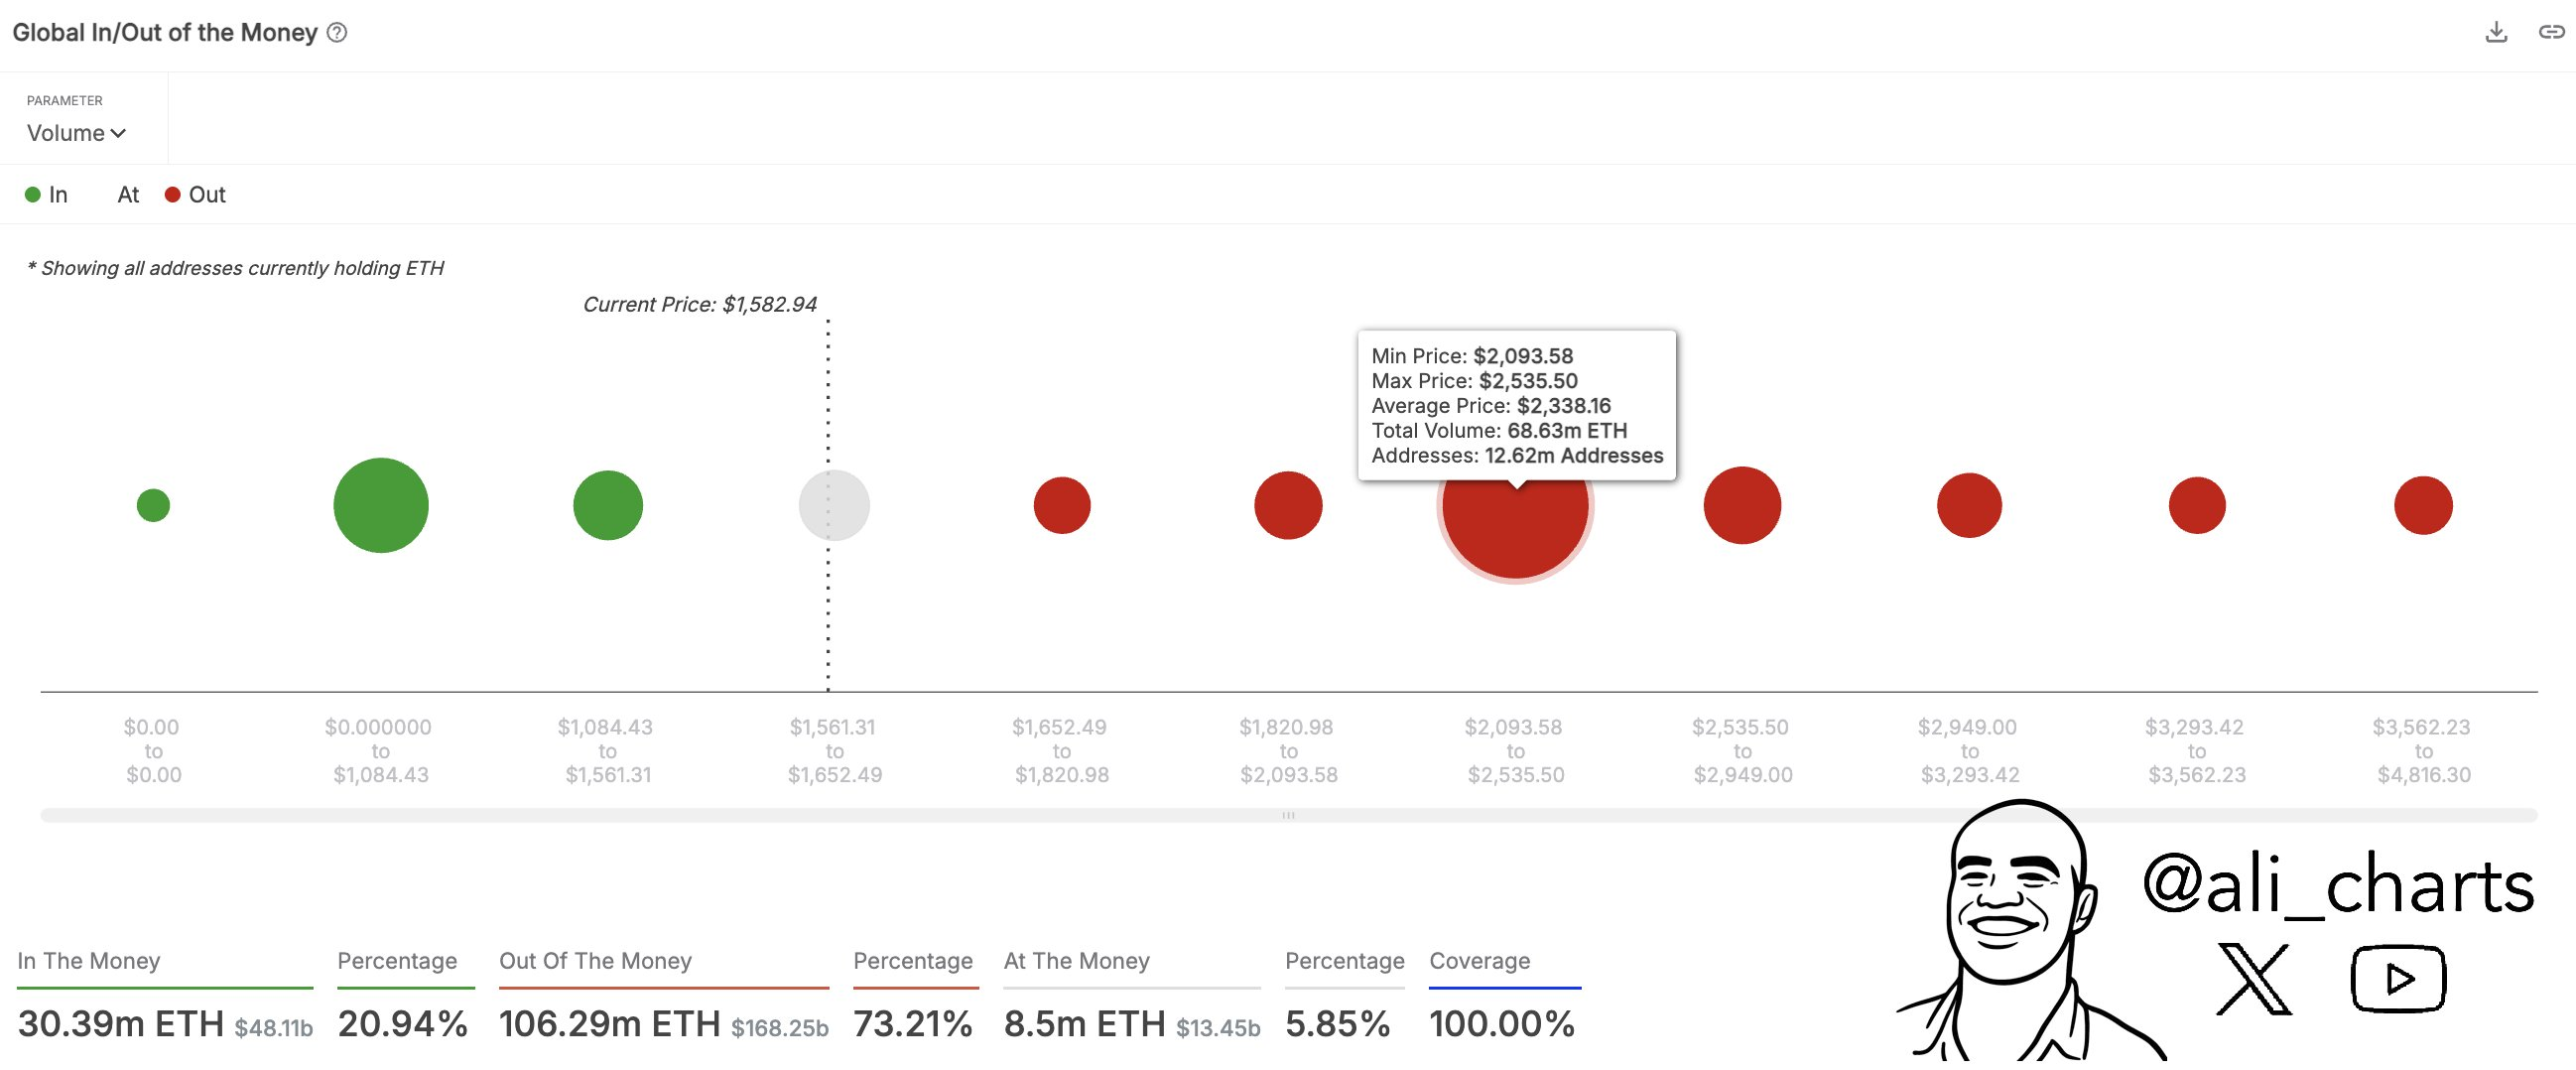
Several traders have marked the $2,330 level as a critical supply wall. Ethereum previously faced rejection at this zone in early March. A decisive move above it could send ETH toward $2,480 and $2,680, key Fibonacci retracement levels from the previous downtrend.
Crypto analyst MerlijnTrader said missing this setup “could be the biggest mistake of 2025.” His post emphasized the Stochastic RSI, now signaling upward momentum.
Fellow analyst and trader Degen_Hardy echoed that sentiment. He called the recent weekly close “bullish,” citing confirmation of a local bottom near $1,750.
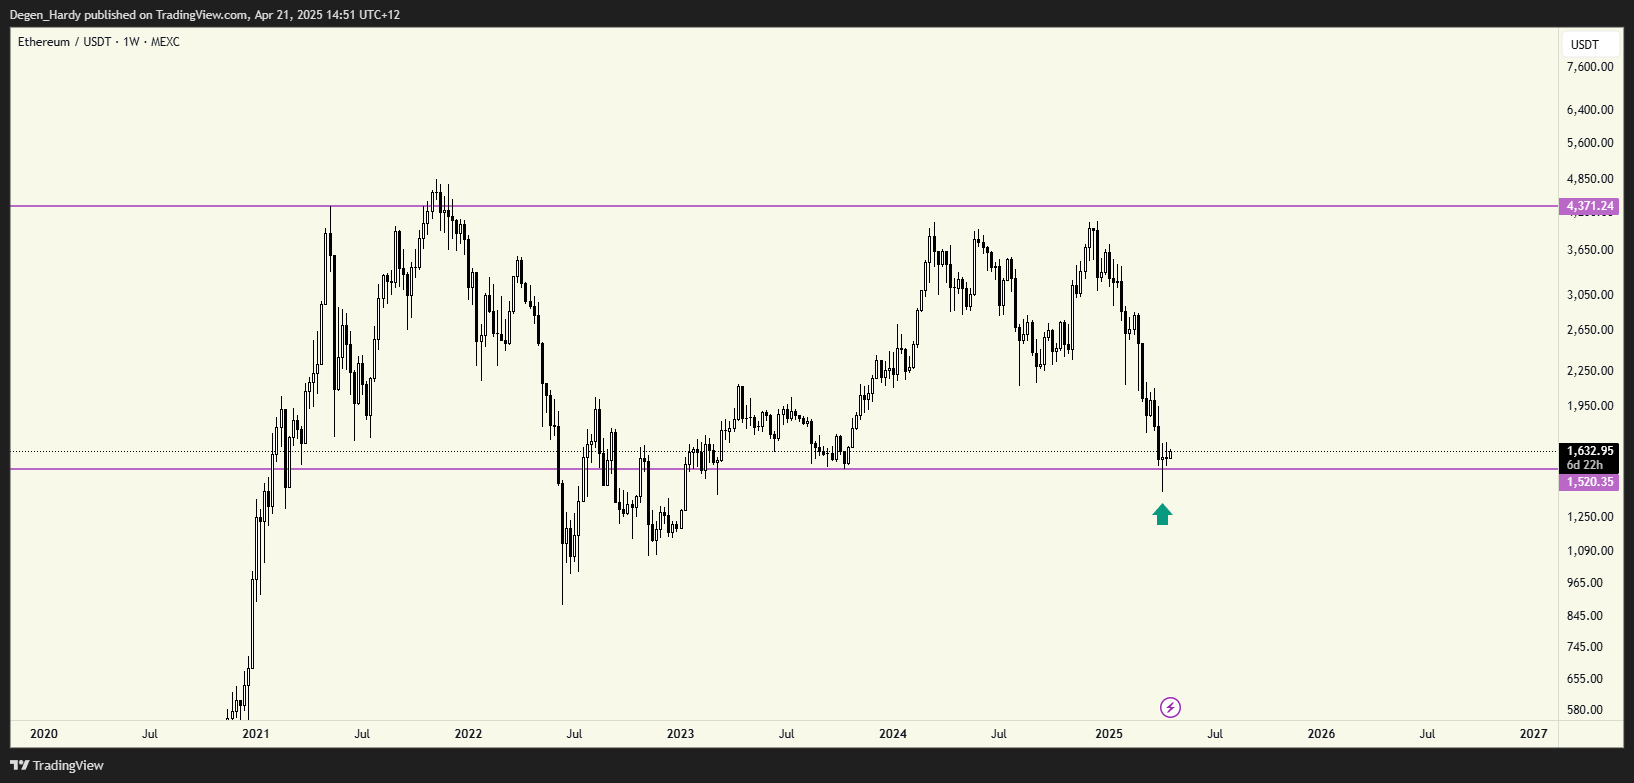
The bullish outlook gained traction after Ethereum closed last week’s candle above key support. Degen_Hardy called it a “bullish” weekly close and said he’s “watching and waiting for long triggers.”
While charts paint a bullish picture, macro forces still apply pressure. Ethereum ETFs in the United States have recorded over $900 million in outflows since late Feb., amid weak institutional interest and ongoing regulatory uncertainty.
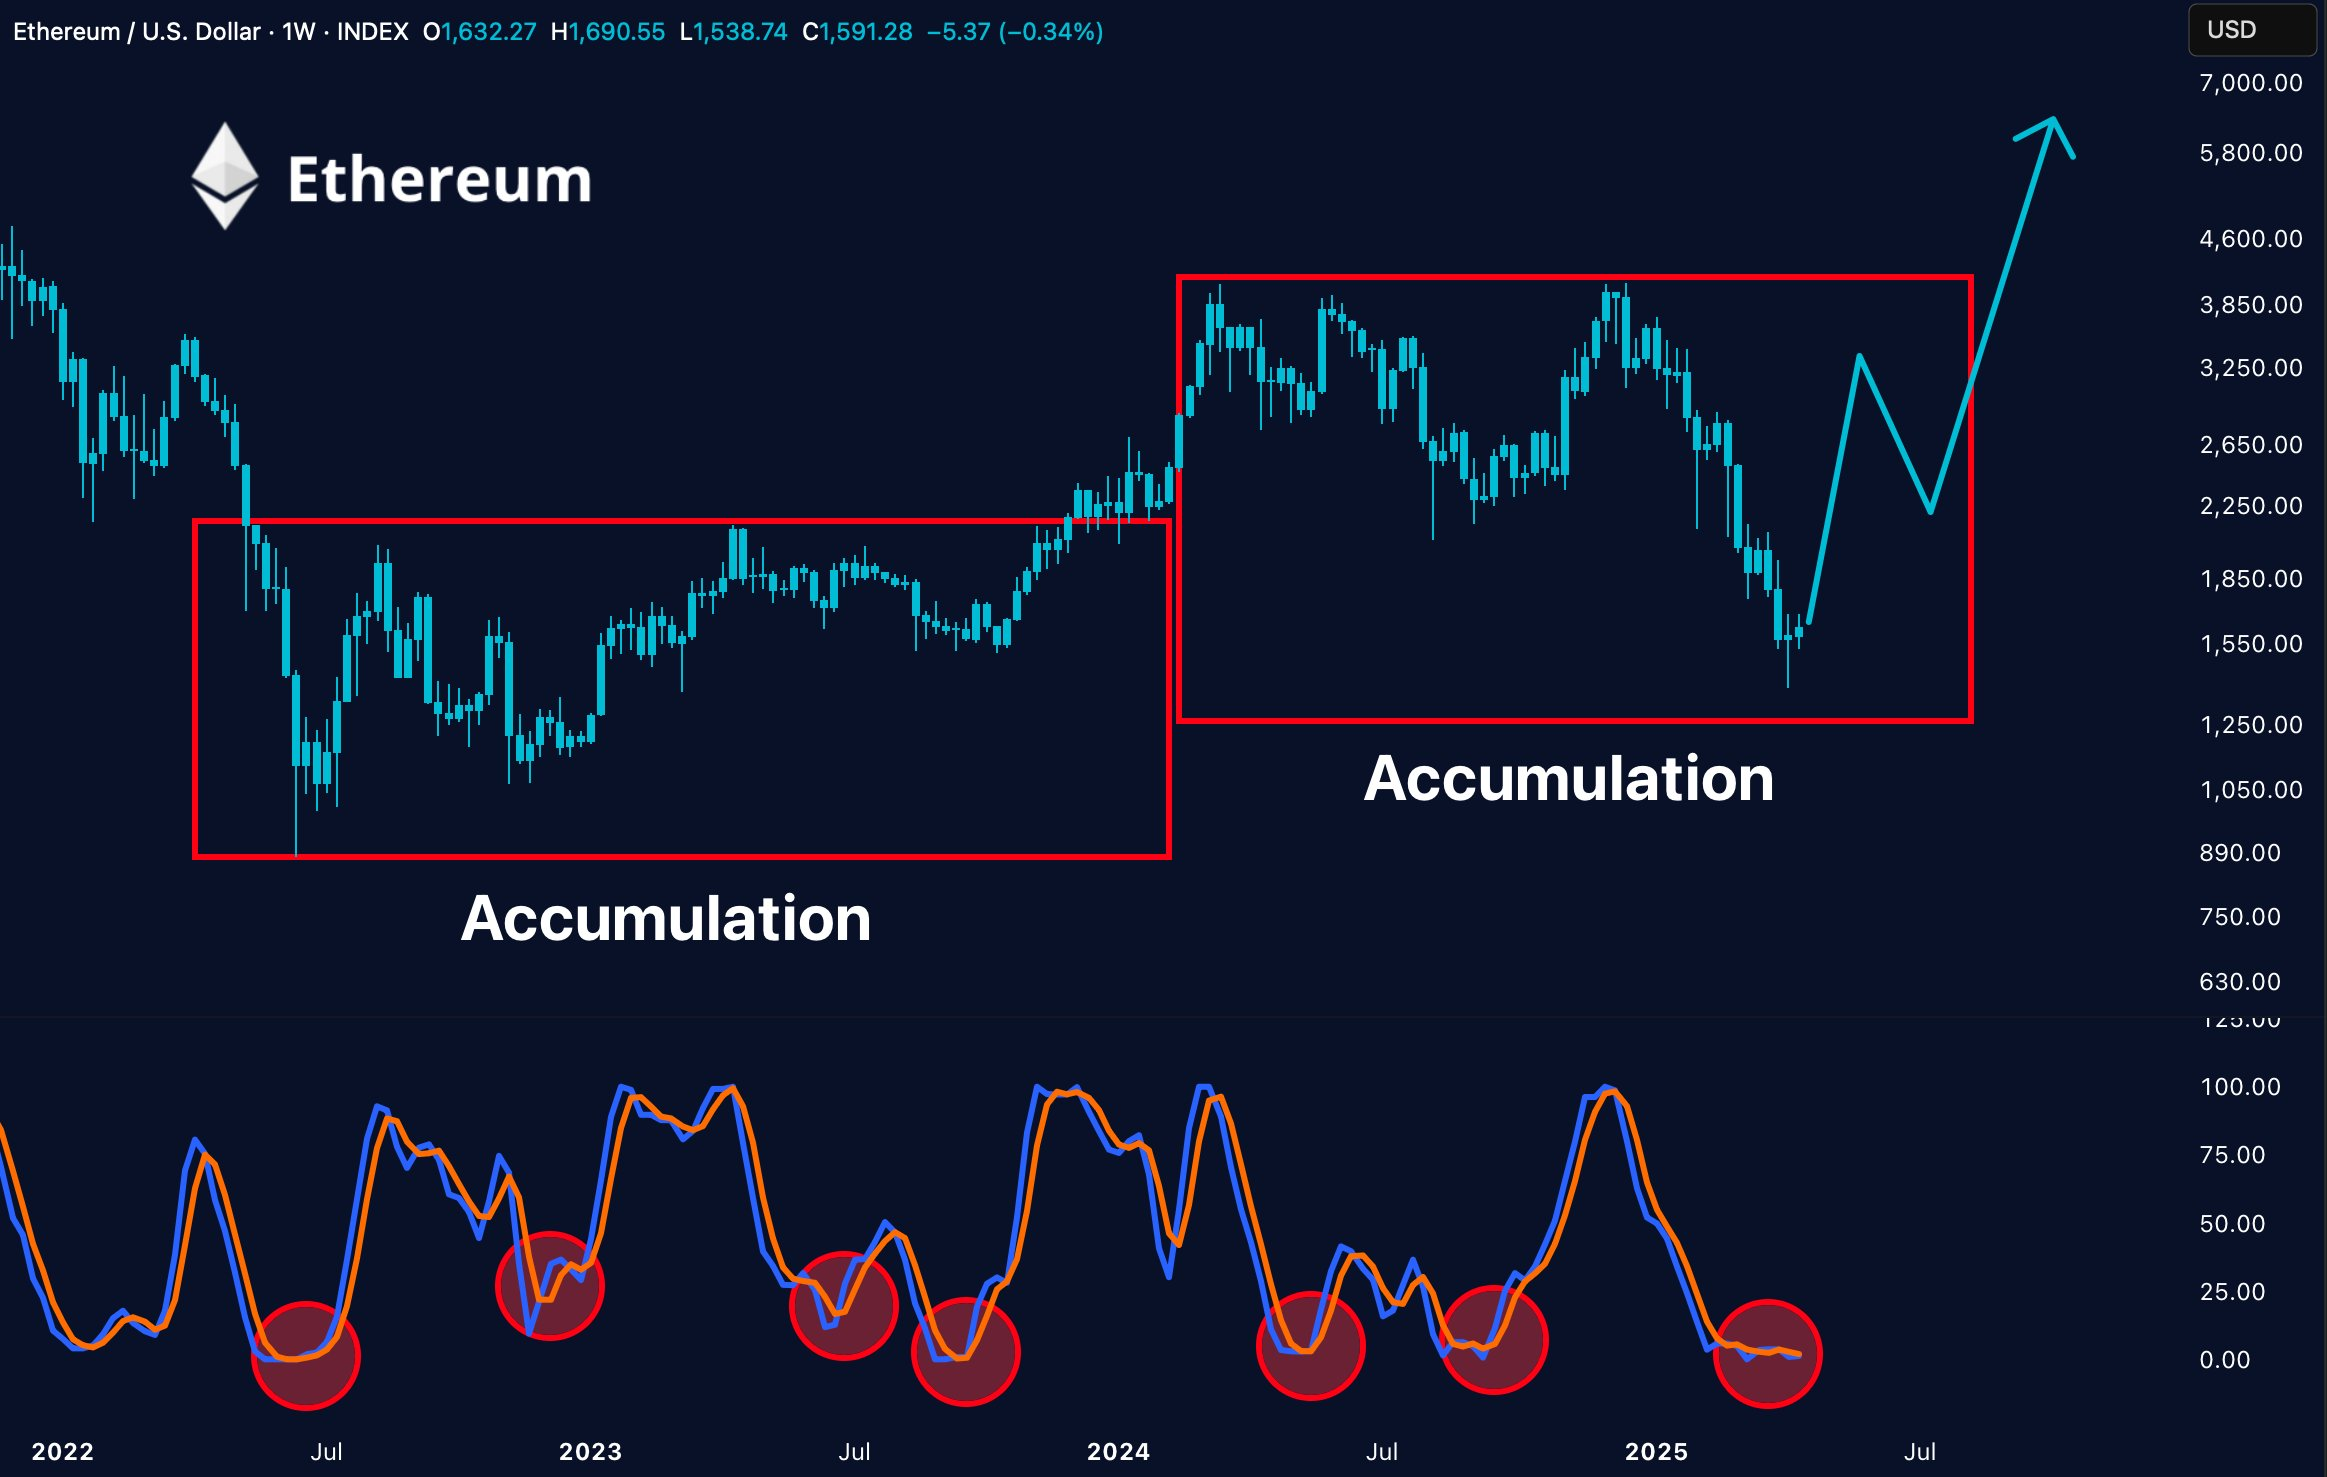
Crypto Patel forecasted a year-end ETH price between $6,000 and $8,000, suggesting long-term positioning is more important than short-term volatility.
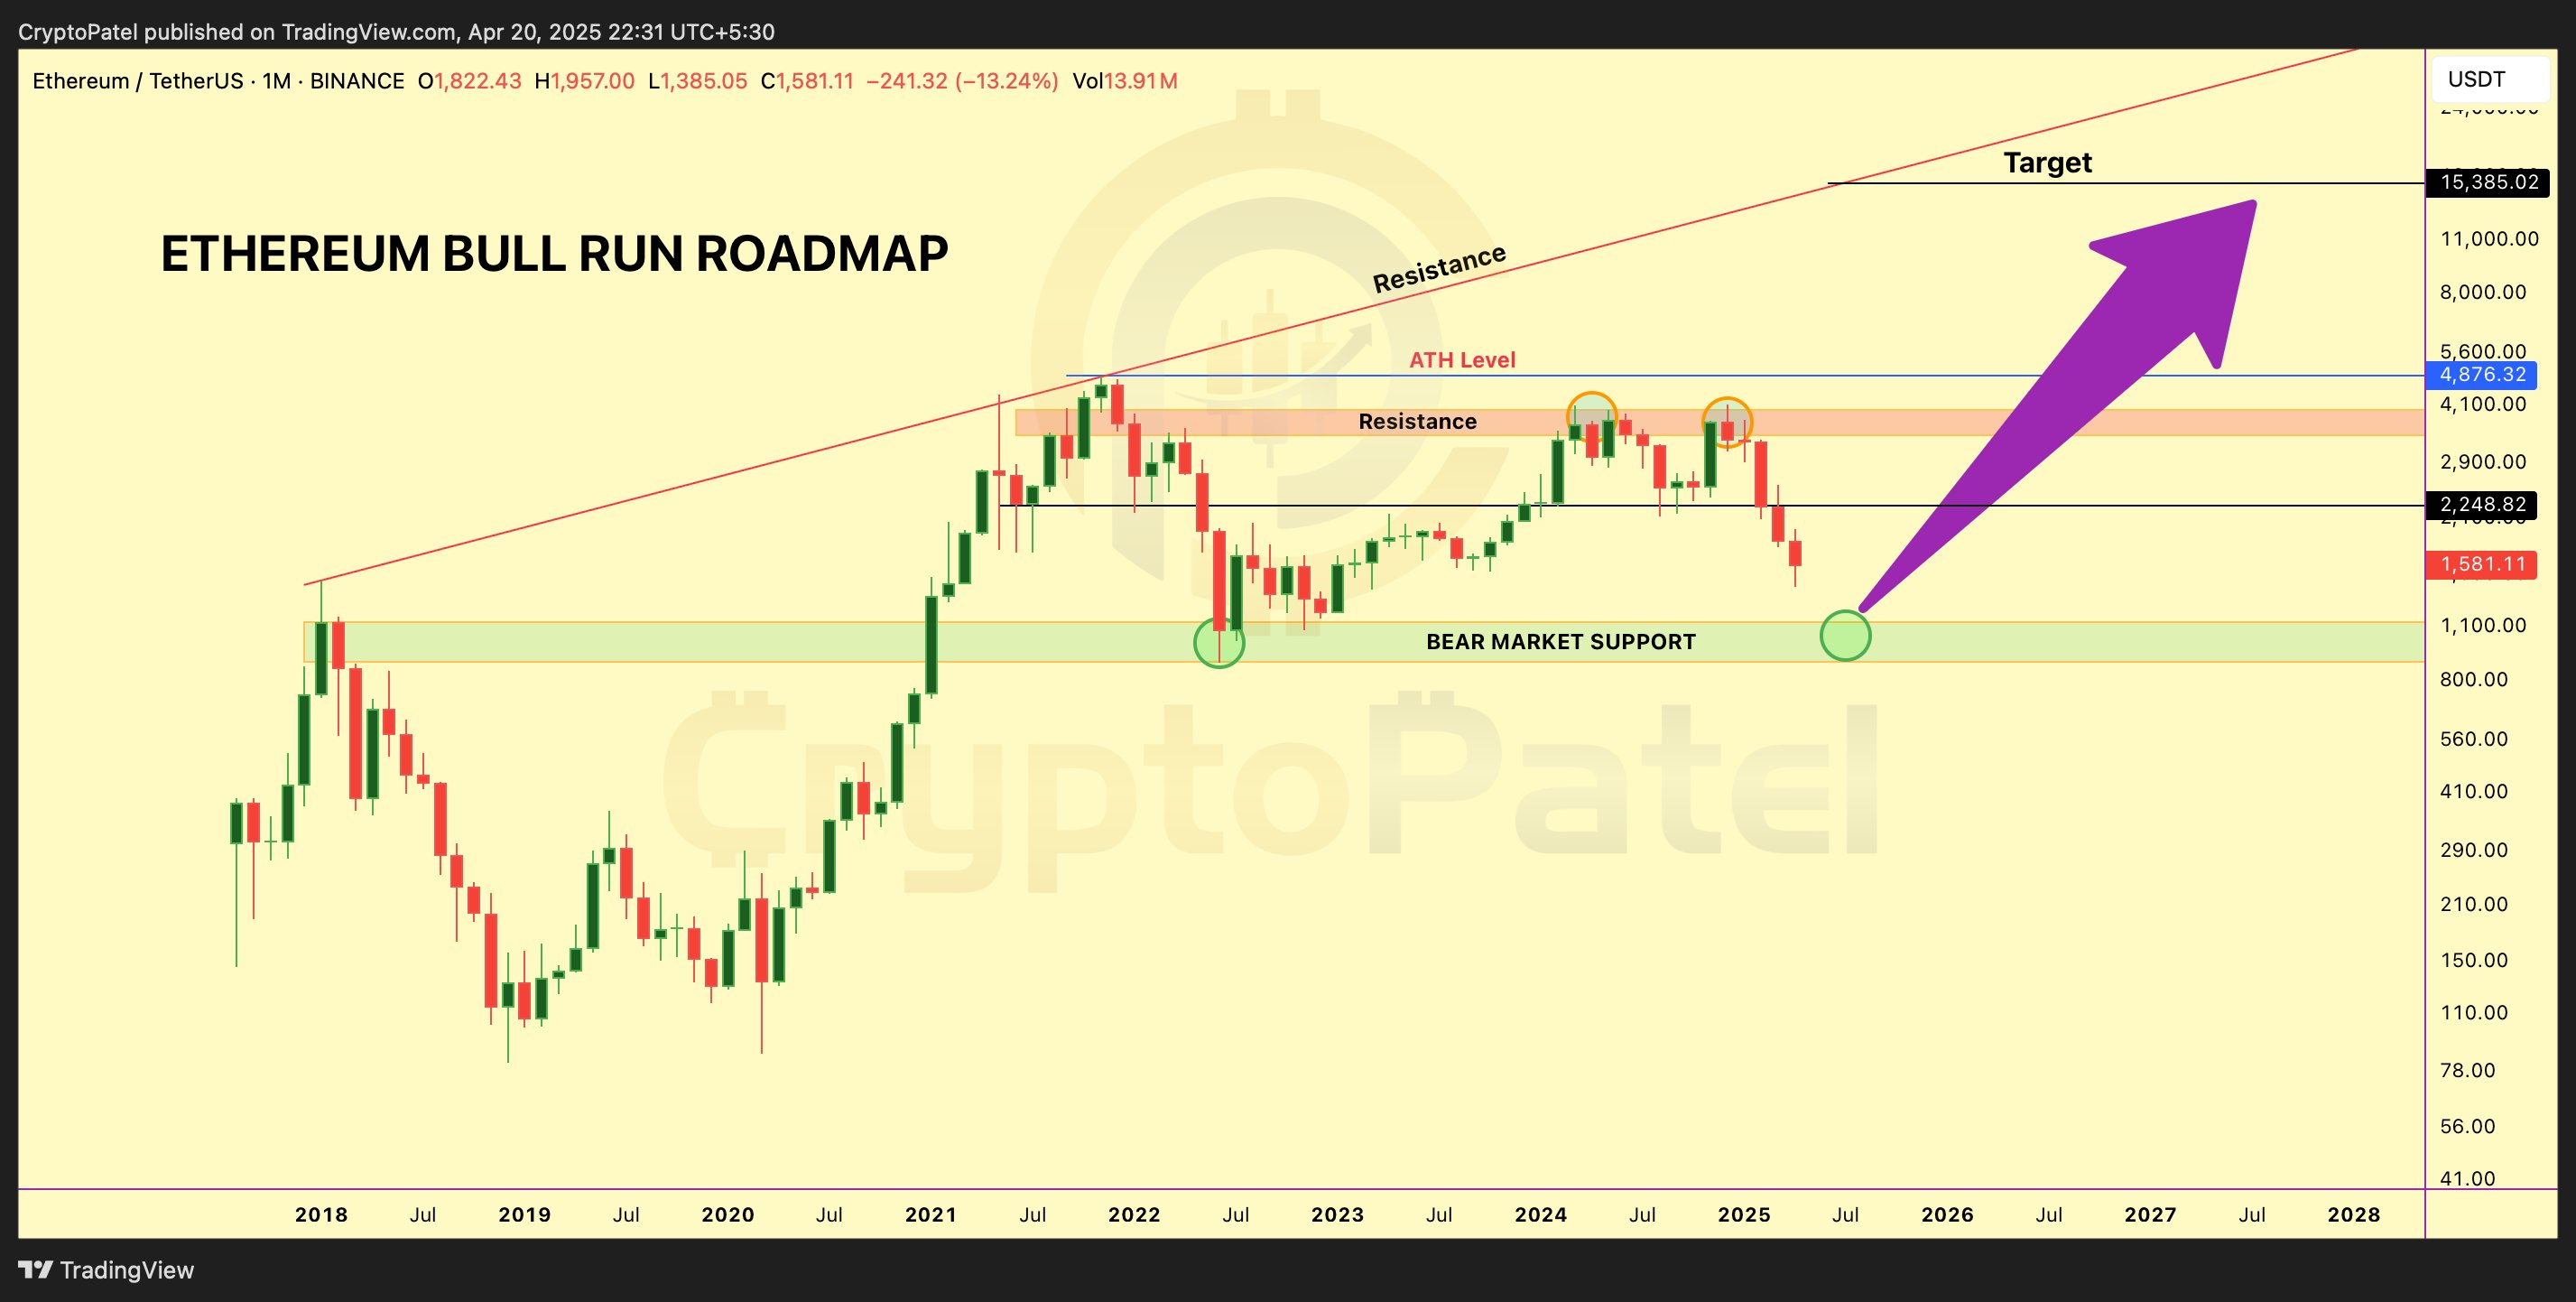
“You’re literally fighting generational wealth if you’re ignoring $ETH right now,” he said. “While they panic, we accumulate.”
On-chain and technical data reinforce the case for an Ethereum reversal. The Fibonacci levels at $2,341 (0.5) and $2,480 (0.618) present logical targets if ETH clears the $2,330 barrier. These zones align with former demand areas from late 2023.
Ethereum Price has also bounced twice from the $1,750 area, forming a potential double bottom pattern. If validated with higher volume and a breakout above descending resistance, this could mark a long-term trend shift.
Moreover, ETH reclaimed the descending channel’s midline and is now attempting to flip it into support—a move often seen before accelerated bullish price action.
Ethereum bulls appear to be regaining control as the asset rebounds from key support and flashes technical reversal signals. A breakout above $2,330 could open the door for further upside toward $2,500 and $2,800.
In this article, the views, and opinions stated by the author, or any people named are for informational purposes only, and they don’t establish the investment, financial, or any other advice. Trading or investing in cryptocurrency assets comes with a risk of financial loss.

Search
RECENT PRESS RELEASES
Related Post


