Ethereum ETFs Bleed $9.6M as Charts Hint at Explosive $7K Breakout
December 30, 2025
Ethereum ETFs logged a $9.6 million net outflow, with BlackRock leading the day’s selling. Meanwhile, Ethereum’s weekly chart still tracks a macro bull flag that targets $7,000 if price confirms a clean breakout.
BlackRock-linked Ethereum ETFs recorded a net outflow of $9.6 million in the latest session, according to figures shared by Ted Pillows on X. The data showed selling pressure concentrated in BlackRock’s product, which posted $13.3 million in Ethereum sales during the day.
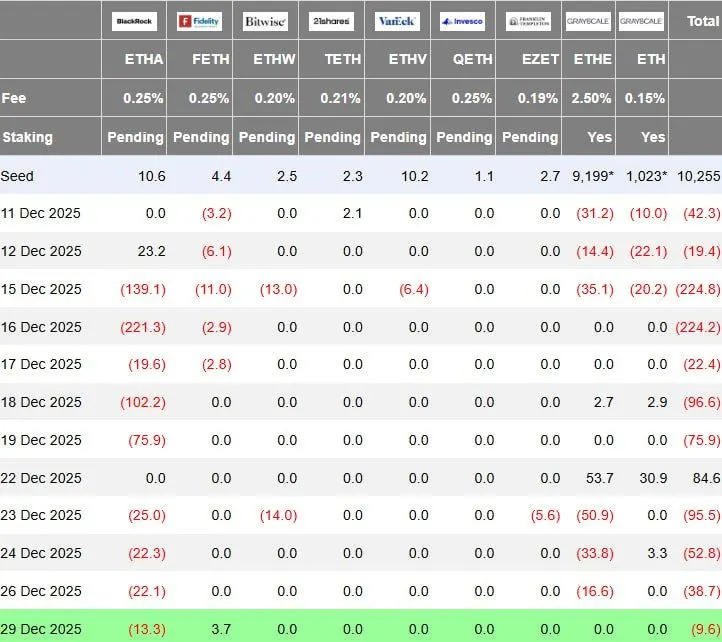
Ethereum ETF Daily Flows Table. Source: Ted Pillows on X
Meanwhile, other issuers showed mixed or muted flows. Several products logged flat activity, while small inflows in a few funds failed to offset the heavier selling from BlackRock. As a result, the aggregate balance across listed Ethereum ETFs turned negative for the session.
In addition, the daily table highlighted uneven movements across dates in December, with multiple sessions posting net redemptions. Although some late-month days printed modest inflows, they did not reverse the broader outflow trend captured in the latest update.
Overall, the figures point to short-term pressure within Ethereum ETF flows, driven primarily by BlackRock’s activity rather than broad-based selling across all issuers.
The weekly Ethereum chart shared by Bitcoinsensus outlines a large macro bull flag structure that has formed after the prior cycle high. Price action compressed inside a narrowing range, marked by lower highs along the upper trendline and higher lows along rising support. This structure reflects long-term consolidation rather than trend reversal.
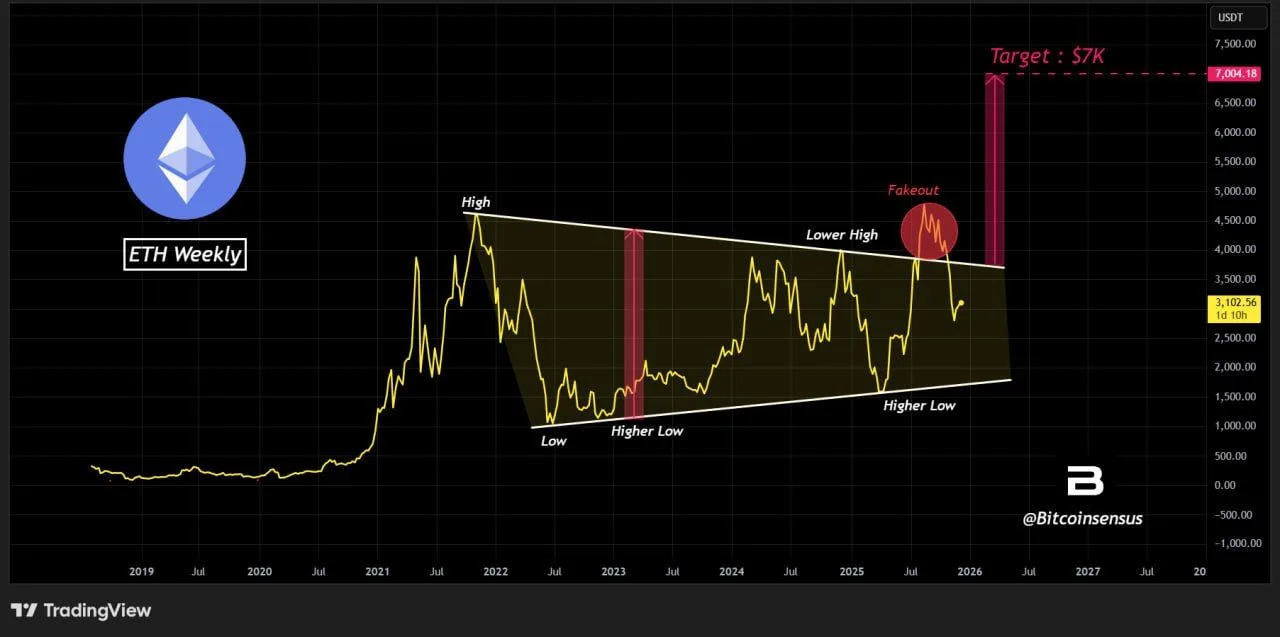
Ethereum Weekly Macro Bull Flag Chart. Source: TradingView, Bitcoinsensus
However, Ethereum recently pushed above the upper boundary and then slipped back inside the range. That move registered as a fakeout, which often appears before a stronger directional breakout. Despite the pullback, price continues to hold above the higher-low trendline, keeping the broader structure intact.
As long as Ethereum maintains the rising support, the macro bull flag remains active. Based on the measured move shown on the chart, a confirmed breakout points to a long-term target near $7,000. The setup frames Ethereum’s current range as a continuation phase within a broader uptrend rather than distribution.
Search
RECENT PRESS RELEASES
Related Post


