Ethereum ETFs See $96.6M Outflow as $150M Bids Build at $2,700–$2,800
December 19, 2025
Ethereum sent mixed signals after U.S. spot ETFs posted a $96.6 million net outflow led by BlackRock selling. At the same time, open interest rose and Binance data showed heavy bids waiting between $2,700 and $2,800.
U.S. spot Ethereum exchange traded funds recorded a net outflow of $96.6 million in the latest trading session, according to daily flow data shared by market analysts. The figures show broad weakness across the ETF complex, with redemptions outweighing new allocations for the day.
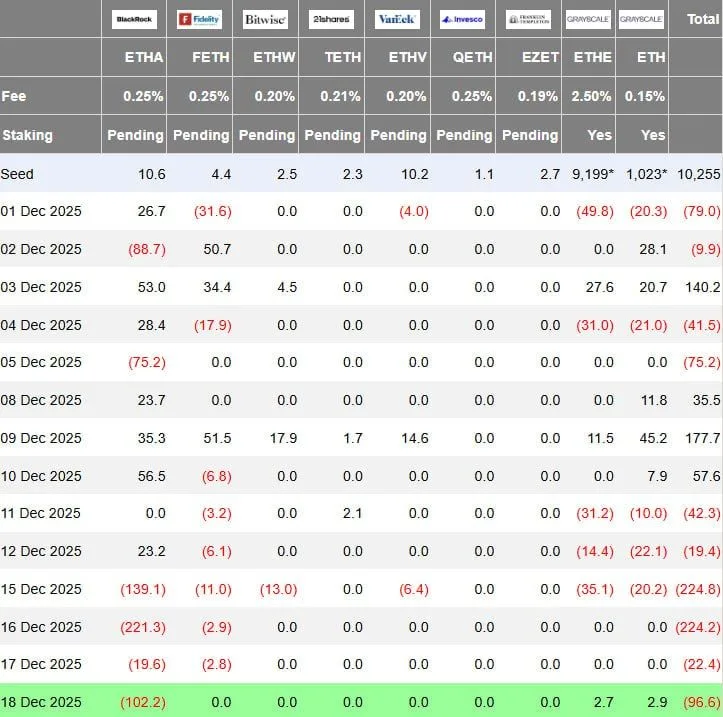
Ethereum ETF Daily Outflows Table. Source: Ted Pillows on X
BlackRock accounted for the largest single move. The asset manager sold roughly $102.2 million worth of Ethereum from its ETF product, making it the main driver behind the overall net outflow. Other issuers posted limited activity, which failed to offset the scale of BlackRock’s selling.
The data reflects a continuation of uneven investor demand for Ethereum ETFs in December. While some sessions earlier in the month saw modest inflows, recent days have leaned negative, pointing to cautious positioning among institutional participants as flows remain sensitive to broader market conditions and short term price action.
Meanwhile, Ethereum derivatives data shows a clear divergence between positioning and price. Aggregated open interest continued to rise on major perpetual futures venues, while ETH price failed to reclaim its prior local high near the $3,000 area, according to TradingView and Hyblock Capital data.

Ethereum Price and Open Interest Divergence. Source: Hyblock Capital, Maartunn on X
The chart shows Ethereum trading around $2,950 while open interest expanded to roughly $11.79 billion. That represents a notable increase over recent sessions, signaling fresh leverage entering the market even as spot price momentum remains capped below resistance. Historically, rising open interest without follow through in price often reflects crowded positioning rather than confirmed trend continuation.
This setup suggests the market is building pressure. When open interest rises but price stays range bound or weak, the imbalance can resolve through increased volatility. Traders typically watch such conditions closely, as either a continuation move or a forced unwind may follow once price breaks decisively above resistance or slips back toward lower support zones.
Binance order book data shows more than $150 million in buy orders stacked between the $2,700 and $2,800 range for Ethereum, according to a chart shared by market analyst Ted Pillows. The bids sit below the current trading zone near $2,950, forming a dense liquidity pocket that could act as near term downside support.
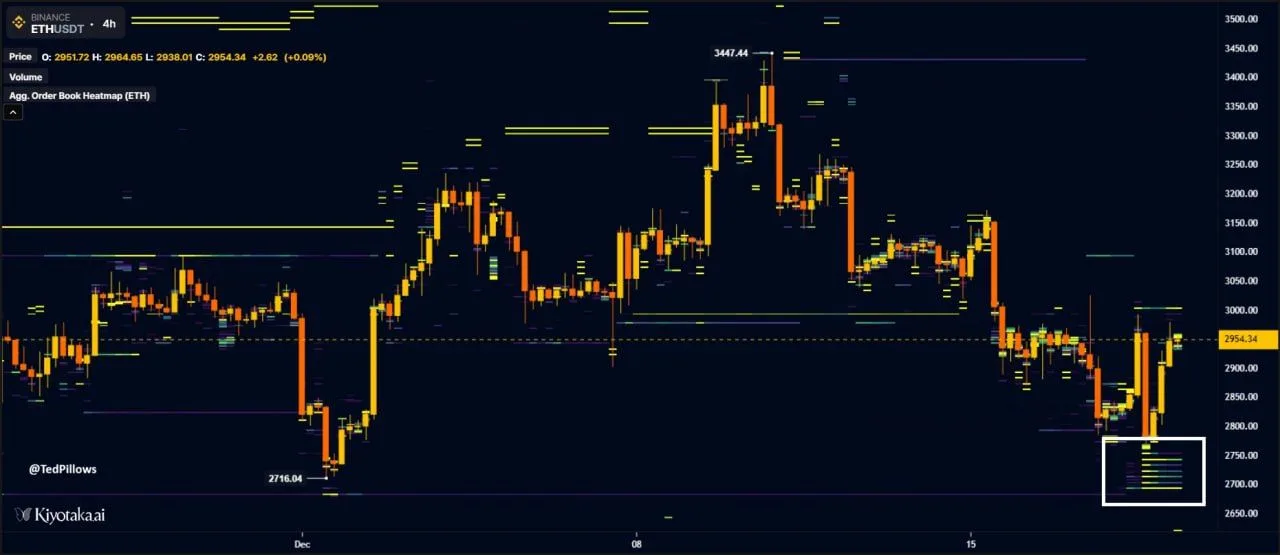
Ethereum Binance Order Book Bid Wall $2,700 to $2,800. Source: Ted Pillows
The heatmap highlights sustained interest at those levels rather than isolated orders. Multiple bid layers appear spread across the zone, suggesting coordinated demand instead of short term scalping activity. Such clustering often reflects institutional positioning or larger players placing limit orders well ahead of potential pullbacks.
Price action over recent sessions shows Ethereum rebounding after dipping toward the high $2,800s, while the bid wall remains intact. If price retraces again, the stacked orders could slow or absorb selling pressure. At the same time, failure to hold that zone would likely force a rapid liquidity shift, as concentrated bids tend to define key decision areas for the market.
Search
RECENT PRESS RELEASES

