Ethereum (ETH) Just Lost Fundamental Level, XRP Not Allowed in Bull Market? Shiba Inu (SHI
April 16, 2025
Advertisement
Shiba Inu has once again faced significant downward pressure. The asset is now trading at about $0.00001168, having failed to set up a significant support level in the last few sessions.
Since the token lacks a strong foundation it is extremely vulnerable to a sharp drop, perhaps as low as $0.00001050. Technically, SHIB is still trapped beneath all four of the major moving averages that are currently trending lower: the 26 EMA, 50 EMA, 100 EMA and 200 EMA. This suggests that SHIB is still in a clearly defined downtrend and that bearish sentiment is firmly in control.
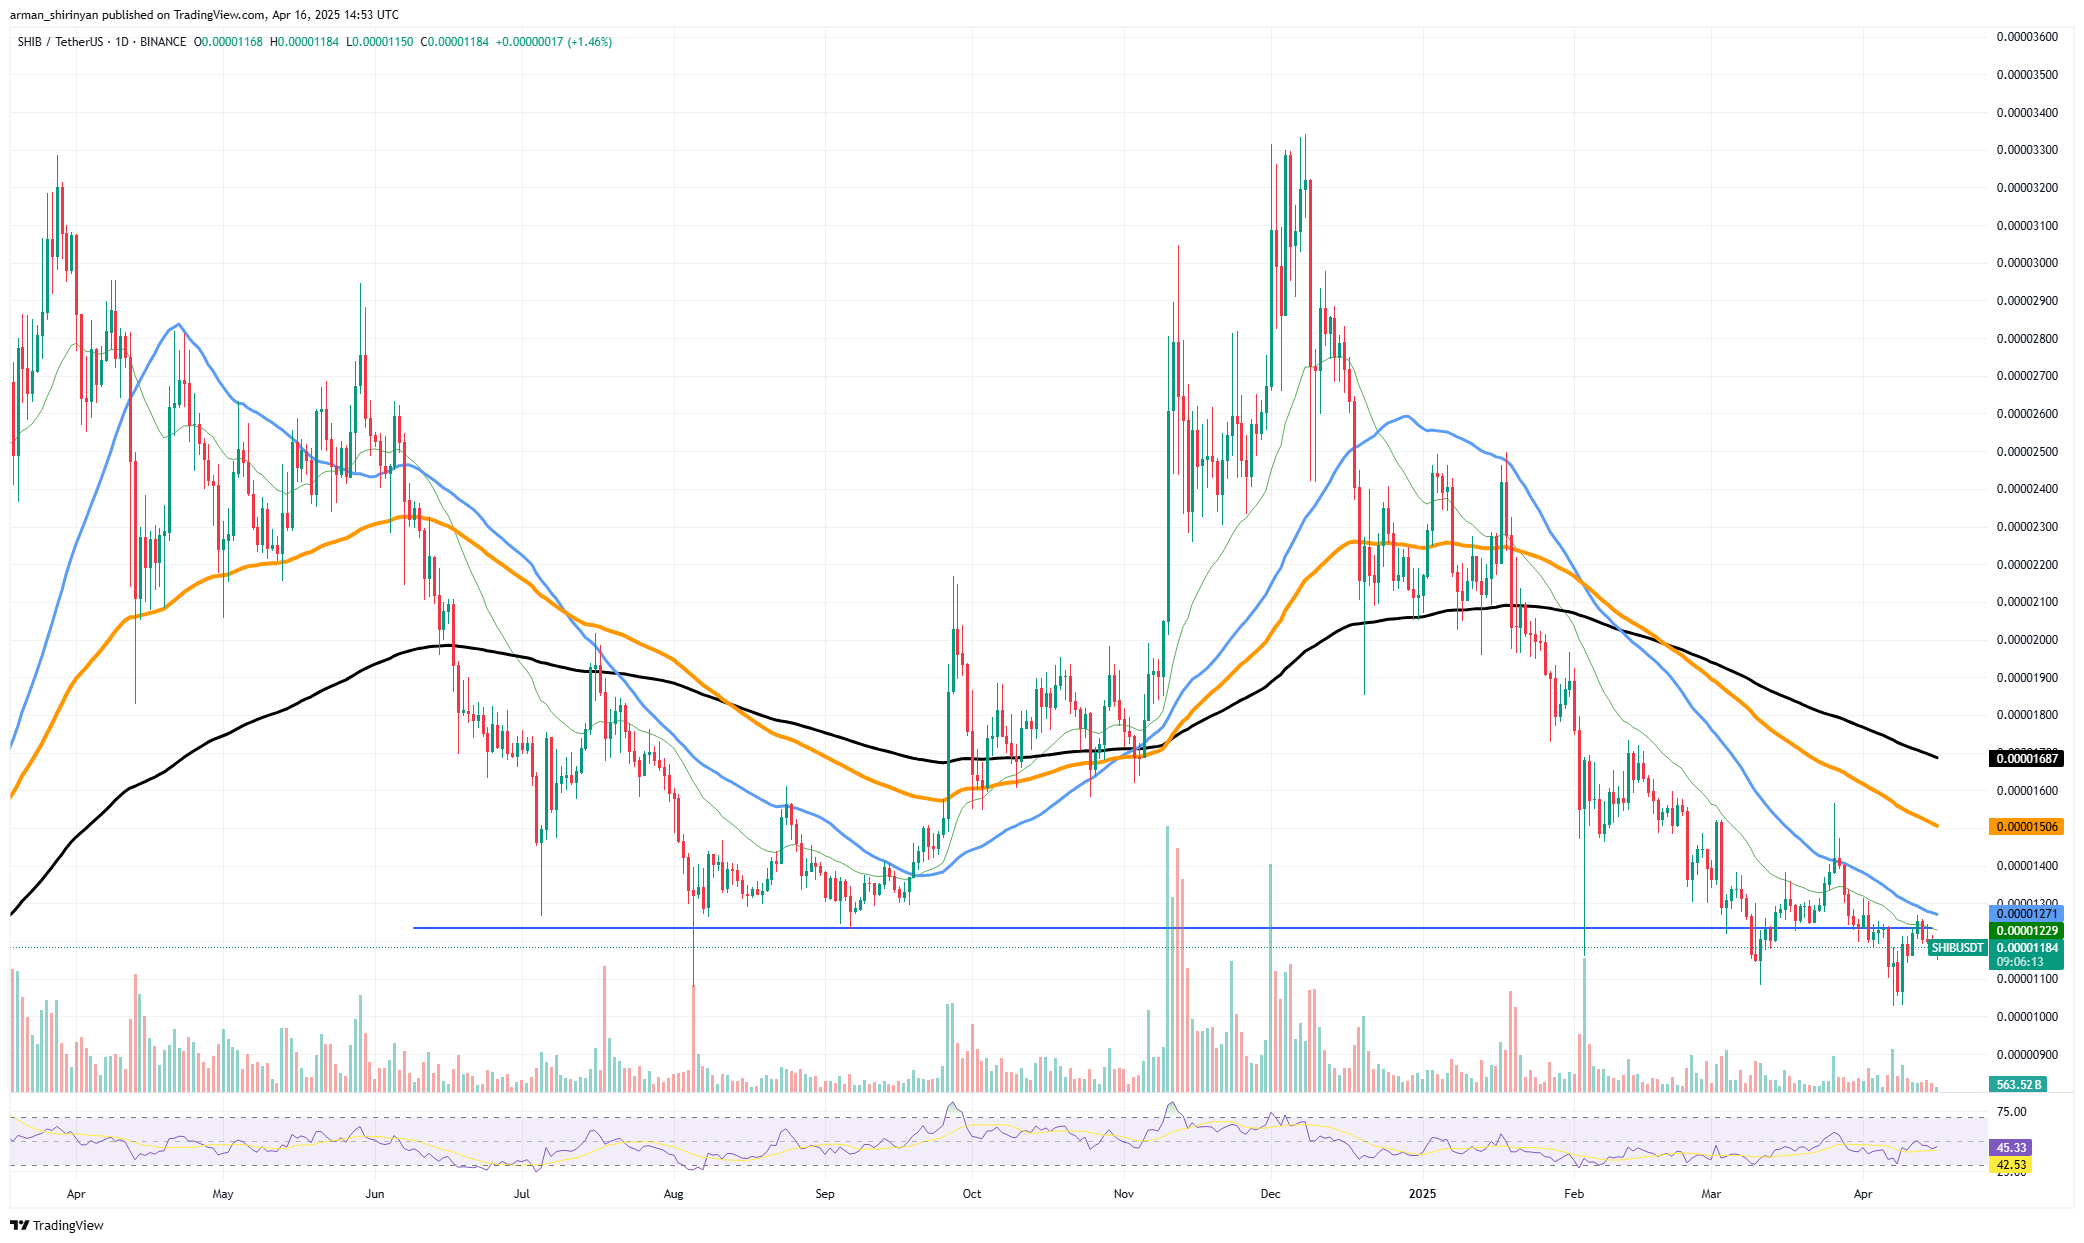
As buying pressure waned and investor hesitancy increased, volume continued to dry up. The recent unsuccessful attempt to break through the resistance zone of $0.00001270 dealt another blow to the bullish momentum. SHIB was swiftly rejected in the absence of a compelling breakout and buyer follow-through, and it currently hovers just above the $0.00001150 mark, a shaky level that has served more as a temporary pause than legitimate support.
There is not much preventing a move toward the psychologically significant $0.00001000 level, or perhaps even lower if SHIB breaks below $0.00001050. Meme coin market sentiment is waning, and there are no bullish catalysts, which only makes a free fall scenario more likely.
Advertisement
A reversal, though, is not completely out of the question. Although such a recovery would necessitate a wider market boost or a potent fundamental catalyst, SHIB could stabilize and possibly challenge the $0.00001500 area if bulls can reclaim the $0.00001200-$0.00001270 range with increasing volume.
XRP has no traction
Concerns have been raised regarding XRP’s capacity to share in the bullish momentum of the larger market as it continues to exhibit underperformance. Even after multiple attempts to rise, XRP has been unable to overcome the 26-day Exponential Moving Average (EMA), which is currently serving as a recalcitrant resistance level. The asset’s bearish tone has only been strengthened by each rejection from this level.
With its descending resistance lines and lower highs the chart, unmistakably displays a downtrend structure. Even as Bitcoin and other significant assets try to recover, XRP is trailing behind — it is stuck in a downward channel and cannot sustain an upward trend. Market hesitancy and a lack of strong bullish conviction are further indicated by the absence of follow-through above short-term moving averages like the 26 and 50 EMAs.
Right now the relative strength index (RSI) is in the neutral 40-50 range, indicating that there is not any discernible directional momentum. The comparatively low volume of activity, which indicates apathy among traders, lends credence to this. XRP’s current behavior feels more like consolidation in a weakening environment than breakout preparation, in contrast to past recoveries, where price breakouts were accompanied by significant volume spikes. The overall state of the market is more worrisome.
Following a robust start in Q1, the momentum on the cryptocurrency markets seems to be waning. The dominance of Bitcoin is still strong, but altcoins like XRP are not making as much money. Actually, XRP’s failure to recover even during Bitcoin’s upswings suggests relative weakness and a decline in investor confidence.
Bulls are likely to stay sidelined until XRP breaks above its 26 EMA and validates the move with stronger closes and rising volume. Additional declines in XRP may be possible if the price stays trapped in the downtrend and is suppressed below the 200 EMA, particularly if the market as a whole continues to cool.
Ethereum breaking down
Ethereum is breaking below a crucial support level, indicating a possible change in market sentiment and significant weakness. Today ETH is struggling to hold the $1,570-$1,600 range, which has historically been a critical rebound zone, after sinking below its recent ascending trendline support.
The fact that ETH lost bullish momentum at a critical juncture is the most worrisome development. The brief rising pattern that developed after the March plunge is invalidated by this breakdown. More importantly, much lower price levels, especially $1,500, are now possible because the market has failed to consolidate above that level. The bearish pressure may worsen and drive Ethereum closer to the psychological and technical $1,000 threshold if it is unable to swiftly recover this level.
Ethereum’s persistent rejection from all significant moving averages adds to this worry. The 50-day, 100-day and 200-day EMAs are all currently sloping downward, and ETH is still well below them. This demonstrates the bearishness of the current trend over short, medium and long-term time frames. Furthermore, the volume analysis lacks confidence. Despite a modest increase in trading activity, buying power seems to be rapidly declining, indicating that bulls are losing faith in the market. Since the RSI is currently in the low 30s, Ethereum is technically close to oversold territory.
This does not, however, ensure a reversal on its own, particularly when technical structure and macro conditions suggest additional downside. Ethereum’s next significant stop might be at $1,200 and eventually even $1,000 if the price is unable to stay above $1,500 in the upcoming sessions. A move like that would wipe out months’ worth of gains and return Ethereum to prices not seen since the beginning of 2023.
Search
RECENT PRESS RELEASES
Related Post


