Ethereum (ETH) Price Could Dip 6% Before Rallying Toward New Highs
October 7, 2025
Something interesting is brewing on Ethereum’s chart. After weeks of steady gains, the Ethereum price seems to be pausing near $4,700, but not in a way that signals weakness. Instead, the data and patterns suggest a small drop could be exactly what ETH needs before it moves higher again.
A pullback toward $4,410, roughly a 6% dip, could complete a classic reversal setup — one that often appears before major rallies. But first, on-chain data shows why traders are cautious in the short term.
SponsoredSponsored
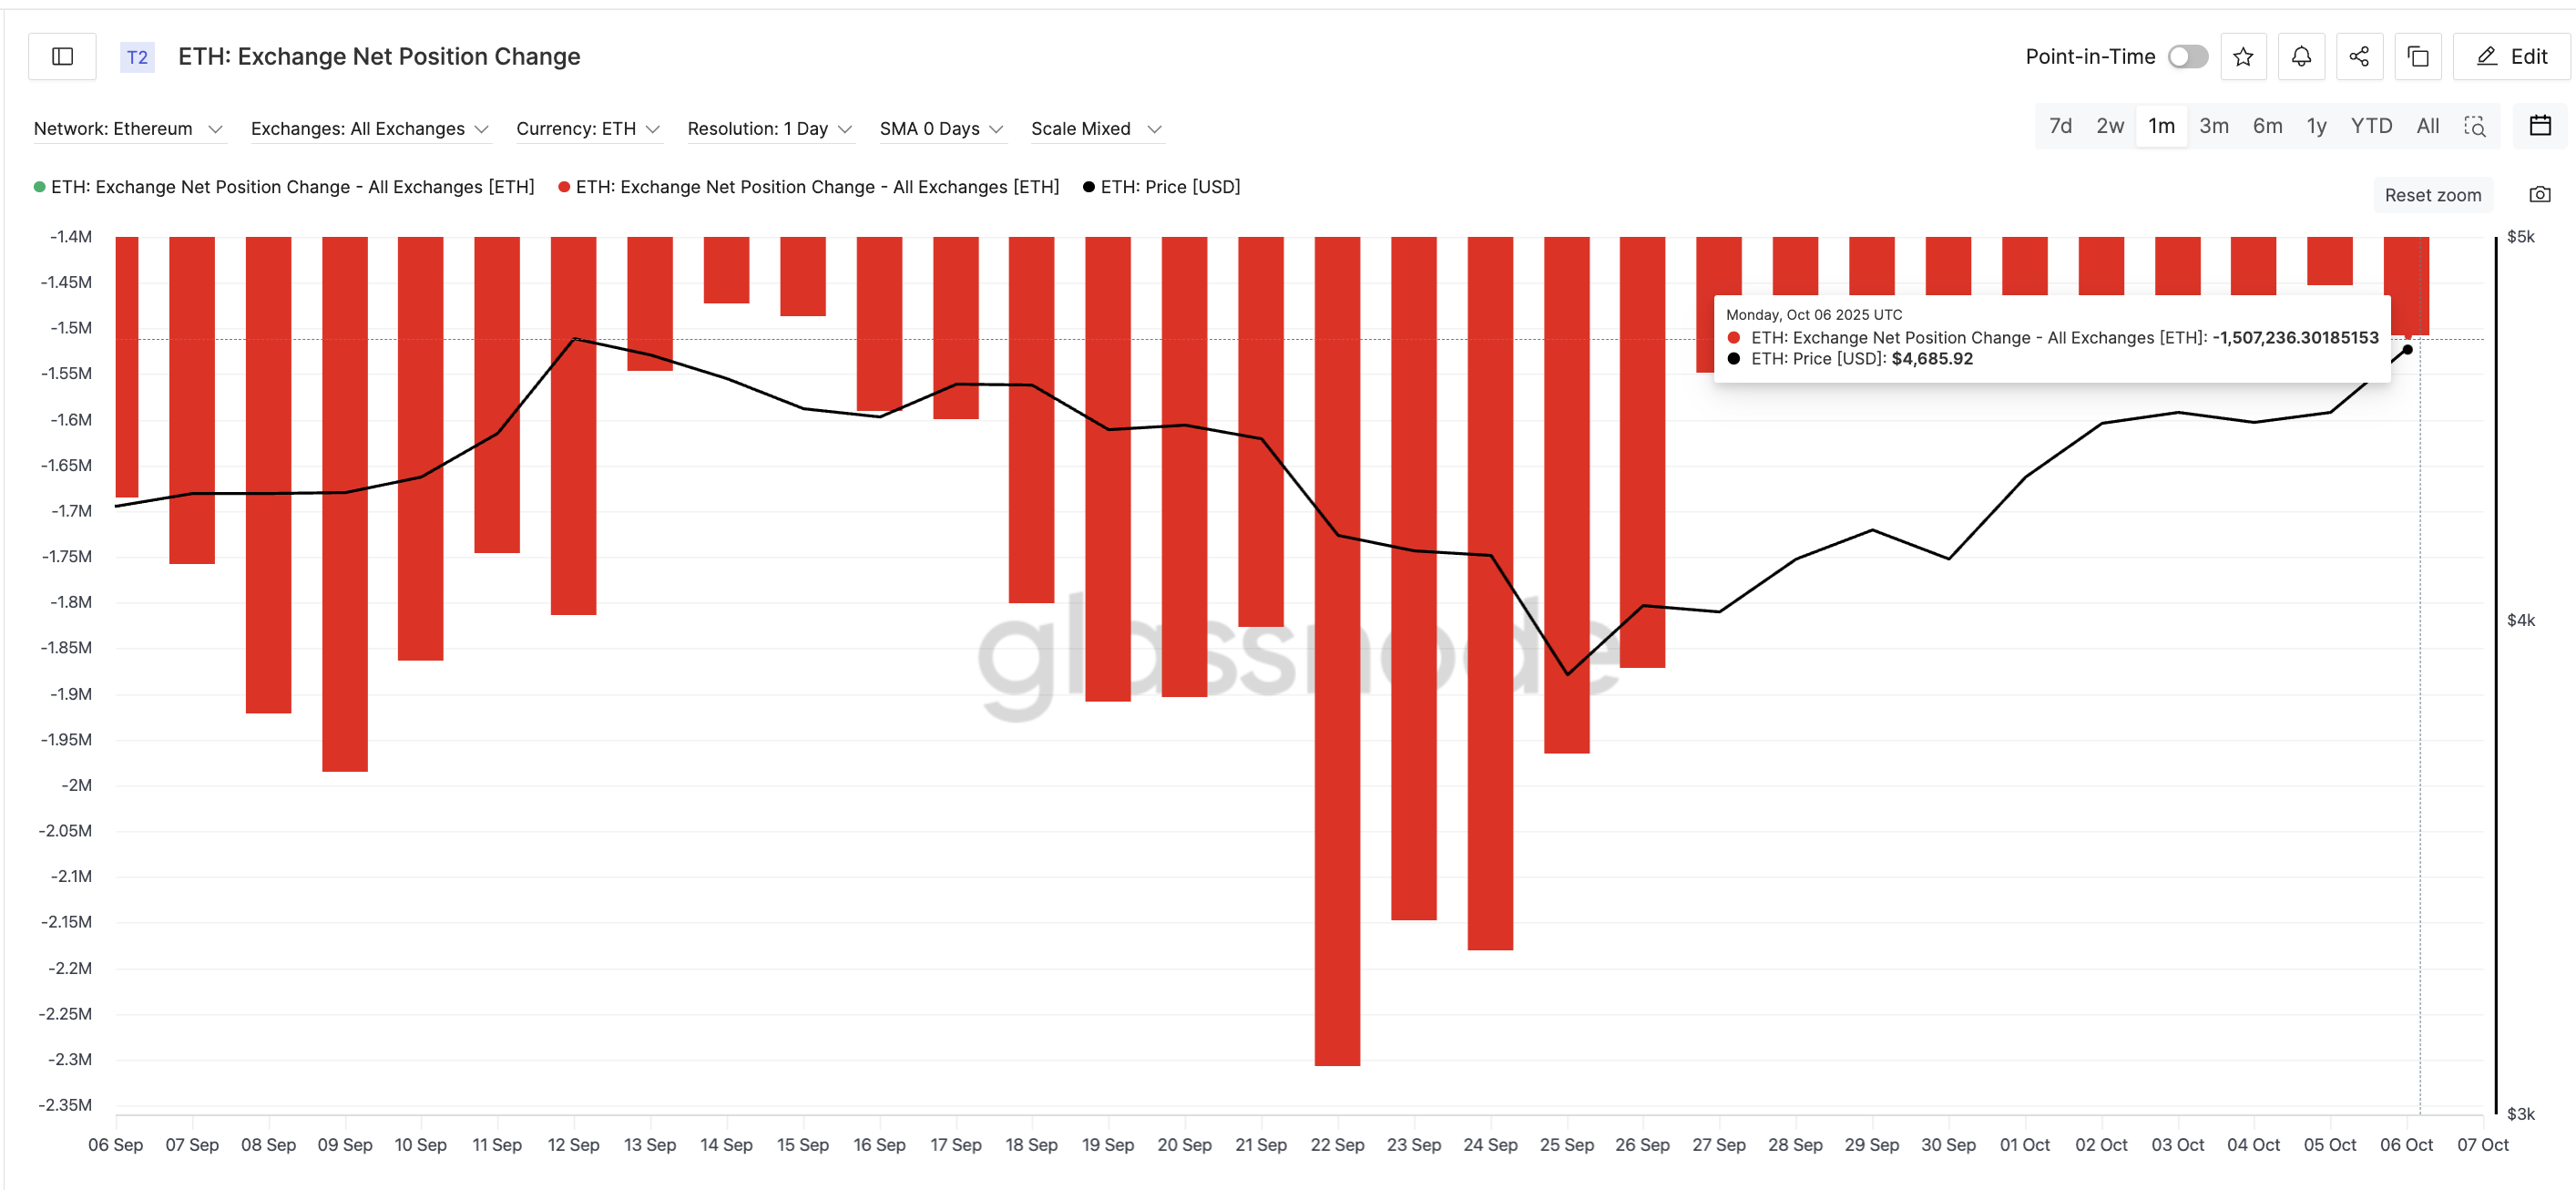
Ethereum’s exchange net position change — which measures how many coins move in or out of centralized exchanges — shows a slowdown in buying activity. When this number is deeply negative, more coins are being withdrawn, meaning investors are holding. As it becomes less negative, traders are sending more coins to exchanges, usually to take profits.
As of October 6, ETH’s net position change stands at –1.5 million, up from –2.3 million on September 22, a 35% shift towards selling pressure. The smaller negative value means fewer withdrawals and slightly more deposits, showing that some traders might be interested in taking profits after the recent climb.
Want more token insights like this? Sign up for Editor Harsh Notariya’s Daily Crypto Newsletter here.
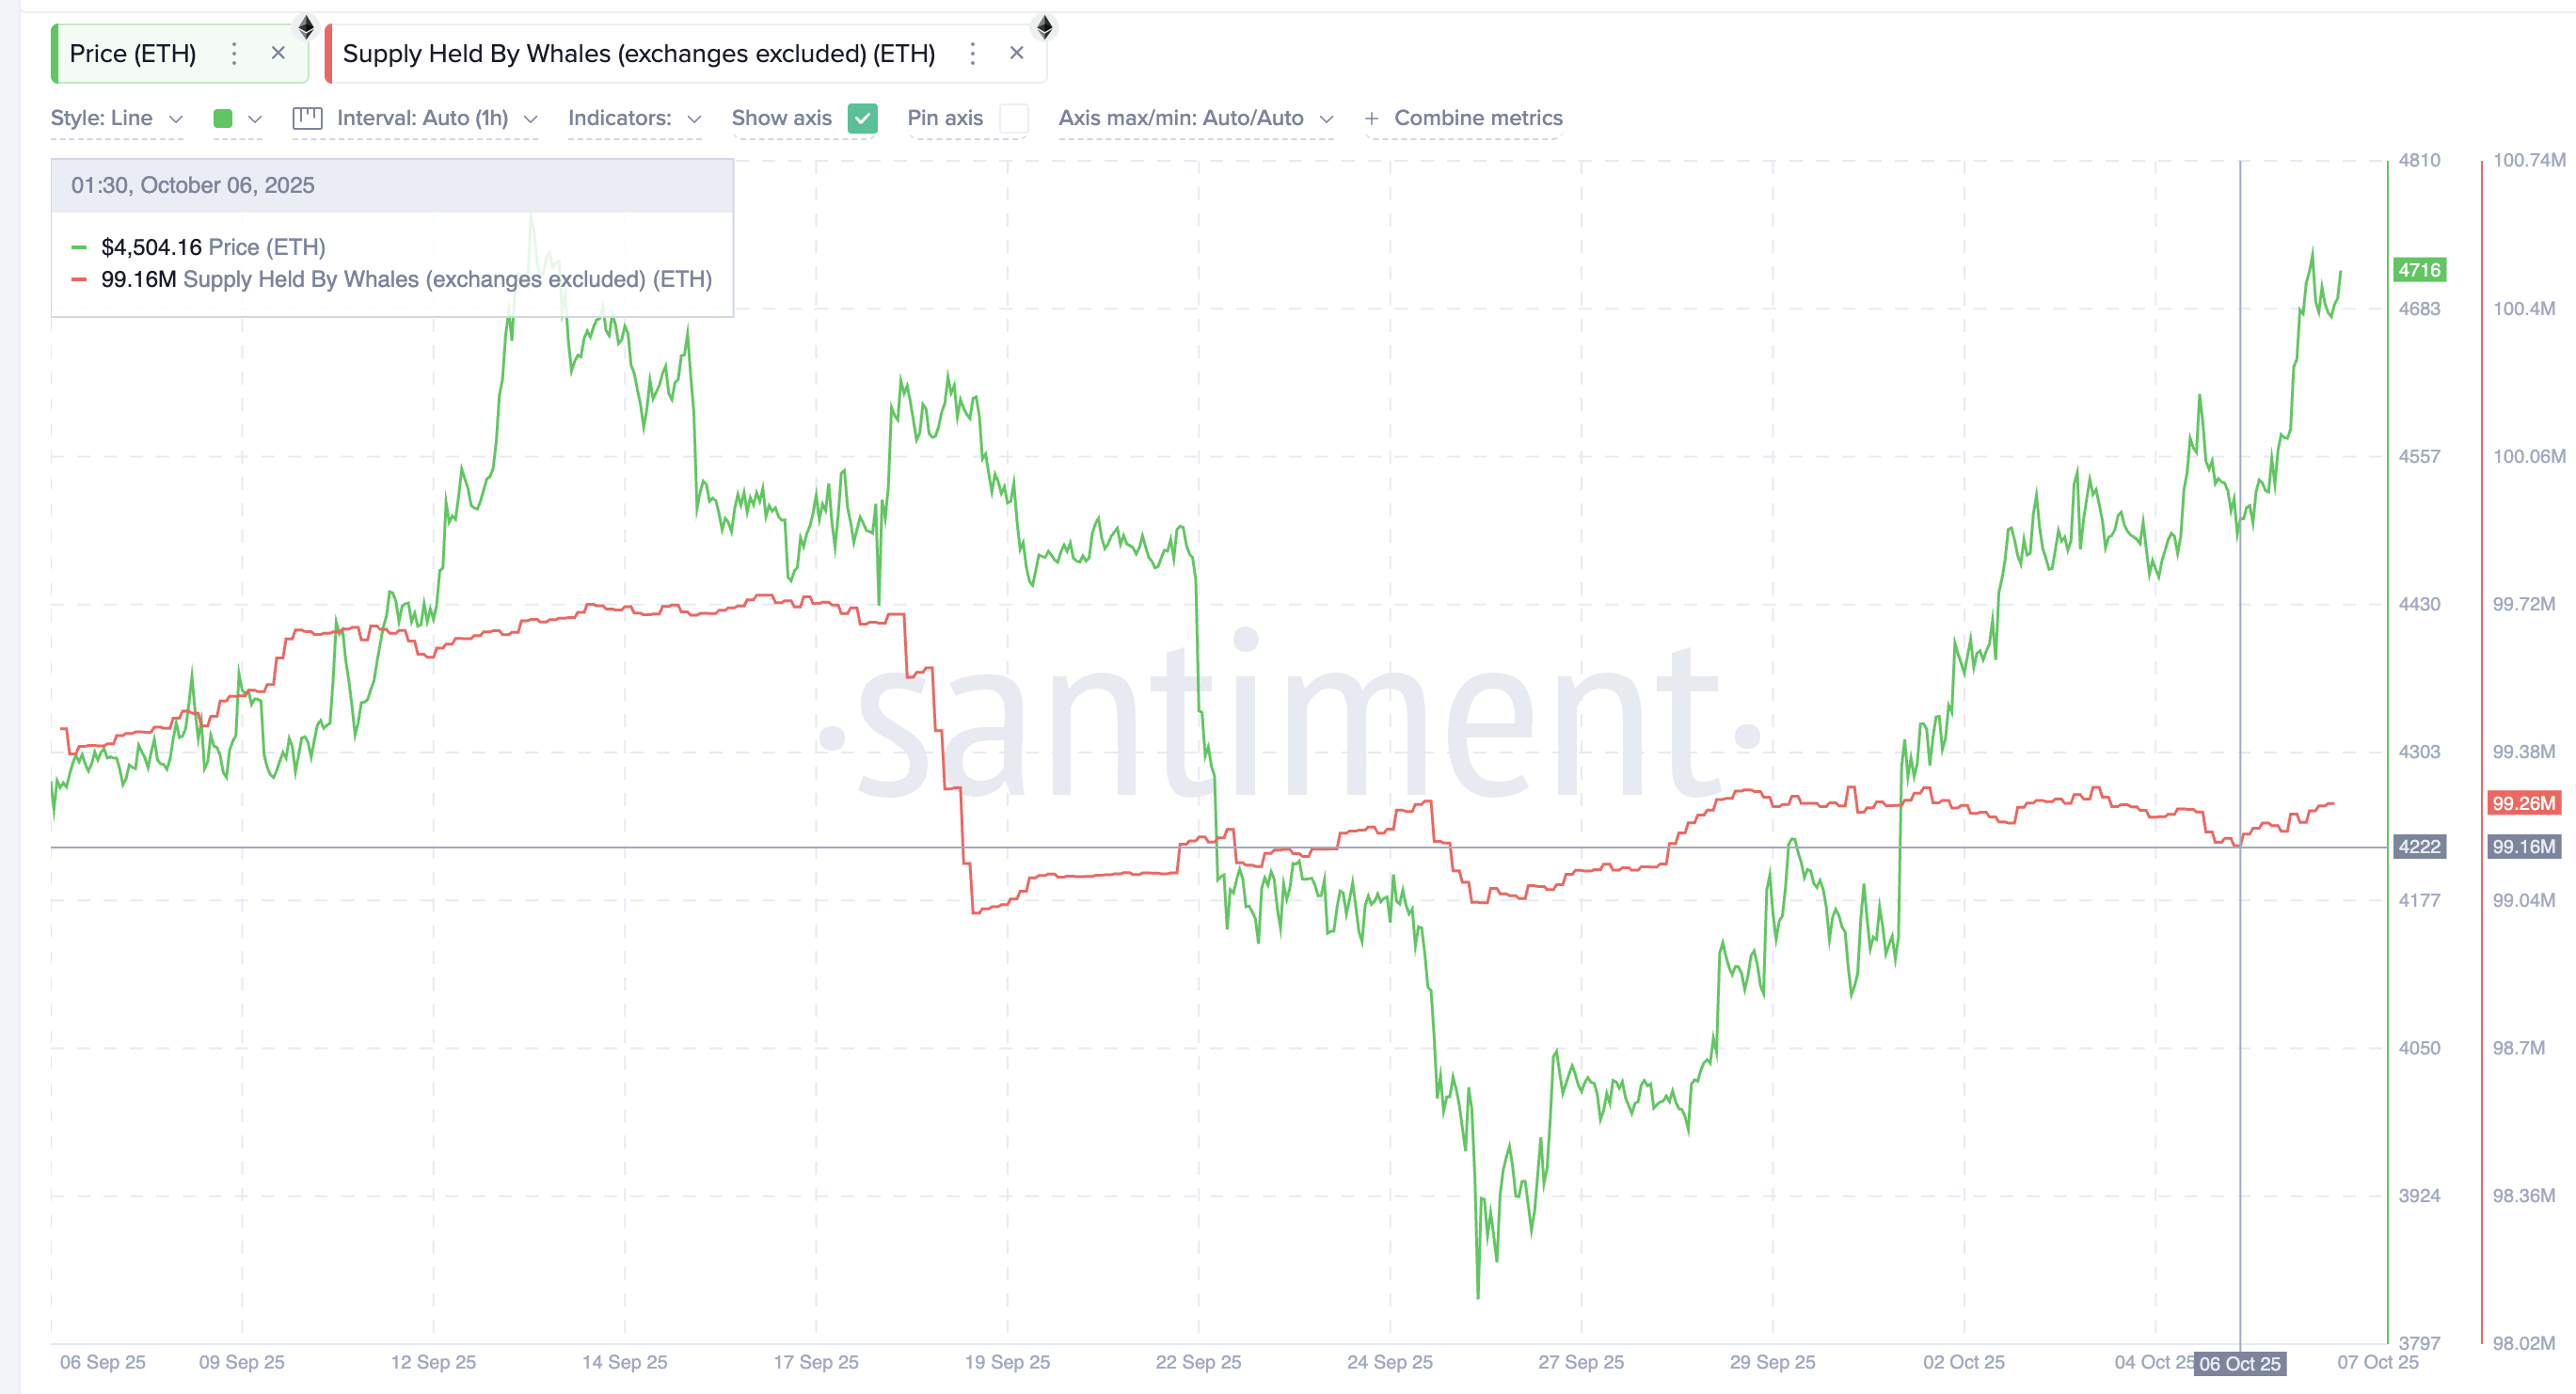
However, whale wallets holding large amounts of ETH are still showing conviction. Over the past two days, their combined holdings have increased from 99.16 million to 99.26 million ETH, roughly $470 million, according to Santiment data.
That’s a slow but steady sign of confidence, even as some traders book gains, possibly retail.
SponsoredSponsored
This mix of light retail selling and cautious whale buying usually signals that markets are waiting for a better entry — often right before a short-term price correction.
On the daily chart, Ethereum trades inside an inverse head-and-shoulders pattern, a structure that often forms before bullish breakouts. The “head” sits lower, while the neckline aligns around $4,740.
For the pattern to complete, Ethereum might need to dip toward $4,410 to form the right shoulder, a 6% move on the downside from the current levels. The Relative Strength Index (RSI), which tracks buying momentum, supports this setup. Between September 12 and October 7, RSI made a higher high while prices made a lower high — a hidden bearish divergence that often precedes a correction.
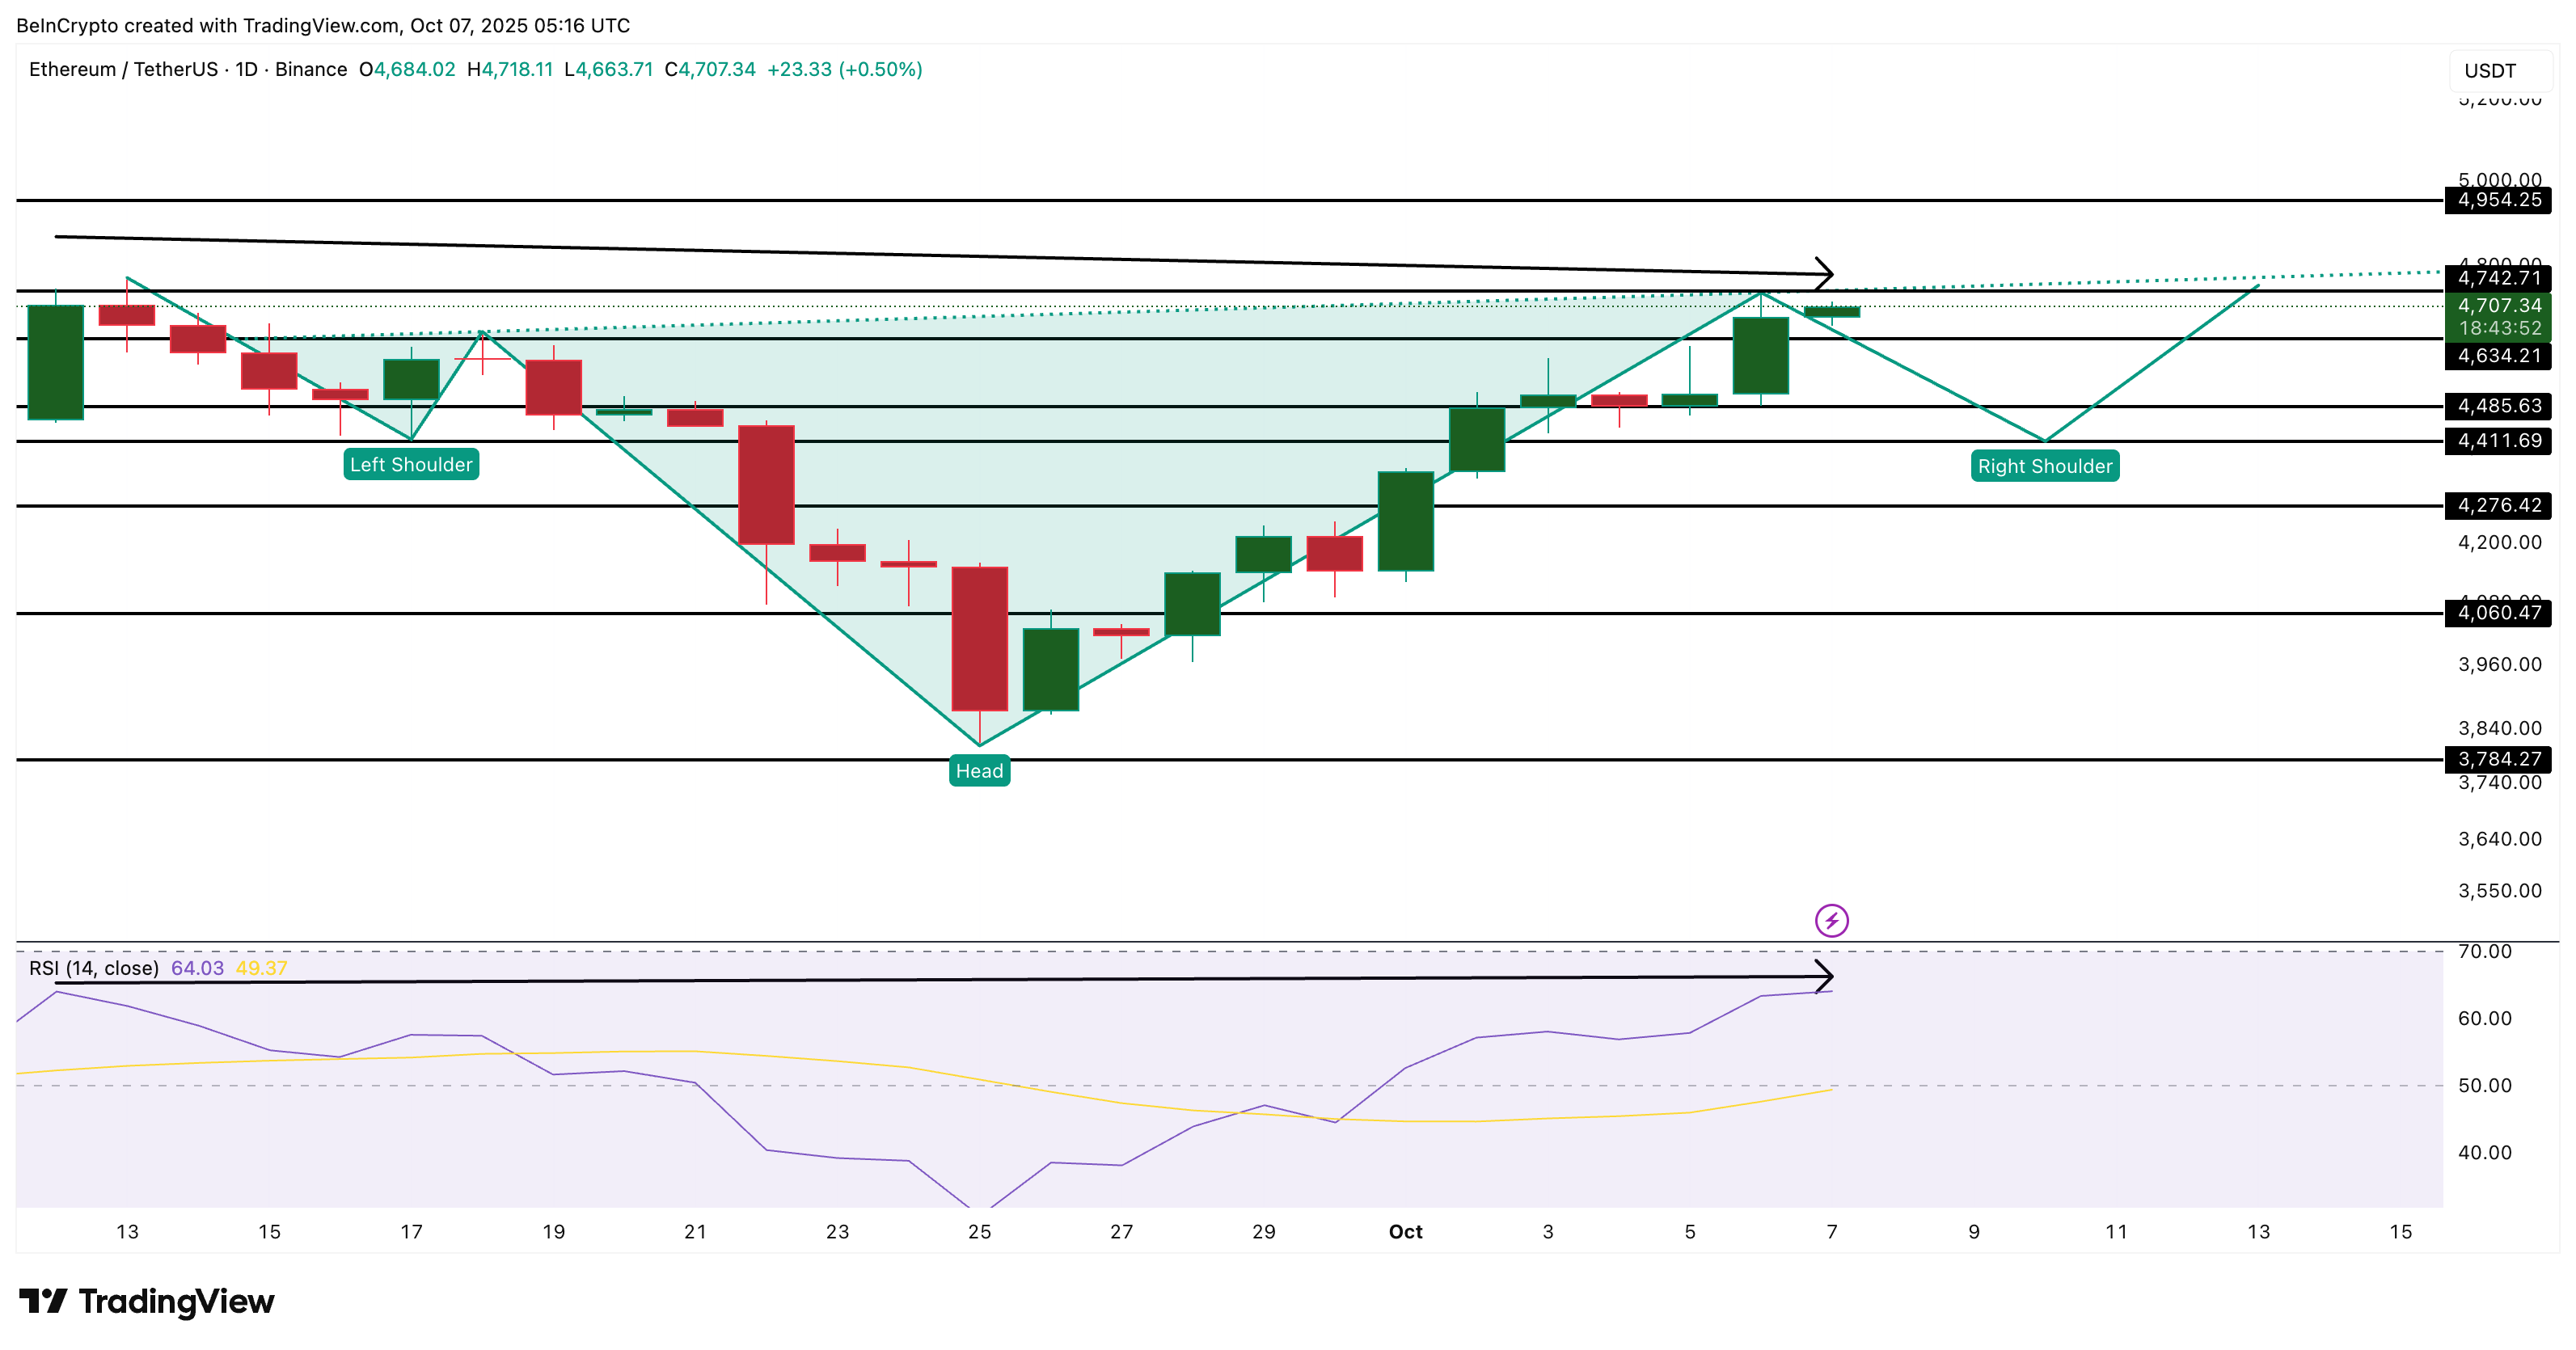
If the pullback happens, a bounce near $4,410 could set Ethereum up for a breakout above $4,740. A confirmed daily candle above that level would open the door to $4,950 (near the previous all-time high), and possibly new highs beyond it.
On the flip side, if Ethereum skips the correction and closes above $4,740 now, the immediate dip thesis would be invalidated, confirming continued strength. A more bearish scenario, however, would unfold only if the Ethereum price falls below $4,270, which would delay the bullish pattern and extend the consolidation.
Either way, Ethereum’s broader uptrend remains intact — this pause just might be the calm before another strong push upward.
Search
RECENT PRESS RELEASES
